Summary
Antibodies recognizing infliximab (IFX) may develop in a proportion of treated patients, leading to loss of response or hypersensitivity reactions (HRs). T cell response to IFX has been poorly investigated. This paper was addressed to detect IFX‐specific T cells in treated patients with inflammatory diseases developing, or not, anti‐drug antibodies (ADA) and to correlate the presence of specific T cells with the clinical outcomes of the treatment. A co‐culture system of IFX‐loaded dendritic cells and purified autologous CD4+ T cells was used to detect memory T cells in 32 ADA+ and 39 ADA– IFX‐treated patients and control groups. The cytokine profile of IFX‐specific T cells was also studied in culture supernatants. IFX‐specific cell proliferation was detected mainly in cells from ADA+ patients, irrespective of their different diseases. HR patients displayed higher T cell proliferation than non‐responder and tolerant patients. A mixed [interferon (IFN)‐γ, interleukin (IL)‐13, IL‐10] cytokine profile was shown in cells from ADA+ patients, while IL‐10 was the most frequently detected cytokine in the supernatants of cultures from ADA‐ patients. Immunoglobulin (Ig)E+ADA+ patients with previous HRs exhibited a more pronounced type 2 profile than IgE–ADA+ patients. This work provides evidence that IFX‐specific circulating T cells are detectable mainly in ADA+ patients with HRs, regardless of their disease. The IFX‐induced cytokine pattern partially correlates with the ADA isotype.
Keywords: allergy, arthritis, cytokines, T cells
Introduction
Infliximab (IFX) is a chimeric monoclonal antibody (mAb) composed of the human constant region of immunoglobulin (Ig)G1k and murine variable regions, applied successfully to the treatment of many chronic immune‐mediated disorders 1, 2, 3, 4. However, IFX is potentially immunogenic, and its administration may elicit a stable sensitization characterized by the development of anti‐drug antibodies (ADA) 5. The development of ADA complicate the treatment of patients seriously, as they may affect both the efficacy and safety of the drug, leading to loss of response (LOR) or hypersensitivity reactions (HRs) 6, 7, 8. While the detection of humoral response to IFX has been documented clearly 7, 8, 9, little is known about the cellular response to the drug 8, 9, 10, even if several lines of evidence indicate that the immune response to IFX is a T cell‐dependent event. In fact, ADA may belong to different Ig isotypes (such as IgG1 and IgE) which need switching signals provided by activated drug‐specific T cells 9, 10.
The aim of the study was to establish whether IFX treatment was able to induce circulating T cells in treated patients with different type of disease and to correlate the cellular response with ADA status and clinical outcomes of the therapy. IFX‐specific T cells were rarely detectable in ADA– patients, while they were detectable more frequently in patients with ADA positivity, regardless of the type of disease. Of note, a cellular response was detectable more frequently and higher in patients with immediate HRs than in non‐responder or tolerant patients. The IFX‐specific T cell response exhibited variable patterns of cytokine profile, related partially to the ADA isotype. On the whole, the assessment of cellular and humoral response provide evidence that IFX is immunogenic in the majority of exposed individuals.
Materials and methods
Patients
Blood samples were collected from 71 consecutive patients treated with IFX (5 mg/kg/8 weeks) suffering from immune‐mediated diseases [18 inflammatory bowel disease (IBD), 21 rheumatoid arthritis (RA), 11 spondyloarthritis (SpA), 21 vasculitis (Vas)]. In order to reduce drug interference with ADA detection, blood samples were obtained prior to application of IFX infusion at the end of each therapeutic cycle. All patients were evaluated for the presence of ADA at the moment of enrolment: 32 resulted ADA+ and 39 ADA–. Regarding the clinical outcomes to the treatment, 23 patients resulted tolerant, 26 displayed LOR and 22 experienced immediate HRs. All reactive patients had experienced an immediate infusion‐related event, during or within 1 h after the administration of therapy. The reaction was graded as mild (erythema, urticarial/angioedema), moderate (dyspnoea, stridor, wheeze, nausea/vomiting, dizziness, chest or throat tightness, abdominal pain) and severe [cyanosis or SaO2 < 92%, hypotension (<90 mmHg), confusion, loss of consciousness], according to Brown's classification 11. Specifically, we observed seven mild, nine moderate and six severe reactions. Cutaneous and respiratory symptoms were the most frequent clinical features, in particular flushing, itching and throat constriction. The in‐vitro response to IFX was evaluated within 60 days after the reactions. Control samples were obtained from 10 healthy donors (HD) and 10 unexposed disease‐control patients (four RA; five SpA; one Vas). All enrolled subjects did not show concomitant infections, recent (< 3 months) vaccinations and immunodeficiency at the time of blood sampling. Clinical responses were determined by disease‐specific scores on the day of blood sampling. Specifically, for the IBD patients, the Mayo Score Index and the Harvey–Bradshaw index score for ulcerative colitis and Crohn's disease were used 12, 13. For the RA patients, the delta disease activity score (ΔDAS28) according to the European League Against Rheumatism (EULAR) response criteria was used 14. For the SpA patients, we used the Bath Ankylosing Spondylitis Disease Activity Score (BASDAI), and the response to treatment was defined according to the American Statistical Association (ASAS) consensus statement for the use of tumour necrosis factor (TNF)‐α inhibitors in SpA 15. For the Vas patients, the clinical response was assessed using the Birmingham Vasculitis Activity Score version 3 16. The IFX‐treated patients' demographic, clinical and laboratory characteristics are summarized in Table 1. The study was approved by the local Ethics Committee (2012/0035982), and written informed consent was received from the participants before their inclusion into the study.
Table 1.
Demographic and clinical infliximab (IFX)‐treated patients' characteristics
| All patients | BID | RA | SpA | VAS | |
|---|---|---|---|---|---|
| Total N | 71 | 18 | 21 | 11 | 21 |
| Male/female | 37/34 | 10/8 | 5/16 | 7/4 | 15/6 |
| Age, years | 45.4 ± 5.4 | 40 ± 9.4 | 42.3 ± 9.2 | 55.5 ± 16.7 | 48 ± 10.5 |
| Disease, years | 6 (4–10) | 8 (2–15) | 8 (3–14) | 7 (4–9) | |
| Disease activity* | 15.3 ± 0.5 † | 4.2 ± 0.8 | 6.4 ± 1.1 | 12.1 ± 2.2 | |
| 10.3 ± 1.2 ‡ | |||||
| Number of infusions § | 12.2 ± 7.1 | 27.1 ± 17.8 | 25.7 ± 19.4 | 29.2 ± 19.9 | |
| MTX use, n (%) | 16 (22.5) | – | 16 (76.2) | – | – |
| Oral steroids use, n (%) | 44 (62) | 6 (33.3) | 14 (66.6) | 3 (27.3) | 21 (100) |
| ADA + /ADA | 32/39 | 11/7 | 10/11 | 4/7 | 7/14 |
| Responder (ADA + ) | 23 (4) | 2 (0) | 6 (2) | 3 (1) | 12 (1) |
| Non‐responder (ADA + ) | 26 (9) | 7 (3) | 10 (4) | 5 (1) | 4 (1) |
| Reactive (ADA + ) | 22 (19) | 9 (8) | 5 (4) | 3 (2) | 5 (5) |
Mean values ± standard error (s.e.); median or percentages are shown. RA = rheumatoid arthritis; SPA = spondiloarthritis; BID = bowel inflammatory disease; VAS = vasculitis; ADA = anti‐drug antibodies; MTX = methotrexate. *Before starting infliximab (IFX). †Mayo score for ulcerative colitis. ‡Harvey–Bradshaw index score for Crohn disease. §At the moment of the study.
ADA detection and IFX measurement
The ADA status of patients was evaluated by using a commercially available bridging enzyme‐linked immunosorbent assay (ELISA) kit (Immunodiagnostik AG, Bensheim, Germany), according to the manufacturer's instructions. The assay includes an acid dissociation step of immunocomplexes to overcome the problem of drug interference. The screening cut‐point was obtained from the evaluation of 56 untreated disease‐matched patients (optical densities: 0·09) according to the recommendations for the validation of immunoassays for the detection of ADA 17. This value was determined statistically to yields with a 5% false positive rate. IFX‐specific IgE ADA were measured via an ImmunoCAP assay (kindly provided by Thermo Scientific‐Phadia, Uppsala, Sweden), as reported previously 18. The threshold value for a positive result was 0·10 kUA/l. An ELISA test (Immunodiagnostik AG) was applied to determine the serum levels of IFX. Blood samples were obtained prior to application of IFX infusion at the end of each therapeutic cycle.
T cell amplification assay
The T cell proliferation upon IFX stimulation was assessed by using a CD4+ T cell–dendritic cell co‐culture system (CS) 19. Monocyte‐derived dendritic cells (DC) were generated from plastic‐adherent peripheral blood mononuclear cells (PBMCs) after 4 days of culture in complete medium plus 5% heat‐inactivated human serum AB supplemented with recombinant human interleukin (IL)‐4 (200 ng/ml) and granulocyte–macrophage colony‐stimulating factor (GM‐CSF) (100 ng/ml). On day 4, the medium was replaced with fresh complete medium plus IL‐4 and GM‐CSF in addition to human TNF‐α (20 ng/ml). On day 7, the DCs were antigen (or medium)‐loaded (50 μg/ml) for 2 h at 37°C, irradiated (at 6000 rad), washed and co‐cultured (104 cells/ml) with 105 CD4+ T cells in 96‐well plates. CD4+ T cells were isolated from the autologous PBMCs by positive selection using an anti‐CD4 monoclonal antibody coupled to magnetic microbeads (Miltenyi Biotech, Bergisch Gladbach, Germany), following the manufacturer's instructions. Co‐cultures were incubated at 37°C for 72 h, the supernatants were then collected, and [3H]‐TdR (0·5 μCi) was added for assessment of the proliferation. Positive responses were defined as those with mitogenic index (MI) ≥ 2. Increasing doses of IFX from 6·5 to 50 µg/ml were used in several initial dose‐finding assays.
Cytofluorimetric analysis of cell antigens
Cytofluorimetric analysis was performed for the assessment of cellular death and to evaluate the percentage. For the assessment of cellular death, cells were cultured in media alone or with anti‐ major histocompatibility complex (MHC) class II (5 µg/ml) or IFX (50 µg/ml) for 5 days and then evaluated for propidium iodide uptake according to the manufacturer's instructions (Miltenyi Biotech).
Cytokine measurements in the supernatants
Supernatants obtained from the CS cultures were assayed for IFN‐γ, IL‐13, IL‐17A and IL‐10 with commercially available ELISA kits (R&D Systems, Minneapolis, MN, USA).
Statistical analysis
The results are presented as mean ± standard error of the mean (s.e.m.). The statistical analyses were performed using Student's t‐test, Wilcoxon's signed‐rank test, Fisher's exact test and Spearman's test. P‐values < 0·05 were considered significant.
Results
IFX‐induced T cells are detectable mainly in ADA+ patients
To establish whether IFX induced cellular immunity in exposed individuals and drug‐specific T cells could be detected in their blood, irrespective of their diseases, we enrolled 71 (32 ADA+ and 39 ADA–) consecutive IFX‐treated patients suffering from RA (n = 21), IBD (n = 18), Vas (n = 21) and SpA (n = 11) and 10 unexposed healthy donors (HD) and 10 disease control patients. T cell proliferation was detectable in 20 of 71 patients (28·2%), occurring primarily in ADA+ patients (18 of 32, 56·3%) in comparison to ADA– patients (two of 39, 5·1%; P < 0·0001). CS assay resulted negative in HD and disease‐control patients (Fig. 1a). The absence of circulating IFX excluded drug interference in ADA detection in the two ADA– patients (data not shown). Of note, the proliferative response to IFX of CD4+ cells from ADA+ patients was inhibited by anti‐major histocompatibility complex (MHC) class II‐, but not by the isotype control mAbs in a dose‐dependent fashion (Fig. 1b), thus suggesting the presence of a MHC‐restricted drug‐specific T cell response. Of note, both the anti‐MHC class II mAb and IFX did not increase apoptosis (Fig. 1c). IFX‐specific T cells were detectable in treated patients regardless of their disease. Notably, we did not observe any significant differences in the T cell assay positivity between patients with different diseases (Fig. 1d). Moreover, ADA+ patients showed higher CS positivity than ADA– patients regardless of the disease (Fig. 1d). No influence of the concomitant treatment was observed in the proliferative response to IFX (data not shown).
Figure 1.
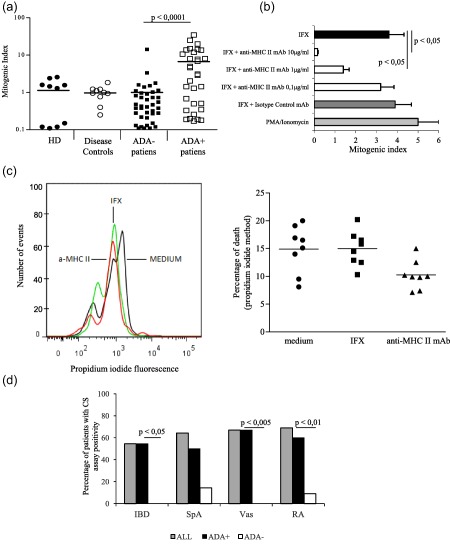
T cell response to infliximab (IFX) and its correlations with anti‐drug antibody (ADA) status. (a) Mitogenic index of CD4+ T cell–dendritic cell co‐culture assay in healthy donors (HD), untreated disease control subjects and IFX‐treated (ADA+ and ADA–) patients. Each dot represents an individual subject. (b) Major histocompatibility complex (MHC) class II restriction of T cell response to IFX. Data are expressed as mean values ± standard error (s.e.) obtained from three ADA+ patients. (c) Effects of anti‐MHC class II monoclonal antibodies (mAb) and IFX on cell viability in the culture. (d) T cell response to IFX in different diseases. IBD = inflammatory bowel disease; SpA = spondiloarthropathies; Vas = vasculitis; RA = rheumatoid arthritis.
Among the group of ADA+ patients, those exhibiting CS positive assay showed significantly (P < 0·05) higher ADA levels than patients displaying a negative assay (Fig. 2a). Furthermore, a statistically significant correlation between the CS mitogenic indices of each sample and the corresponding serum ADA levels, but not the drug concentration, was shown (Fig. 2b).
Figure 2.
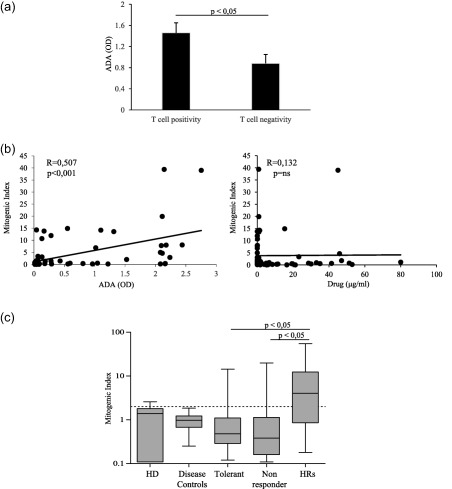
Correlation between T cell response, anti‐drug antibody (ADA) levels and clinical outcome to the treatment. (a) ADA levels in patients with and without T cell proliferative response to infliximab (IFX). (b) Correlation between mitogenic index of T cell proliferation and ADA levels (left panel) and serum drug concentration (right panel) in treated patients. (c) Mitogenic index of T cell proliferation in patients with different clinical outcome. Data are expressed as mean values ± standard error (s.e.). OD = optical density; HD = healthy donors; HRs = hypersensitivity reactions.
When IFX‐treated patients were categorized according to clinical therapeutic outcomes, the majority of subjects who exhibited anti‐drug T cells belonged to the reactive group (13 of 22, 59%) patients, whereas the proportions of non‐responder (four of 26, 15·3%) and tolerant (two of 23, 8·6%) patients with detectable T cell response were significantly (P < 0·001) lower. Furthermore, HRs patients showed higher mitogenic indices than both non‐responder and tolerant patients (Fig. 2c). Accordingly, we observed a significantly higher frequency of ADA positivity among HRs patients (19 of 22, 86·3%) than among LOR (nine of 26, 34·6%, P < 0·001) or tolerant (four of 23, 17·3%, P < 0·001) patients. In addition, HRs patients showed significantly higher (P < 0·0005) ADA levels [optical density (OD) mean values ± s.e.m., 2·23 ± 0·19) than non‐responder (0·33 ± 0·13) or tolerant patients (0·224 ± 0·08). Regarding both ADA positivity and ADA levels, no differences were shown between non‐responder and tolerant patients.
Cytokine patterns of IFX‐specific T cells of drug‐treated patients
For the next step, we evaluated the IFX‐driven cytokines content (IFN‐γ, IL‐13 and IL‐17A and IL‐10) in the supernatants of CS assay of each patient.
Whereas no cytokines were detectable in CS supernatants from HD and untreated disease controls, one or more cytokines were present in 30 of 71 (42.2%) culture supernatants, but more importantly, one or more cytokines were detectable in 59·3% of supernatants from the ADA+ patients (19 of 32) and in 28·2% from the ADA– patients (11 of 39) (P < 0·001). Notably, a higher proportion of cytokines in culture supernatants from ADA+ patients in comparison to those from ADA– subjects, was confirmed in all group of the patients, regardless of the type of disease (data not shown). No different amounts of the three cytokines were found in supernatants from ADA+ and ADA– patients (data not shown).
Overall, IL‐10 was the most frequently detectable cytokine, as it was present in 21 of 71 (29·5%) CS supernatants, while IFN‐γ was present in 10 (14·1%) and IL‐13 in 13 (18·3%) supernatants. IL‐17A was never detected (Fig. 3a). While IFN‐γ and IL‐13 were significantly more frequent in the supernatants from ADA+ than ADA– patients (Fig. 3b), no significant difference was found in the proportion of IL‐10 containing supernatants between ADA+ and ADA– patients [12 of 32, 37·5% versus nine of 39, 23%, P = not significant (n.s.)]. More interestingly, however, IL‐10 secretion was not associated with the production of the other two cytokines in the supernatants from ADA– patients, while it was detected with IFN‐γ and/or IL‐13 in supernatants from ADA+ patients (Fig. 3c).
Figure 3.
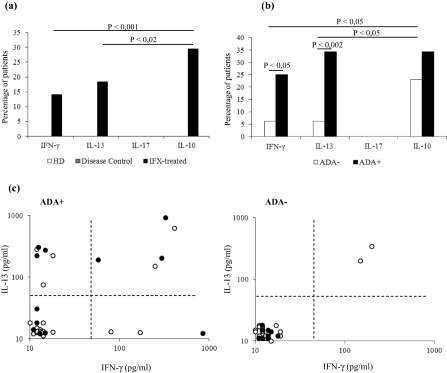
Cytokine profile of the infliximab (IFX)‐specific T cells. (a) Cytokine production in the culture supernatants of the IFX‐treated patients and control groups upon IFX stimulation. Data are expressed as mean values ± standard error (s.e.). (b) IFX‐driven cytokine production by anti‐drug antibody (ADA)+ and ADA– IFX‐treated patients. Data are expressed as mean values ± s.e. (c) Interleukin (IL)‐10 production (black dots) by IL‐13 and interferon (IFN)‐γ‐producing cultures in ADA+ and ADA– patients. Each dot represents an individual subject.
When the cytokine production was correlated with clinical outcomes, the proportions of supernatants with at least one detectable cytokine from the HRs patients (14 of 22, 63·6%) resulted significantly higher than those from patients with LOR (nine of 26, 34·6%, P < 0·05) and tolerant patients (seven of 23, 30·4%, P < 0·02), no difference being observed between the last two groups of subjects. In addition, a mixed pattern of cytokine production was detected for both HRs and non‐responder patients, while cells from tolerant subjects were able to produce only IL‐10 upon in‐vitro restimulation with IFX (Fig. 4a). More importantly, IL‐10 was never detected in association with the IFN‐γ or IL‐13 in the supernatants from tolerant patients, whereas it was detected with the other two cytokines in supernatants from non‐responder and from HRs patients (Fig. 4b).
Figure 4.
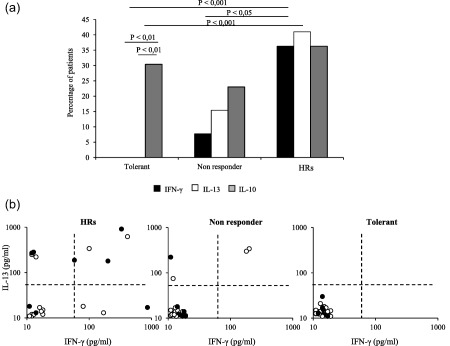
Infliximab (IFX)‐driven cytokine production in patients with different clinical outcomes. (a) Interferon (IFN)‐γ, interleukin (IL)‐13 and IL‐10 production by co‐culture assay obtained from tolerant, non‐responder and reactive patients to IFX therapy. (b) IL‐10 production (filled circle) by IL‐13 and IFN‐γ‐producing cultures in patients with different clinical outcome to the treatment. Each dot represents an individual subject. HRs = hypersensitivity reactions.
On the whole, the three assays (ADA detection, CS assay and the cytokine production) showed IFX sensitization in the majority of drug‐exposed individuals, resulting cumulatively positive in 86·3% (19 of 22) of HRs in 57·6% (15 of 26) of non‐responder and in 34·7% (eight of 23) of tolerant patients.
Long‐term detection of T cell proliferation
In order to evaluate whether the IFX‐specific T cells were detectable over time, we assessed the CS assay in the blood of an additional group of eight ADA+ and eight ADA– patients selected for having interrupted the treatment at least 5 months previously (range 5–99 months). Six of the eight ADA+ patients showed positive CS assay, whereas none of ADA– patients did (P < 0·001) (Table 2). Importantly, a significant (P < 0·01) correlation between mitogenic index and ADA levels was also found in out‐of‐therapy patients (Fig. 5). When the cytokines in the group of out‐of‐therapy patients were evaluated, they were detected in seven of the supernatants from eight ADA+ and in one of the eight ADA– patients (P < 0·01) (Table 2).
Table 2.
ADA, cell proliferation and cytokine production after drug interruption
| ADA+ patients | Months after interruption | ADA (OD) | Mitogenic index | IFN‐γ | IL‐13 | IL‐10 |
|---|---|---|---|---|---|---|
| 1 | 14 | 2.111 | 4.64 | + | + | – |
| 2 | 12 | 2.752 | 19 | + | – | – |
| 3 | 16 | 2.438 | 8.07 | – | – | + |
| 4 | 17 | 0.806 | 0.35 | – | – | – |
| 5 | 69 | 1.313 | 13.6 | – | + | – |
| 6 | 99 | 2.160 | 0.68 | + | – | + |
| 7 | 88 | 2.110 | 19.9 | – | + | – |
| 8 | 96 | 0.281 | 11.97 | + | + | + |
| ADA– patients | Months after interruption | ADA (OD) | Mitogenic index | IFN–γ | IL–13 | IL–10 |
|---|---|---|---|---|---|---|
| 1 | 16 | 0.063 | 1.4 | – | – | – |
| 2 | 12 | 0.041 | 0.03 | + | + | – |
| 3 | 8 | 0.089 | 0.27 | – | – | – |
| 4 | 5 | 0.039 | 1.52 | – | – | – |
| 5 | 48 | 0.016 | 0.02 | – | – | – |
| 6 | 84 | 0.065 | 0.82 | – | – | – |
| 7 | 85 | 0.045 | 1.02 | – | – | – |
| 8 | 49 | 0.039 | 0.28 | – | – | – |
ADA = anti‐drug antibodies; OD = optical density; IFN = interferon; IL = interleukin.
Figure 5.
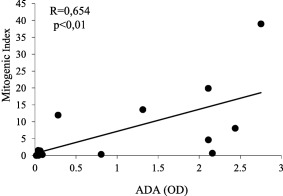
Correlation between cell proliferation and anti‐drug antibody (ADA) levels in patients who have interrupted the infliximab (IFX) treatment. ADA levels are expressed by optical density (OD) values and cell proliferation by mitogenic index. Analysis performed by Spearman's test.
IFX‐specific T cells able to produce high levels of IL‐13 are present in IgE+ HR patients
Seven of 22 HRs patients displayed ADA belonging to the IgE isotype (IgE+ ADA+ patients). We then compared the proliferation and cytokine production of CD4+ T cells from IgE+ADA+ and IgE–ADA+ HRs patients. T cell positivity was shown more frequently, although not significantly, in IgE+ADA+ (six of seven; 85·7%) than in IgE–ADA+ patients (seven of 15, 46·6%). The mean mitogenic index values (± s.e.m.) were also similar in the two patient groups (IgE+ADA+: 8·72 ± 1·87; IgE–ADA+: 6·07 ± 1·3, P = n.s.).
Of note, the CS supernatants from the IgE+ADA+ patients showed significantly (P < 0·05) higher levels of IL‐13 and lower, although not significant, levels of IFN‐γ and IL‐10 than those from the IgE–ADA+ patients (Fig. 6).
Figure 6.
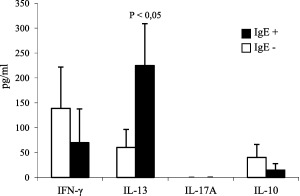
T helper type 2 (Th2) profile of memory T cells from hypersensitivity reaction (HR) patients with immunoglobulin (Ig)E anti‐drug antibody (ADA). Interleukin (IL)‐13, interferon (IFN)‐γ and IL‐10 content in culture supernatants from ADA+‐reactive patients with (n = 7) or without (n = 15) IgE ADA. Data are expressed as mean values ± standard error (s.e.).
Discussion
This study was addressed to detect and characterize the anti‐IFX T cells in treated patients suffering from different diseases. The results revealed that circulating drug‐specific T cells were detectable in a proportion of IFX‐treated patients in relation to their ADA status. Cellular response to IFX was observed in a large proportion of the ADA+ subjects, but in only very few ADA– patients. We also showed that the in‐vitro proliferative response to IFX was restricted to MHC class II molecules and was never detected in unexposed patients, thus indicating the onset of a full adaptive immunity to the drug. The lack of IFX‐specific T cell proliferation in some ADA+ patients may be related to the sensitivity of the assay providing some false negative results. However, the presence of a T cell‐independent humoral response cannot be excluded in these patients. In fact, ADA (usually of IgM isotype) may be induced directly by aggregated drug molecules that interact and activate specific B cells. Another important issue is that the cellular response was observed mainly in ADA+ patients irrespective of the type of underlying diseases sustained by different pathogenic mechanisms. Even though these data should be confirmed in a wider group of patients, they suggest a general mechanism of drug immunogenicity probably linked more to the immunological status of patients than to the type of disease. In fact, naive T cells specific for therapeutic antibodies have been found in healthy donors, providing evidence of a potential recognition of mAbs sequences in individuals with different HLA‐DR, irrespective of the diseases 10.
In our study, we observed that the cellular response to IFX occurs primarily in patients experiencing HRs and rarely in the subjects with LOR. Although a definitive explanation for this finding is not clear, we noticed a correlation between the cellular and humoral responses; the rate of ADA positivity and the mean ADA titre were significantly higher among the HRs patients than those with LOR. These findings may suggest that patients with a stronger immune response against IFX are more prone to develop HRs.
The presence of a cellular response was also confirmed by the persistence of IFX‐driven T cells in patients during several years after interruption of the treatment. Indeed, in a group of selected patients out of therapy we observed that the majority of ADA+ patients and one ADA– subject exhibited a detectable CS positive assay and/or produced cytokines. The possibility to detect proliferation or cytokine production by IFX‐stimulated cells of patients out of therapy is strongly suggestive of the onset of memory T cells, and might represent a useful tool to evaluate the potential in‐vitro cross‐reactivity to other biologicals to be used as a second line of treatment 19. Another finding, which links the cellular and humoral immunity towards IFX, is the significant relationship between mitogenic indices of CS assays and ADA levels. This also suggests that the majority of ADA responses are a T cell‐dependent phenomenon occurring through the CD40L/CD40 interaction and adaptive/switching cytokines 20. On the contrary, no correlation was seen between the mitogenic indices of CS assays and the corresponding drug levels, thus suggesting no interfering/potentiating effects of IFX serum levels on memory T cell detection.
IFX‐driven cytokine production was detected not only in supernatants from the cultures proliferating to the drug, but also in some of the non‐proliferating cultures. This finding suggests that both assays (i.e. CS proliferation and cytokine production) are more sensitive than single tests in the detection of low levels of circulating anti‐drug memory T cells and more useful for monitoring the onset of drug sensitization. IFX‐specific T cells usually exhibit different patterns of cytokine profiles, including IFN‐γ, IL‐13 and IL‐10, but not IL‐17A. However, it is of great interest that in cultures from the seven IgE+ADA+ subjects the drug induced higher levels of IL‐13 (and lower IFN‐γ) in vitro than those from 15 IgE–ADA+ patients. This finding is in agreement with a report showing the high in‐vitro production of IL‐13, but not IFN‐γ, by T cells from a patient exhibiting HRs to rituximab and ADA of the IgE isotype 21.
The production of IL‐10 and type 2 cytokines by IFX‐driven T cells agrees with recent data showing a prevalent activation by a different anti‐TNF‐α mAb in T helper cells of selective transcription (AIALOS) factor favouring the production of two such cytokines 22. Additionally, our data are also in agreement with a report showing that neutralizing TNF‐α during naive T cell priming is able to shift the balance of T cell differentiation towards IL‐10‐producing T cells 23. This could explain the underestimated detection of memory T cells and could add new insights into the immunoregulatory activities of the drug 24, 25, 26, 27.
In conclusion, circulating IFX‐specific T cells are detectable in exposed patients suffering from immunomediated disorders, regardless of the type of disease. The detectability of cellular immune response is dependent upon ADA status and the clinical outcome to the therapy. Evaluations of proliferative responses alone may underestimate the exact incidence of T cell sensitization in treated patients, and the three tests (CS assay, cytokines and ADA) cumulatively allow acquiring evidence that IFX is immunogenic in the majority of treated patients. Our data concerning the IFX‐driven production of IL‐10 could suggest the existence of regulatory mechanisms interfering with the in‐vitro detection of drug‐specific T cells. Additionally, the in‐vivo protective role of IL‐10 production in the onset of immunogenicity and immunogenicity‐related clinical outcomes (adverse events and loss of response) should be analysed in depth.
Disclosure
None.
Ethics approval
Ethics approval was provided by Azienda Ospedaliero‐Universitaria Careggi Ethics Committee.
Acknowledgements
The paper was supported entirely by ABIRISK project from Innovative Medicines Initiative (IMI Call 2010) (115303).
References
- 1. Willrich MA, Murray DL, Snyder MR. Tumor necrosis factor inhibitors: clinical utility in autoimmune diseases. Transl Res 2015; 165:270–82. [DOI] [PubMed] [Google Scholar]
- 2. Bressler B, Haraoui B, Keystone E, Sette A. Optimizing use of tumor necrosis factor inhibitors in the management of immune‐mediated inflammatory diseases. J Rheumatol Suppl 2010; 85:40–52. [DOI] [PubMed] [Google Scholar]
- 3. Siddiqui MA, Scott LJ. Infliximab: a review of its use in Crohn's disease and rheumatoid arthritis. Drugs 2005; 65:2179–88. [DOI] [PubMed] [Google Scholar]
- 4. van Schouwenburg PA, Rispens T, Wolbink GJ. Immunogenicity of anti‐TNF biologic therapies for rheumatoid arthritis. Nat Rev Rheumatol 2013; 9:164–72. [DOI] [PubMed] [Google Scholar]
- 5. Mitoma H, Horiuchi T, Tsukamoto H et al Mechanisms for cytotoxic effects of anti‐tumor necrosis factor agents on transmembrane tumor necrosis factor alpha‐expressing cells: comparison among infliximab, etanercept, and adalimumab. Arthritis Rheum 2008; 58:1248–57. [DOI] [PubMed] [Google Scholar]
- 6. Arora T, Padaki R, Liu L et al Differences in binding and effector functions between classes of TNF antagonists. Cytokine 2009; 45:124–31. [DOI] [PubMed] [Google Scholar]
- 7. Horiuchi T, Mitoma H, Harashima S, Tsukamoto H, Shimoda T. Transmembrane TNF‐alpha: structure, function and interaction with anti‐TNF agents. Rheumatology (Oxf) 2010; 49:1215–8. [DOI] [PMC free article] [PubMed] [Google Scholar]
- 8. Matucci A, Pratesi S, Petroni G et al Allergological in vitro and in vivo evaluation of patients with hypersensitivity reactions to infliximab. Clin Exp Allergy 2013; 43:659–64. [DOI] [PubMed] [Google Scholar]
- 9. Ben‐Horin S, Yavzori M, Katz L et al The immunogenic part of infliximab is the F(ab)2, but measuring antibodies to the intact infliximab molecule is more clinically useful. Gut 2011; 60:41–8. [DOI] [PubMed] [Google Scholar]
- 10. Delluc S, Ravot G, Maillere B. Quantitative analysis of the CD4 T‐cell repertoire specific to therapeutic antibodies in healthy donors. FASEB J 2011; 25:2040–8. [DOI] [PubMed] [Google Scholar]
- 11. Brown SG. Clinical features and severity grading of anaphylaxis. J Allergy Clin Immunol 2004; 114:371–6. [DOI] [PubMed] [Google Scholar]
- 12. Lewis JD, Chuai S, Nessel L, Lichtenstein GR, Aberra FN, Ellenberg JH. Use of the noninvasive components of the Mayo score to assess clinical response in ulcerative colitis. Inflamm Bowel Dis 2008; 14:1660–6. [DOI] [PMC free article] [PubMed] [Google Scholar]
- 13. Harvey RF, Bradshaw JM. A simple index of Crohn's disease activity. Lancet 1980; 1:514 [DOI] [PubMed] [Google Scholar]
- 14. Fransen J, van Riel PL. The Disease Activity Score and the EULAR response criteria. Clin Exp Rheumatol 2005; 23:S93–9. [PubMed] [Google Scholar]
- 15. Braun J, Pham T, Sieper J et al International ASAS consensus statement for the use of anti‐tumour necrosis factor agents in patients with ankylosing spondylitis. Ann Rheum Dis 2003; 62:817–24. [DOI] [PMC free article] [PubMed] [Google Scholar]
- 16. Mukhtyar C, Lee R, Brown D et al Modification and validation of the Birmingham Vasculitis Activity Score (version 3). Ann Rheum Dis 2009; 68:1827–32. [DOI] [PubMed] [Google Scholar]
- 17. Shankar G, Devanarayan V, Amaravadi L et al Recommendations for the validation of immunoassays used for detection of host antibodies against biotechnology products. J Pharm Biomed Anal 2008; 48:1267–81. [DOI] [PubMed] [Google Scholar]
- 18. Vultaggio A, Matucci A, Nencini F et al Anti‐infliximab IgE and non‐IgE antibodies and induction of infusion‐related severe anaphylactic reactions. Allergy 2010; 65:657–61. [DOI] [PubMed] [Google Scholar]
- 19. Van den Bosch F, Deodhar A. Treatment of spondyloarthritis beyond TNF‐alpha blockade. Best Pract Res Clin Rheumatol 2014; 28:819–27. [DOI] [PubMed] [Google Scholar]
- 20. Maggi E, Vultaggio A, Matucci A. Acute infusion reactions induced by monoclonal antibody therapy. Expert Rev Clin Immunol 2011; 7:55–63. [DOI] [PubMed] [Google Scholar]
- 21. Vultaggio A, Matucci A, Nencini F et al Drug‐specific Th2 cells and IgE antibodies in a patient with anaphylaxis to rituximab. Int Arch Allergy Immunol 2012; 159:321–6. [DOI] [PubMed] [Google Scholar]
- 22. Evans HG, Roostalu U, Walter GJ et al TNF‐α blockade induces IL‐10 expression in human CD4+ T cells. Nat Commun 2014; 5:3199. [DOI] [PMC free article] [PubMed] [Google Scholar]
- 23. Boks MA, Kager‐Groenland JR, Mousset CM, van Ham SM, ten Brinke A. Inhibition of TNF receptor signaling by anti‐TNFα biologicals primes naïve CD4(+) T cells towards IL‐10(+) T cells with a regulatory phenotype and function. Clin Immunol 2014; 151:136–45. [DOI] [PubMed] [Google Scholar]
- 24. Vos AC, Wildenberg ME, Duijvestein M, Verhaar AP, van den Brink GR, Hommes DW. Anti‐tumor necrosis factor‐α antibodies induce regulatory macrophages in an Fc region‐dependent manner. Gastroenterology 2011; 140:221–30. [DOI] [PubMed] [Google Scholar]
- 25. Mitoma H, Horiuchi T, Hatta N et al Infliximab induces potent anti‐inflammatory responses by outside‐to‐inside signals through transmembrane TNF‐alpha. Gastroenterology 2005; 128:376–92. [DOI] [PubMed] [Google Scholar]
- 26. Baldwin HM, Ito‐Ihara T, Isaacs JD, Hilkens CM. Tumour necrosis factor alpha blockade impairs dendritic cell survival and function in rheumatoid arthritis. Ann Rheum Dis 2010; 69:1200–7. [DOI] [PubMed] [Google Scholar]
- 27. Belostocki K, Pricop L, Redecha PB et al Infliximab treatment shifts the balance between stimulatory and inhibitory Fcgamma receptor type II isoforms on neutrophils in patients with rheumatoid arthritis. Arthritis Rheum 2008; 58:384–8. [DOI] [PubMed] [Google Scholar]


