Abstract
The morphology of the brain and skull are important in the evaluation of the aging human; however, little is known about how the skull may change with age. The objective of this study was to evaluate the morphological changes of the adult skull using three‐dimensional geometric morphometric analysis of thousands of landmarks with the focus on anatomic regions that may be correlated with brain atrophy and head injury. Computed tomography data were collected between ages 20 and 100. Each scan was segmented using thresholding techniques. An atlas image of a 50th percentile skull was registered to each subject scan by computing a series of rigid, affine, and non‐linear transformations between atlas space and subject space. Landmarks on the atlas skull were transformed to each subject and partitioned into the inner and outer cranial vault and the cranial fossae. A generalized Procrustes analysis was completed for the landmark sets. The coordinate locations describing the shape of each region were regressed with age to generate a model predicting the landmark location with age. Permutation testing was performed to assess significant changes with age. For the males, all anatomic regions reveal significant changes in shape with age except for the posterior cranial fossa. For the females, only the middle cranial fossa and anterior cranial fossa were found to change significantly in shape. Results of this study are important for understanding the adult skull and how shape changes may pertain to brain atrophy, aging, and injury.
Keywords: aging, biomechanics, cranial fossa, morphometrics, skull, trauma
Introduction
The elderly constitute 12.9% of the United States population, a number that is anticipated to increase to nearly 20% by 2030 (Fowles & Greenburg, 2010). As the population ages, traumatic brain injury (TBI) risk increases, with falls and motor vehicle crashes (MVCs) being the leading causes of injury for this population (Coronado et al. 2005). Individuals aged 75 and older have the highest rates of TBI‐related hospitalization and death. One would anticipate that as the elderly population increases, TBI‐related mortality and morbidity will increase accordingly.
Shape is a parameter that often plays a role in the biomechanics of biological structures (Danelson et al. 2008; Gayzik et al. 2008). One of the physiological changes that may affect bone shape and structure includes bone remodeling where old bone is replaced by new tissue to adapt to mechanical loading and strain (Frost, 1996; Hadjidakis & Androulakis, 2006; Crockett et al. 2011). Bone remodeling is mediated in part by the endocrine system by hormones including the parathyroid and thyroid hormones which are affected by increasing age (Oddie et al. 1966). In addition to hormonal changes, there is a decrease in intracranial volume (ICV) and slight increase in cerebral spinal fluid (CSF) to maintain a relatively continuous intracranial pressure (ICP), which may also influence bone remodeling (Sowell et al. 2003). Each of these physiological processes may affect the bone surface over time and contribute to the dynamic change in adult skull shape and cortical thickness.
Previous research on the morphological changes of the brain and skull have been primarily focused on pediatrics (Axelsson et al. 2003; Danelson et al. 2008; Marcus et al. 2008; Pirouzmand & Muhajarine, 2008). Human cranial research has been focused on physical measurements using dried skulls or radiographic measurements from computed tomography (CT) scans (Chen et al. 2000; McIntyre & Mossey, 2003; Kanodia et al. 2012). Neubauer et al. (2009) describe the skull size and shape changes from newborn to adults (age unspecified) using a geometric morphometric analysis of CT data collected from dried crania (Neubauer et al. 2009). However, it is unknown what adult age group was represented and how these morphological changes extend to the elderly. Additional studies reported the adult skull geometric variations including the maximal skull width, cranial index, skull curvature, and posterior fossa angle (PFA) (McIntyre & Mossey, 2003; Pirouzmand & Muhajarine, 2008). However, these measurements do not capture the three‐dimensional (3D) dynamic shape change of the skull that may occur over a lifetime.
Geometric morphometrics measures the variability in landmark‐based coordinates that are considered to be ‘homologous’; homologous means that each landmark is traceable and comparable between subjects but unique to each subject. There are three types of landmarks that are commonly assessed in landmark‐based geometric morphometrics: true landmarks, pseudo‐landmarks, and semi‐landmarks. Pseudo‐landmarks are defined by relative location on a structure. 3D geometric morphometric analysis of pseudo‐landmarks is a powerful tool for analyzing surface data at a high resolution (Weaver et al. 2014,b). Many studies utilizing this type of analysis have been focused on evolutionary development of structures (Harvati, 2003; De Groote, 2011), as well as analysis of modern humans for clinical application (Fakhry et al. 2013). More recently, Weaver et al. (2014b) performed a 3D geometric morphometric analysis of the human rib cage from 339 subjects between the ages 0 and 100. In that study, a detailed 3D analysis of the shape change was performed documenting the morphological changes of the rib cage throughout development and old age using a grid of thousands of pseudo‐landmarks.
The objective of the present study is to develop an algorithm to identify a grid of geometrically homologous pseudo‐landmarks on the skull from 122 subject head CT scans. These landmarks will herein be referred to as homologous pseudo‐landmarks. Additionally, a 3D geometric morphometric analysis of the adult cranial vault and cranial base is performed to assess the shape variation in specific anatomic regions of the skull with age. Results of this study are important for understanding the adult skull, particularly the cranial base, and how shape changes may pertain to brain atrophy, aging, and injury.
Methods
Scan collection
A total of 122 existing normal head CT scans were obtained from the Wake Forest Baptist Health radiological database. The study was approved by the Wake Forest School of Medicine Institutional Review Board. The in‐plane scan resolution ranged from 0.488 to 0.625 mm with a 0.625‐mm slice thickness. All scans contained images from the foramen magnum to the top of the head. Subject ages ranged from 20 to 99 years with approximately one subject per age per sex (Fig. 1). Scans were visually inspected and radiology reports were reviewed to exclude skulls with anatomic or pathologic abnormalities such as skull or facial fractures, previous surgeries, congenital deformities, brain cancer, osteomyelitis, and prior TBI.
Figure 1.
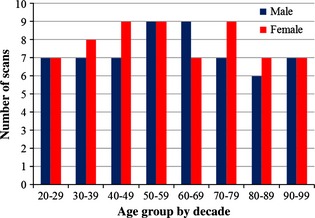
Distribution of head CT scans analyzed by decade.
Image segmentation and registration algorithm
Scans collected were acquired from the top of the head and terminated inferiorly at various levels ranging from the superior orbit to the chin. All scans included the full cranial base. Due to varied scan acquisitions depending on the original reason for collecting the head CT scan (i.e. trauma, neurological disease, etc.), the scans were grouped according to common cutting planes for image registration (Fig. 2). An initial plane was defined by three bony landmarks: left external auditory meatus (EAM), right EAM, and right zygomatic synchondrosis using geomagic studio (v12.1.0; Geomagic, Research Triangle Park, NC, USA). The first group of scans were cut from the middle orbit by translating the cutting plane to below the occipital condyles (Fig. 2A). The second group of scans were cut at the inferior orbit by translating the cutting plane to the inferior orbit (Fig. 2B). The third group of scans were cut with two planes (Fig. 2C). The initial plane (P1) was translated below the occipital condyles. A second plane (P2) was established by locating the two translated points from the EAM on the initial plane and the right infraorbital foramen. The fourth group of scans was cut similar to the third group; however, the second plane (P2) was established by locating the translated points from the EAM and the inferior nasal bone (Fig. 2D). The cuts of the 3rd and 4th planes were made inferiorly from the combination of the two planes intersecting.
Figure 2.
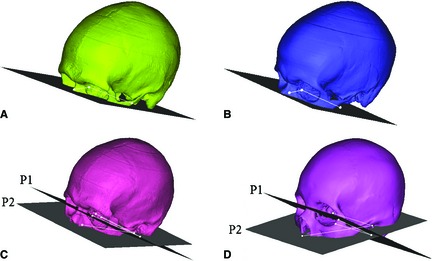
Four cutting planes utilized for improved image registration. (A) Mid‐orbit: translated below the occipital condyles. (B) Below Orbit: translated below the orbit. (C) Infraorbital Foramen: one plane translated to below the occipital condyles with another at the infraorbital foramen. (D) Nose: one plane translated to below the occipital condyles with another at the inferior nasal bone. (P1 = Plane 1, P2 = Plane 2).
Each subject scan was registered to map homologous pseudo‐landmarks from a skull atlas to each subject. The Global Human Body Models Consortium (GHBMC) 50th percentile male computer‐aided design (CAD) geometry is a symmetric model (Gayzik et al. 2011). Skull atlases were created from the CAD to reflect the four cutting planes. The CAD was converted to Digital Imaging and Communications in Medicine (DICOM) images using amira (v 5.4.3; Visage Imaging, San Diego, CA, USA). The CAD DICOMs were segmented in mimics (v14.0; Materialise, Leuven, Belgium) and a 3D model was created using geomagic studio (v12.1.0; Geomagic). This resulted in four atlas skulls that would be registered to the scans in the respective cutting plane group. Deviation analysis was performed to compare the 3D models segmented from the original CT and the CAD DICOMS to ensure the anatomy was not overly smoothed. The average deviation between the two models was 0.183 ± 0.187 mm, which is within the scanner resolution and was therefore deemed appropriate.
Each subject CT scan was segmented in mimics using bone thresholding to create a binary label map. Image registration was performed to determine the optimal transformation between atlas space and subject space (Fig. 3). First, rigid registration was performed to globally align the atlas to the subject (Fig. 3A,B) using 3D Slicer (Fedorov et al. 2012). Then, affine and non‐linear registration was performed to normalize the atlas to the subject using symmetric diffeomorphic registration (SyN) within the Advanced Normalization Tools (ants) software (Avants & Gee, 2004; Avants et al. 2008) (Fig. 3C,D). Parameters for the normalization procedure included a three‐level Gaussian pyramid as the multi‐resolution strategy using the cross‐correlation similarity metric (iterations of 100 × 100 × 20), including initial affine registration using the default mutual information option. This process uses diffeomorphisms (differentiable and invertible maps with a differentiable inverse) to capture both large deformations and small shape changes (Avants et al. 2008). A set of diffeomorphisms was output that mapped the atlas to each subject.
Figure 3.
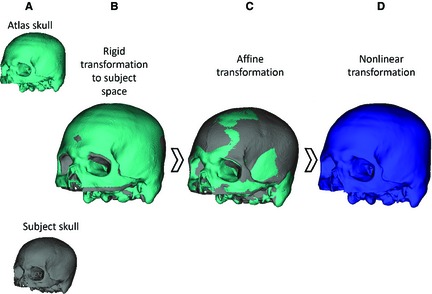
The image registration process: (A) atlas skull and subject skull begin in original image space, (B) rigid transformation from atlas space to subject space, (C) affine transformation to better align atlas to the subject, (D) nonlinear transformation using SyN to fully register the atlas to the subject.
Map homologous coordinates
A grid of 28 641 landmarks was established in atlas space at a 2 mm uniform resolution to capture the curvature of the skull defined at the highest cutting plane (at the level of the mid‐orbit) (Fig. 2A). The landmark set was generated by converting the 3D model of the highest cutting plane to a point cloud. An algorithm within geomagic studio was used to superimpose a virtual grid over the landmark set at 2 mm resolution. In this algorithm, the landmark closest to the center of each grid cell was retained in the landmark set. This landmark set was selected to be analyzed because the full landmark set of this cutting plane was included in each of the cutting planes. These landmarks were mapped to each subject by applying the unique forward registration transformations from atlas space to individual subject space. The landmarks for each subject were then partitioned to anatomically applicable regions including the inner cranial vault, outer cranial vault, inner frontal region and anterior cranial fossa, sphenoid crest and middle cranial fossa, and posterior cranial fossa. The inner cranial vault, anterior cranial fossa, middle cranial fossa, and posterior cranial fossa landmark sets were all isolated to the inner skull surface (Fig. 4).
Figure 4.
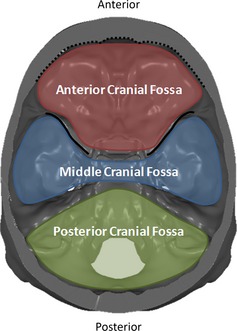
Superior view of the cranial base. The colored regions label the cranial fossae. The dotted line highlights the border along the inner surface of the frontal bone and the solid line highlights the sphenoid crest.
Generalized Procrustes analysis (GPA)
Geometric morphometric analysis is used to analyze Cartesian coordinate landmark datasets to assess group differences or sample variation. GPA, a geometric morphometric technique, utilizes multivariate statistical analysis to independently assess size and shape variations from landmarks while retaining geometric information. The GPA used is a true landmark method based on the homologous landmark method (Slice & Stitzel, 2004; Slice, 2005). This method was selected due to the high degree of accuracy resulting from the transformations computed during image registration from atlas space to subject space. The first step of the GPA iteratively computes the Procrustes mean of the x, y, and z coordinates of the respective structure for males and females, separately. Each landmark set was translated and rotated to align with an iteratively computed mean configuration. To isolate shape changes, the landmarks were scaled to a unit size through an isometric compression or dilatation based on the centroid size (CS). The CS is the square root of the summed squared Euclidian distances of the landmarks and their respective centroid. Following GPA, the landmark locations were linearly regressed with age and regression coefficients were output describing each landmark position with respect to age. A global GPA was performed for the full skull, as well as each anatomic region.
Statistical significance for many landmarks is commonly assessed using permutation testing (Good, 2000). Permutation testing assesses whether random configurations of regression coefficients better predict the landmark locations than the regression model. Permutation testing with 1 × 10⁵ random trials was used to assess statistical significance by comparing the sum of variance between the predicted and actual landmark locations to calculate a P‐value (Good, 2000; Gunz et al. 2005). This measures the sum of the squared model error between the predicted and actual landmark locations.
Results
Results were evaluated separately for the outer cranial vault, inner cranial vault, anterior cranial fossa, middle cranial fossa, and posterior cranial fossa for each sex. The number of homologous pseudo‐landmarks collected for each anatomic region was as follows: 7728 (outer cranial vault), 6635 (inner cranial vault), 1820 (anterior cranial fossa), 1195 (middle cranial fossa), and 1618 (posterior cranial fossa). Each structure was evaluated separately to determine regional changes in shape with age for each sex, and finally a global GPA was performed to assess the landmark set for the whole skull.
Shape
One result of the full landmark location analysis was a set of coefficients for linear parametric equations describing how shape changes as a function of age. From the permutation test, the test statistic, λ′, is the sum of the squared differences in the model. The summed squared difference, λ, is calculated for each permutation and compared with λ′. Statistical significance is achieved when <5% of the permutations have a λ less than λ′. The λ′ values and respective P‐values are provided in Table 1. For males, all anatomic regions reveal significant shape changes with age except the posterior cranial fossa. For females, only the middle cranial fossa and anterior cranial fossa were found to have significant shape changes with age. However, each region demonstrated a relationship between shape and age. In addition to region‐specific analysis, a global GPA analysis of the whole skull (with the landmark set selected from the first cutting plane) was performed yielding a significant change in shape with age for the female and male population (λ = 0.1094, P = 0.0141, λ = 0.0717, P = 0.0510, respectively).
Table 1.
λ′ and permutation‐based P‐values calculated for each anatomic region by sex. *denotes statistically significant result
| Structure | Sex | λ′ | P‐value |
|---|---|---|---|
| Outer | Female | 0.0528 | 0.0985 |
| Outer | Male | 0.0606 | 0.0333* |
| Inner | Female | 0.0634 | 0.0852 |
| Inner | Male | 0.0707 | 0.0344* |
| Anterior cranial fossa | Female | 0.1378 | 0.0002* |
| Anterior cranial fossa | Male | 0.1426 | 0.0007* |
| Middle cranial fossa | Female | 0.1095 | 0.0016* |
| Middle cranial fossa | Male | 0.1030 | 0.0001* |
| Posterior cranial fossa | Female | 0.1379 | 0.0517 |
| Posterior cranial fossa | Male | 0.1462 | 0.0569 |
Cranial vault – outer and inner skull
The significant shape changes of the outer cranial vault include relative expansion of lateral portions of the skull, primarily in the inferior parietal and temporal regions, with relative compression in the anterior and posterior regions near the frontal and posterior parietal regions. There is less shape change for the outer female skull. The significant changes in the inner cranial vault for males were relative expansion of the temporal, anterior parietal, and occipital regions. The relative compression of the inner skull is coincident with that of the outer skull. The female inner cranial vault expands in a manner similar to the males; however, much of the relative compression is within the frontal region and along the midline. The predictive shape models demonstrating these results are provided in Fig. 5.
Figure 5.
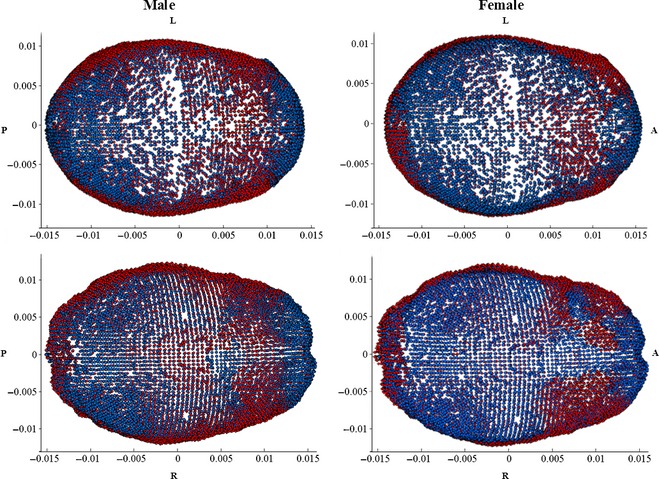
(Top left: male outer, top right: female outer, bottom left: male inner, bottom right: female inner): shape change from 20 (blue) to 100 (red) years of age. Shape changes are unitless and may be scaled to represent a certain CS. Regions with blue landmarks are considered to be regions of relative compression with age (i.e. frontal region). Landmark regions with red landmarks are considered to be regions of relative expansion with age (i.e. temporal regions). L, left; R, right; A, anterior; P, posterior.
Cranial base – anterior cranial fossa, middle cranial fossa, posterior cranial fossa
The anterior cranial fossa landmarks include the anterior cranial fossa and the inferior portion of the inner frontal bone surrounding the prefrontal region of the brain. The significant changes in the anterior cranial fossa for males and females are demonstrated by a relative bilateral widening, as well as relative compression toward the cerebrum in the inner frontal region (Figs 5 and 6). The compression is more pronounced in females than males. The significant middle cranial fossa changes for males and females are similar. The middle cranial fossa compresses inward with age along the sphenoid crest, posteriorly accompanied with a slight relative compression along the medial portion of the middle cranial fossa and the base of the fossa (Fig. 7). The relative compression of the sphenoid crest is more pronounced in males than females. There is a slight relative bilateral expansion along the lateral middle cranial fossa edges. The posterior cranial fossa shape changes were not significant; however, the predictive model results reveal a relationship between shape and age, evident from the concentrated locations of relative compression and expansion with age (Fig. 8).
Figure 6.
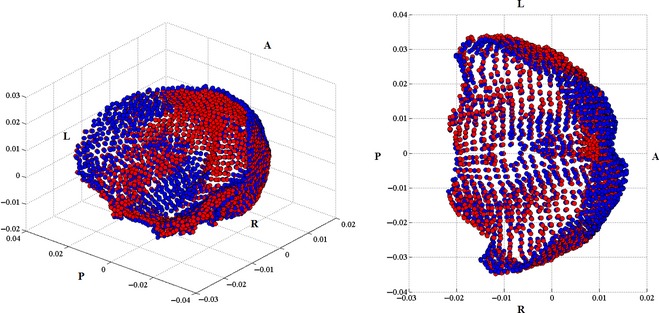
Left: isometric view of the female anterior cranial fossa and inner frontal region landmarks. This view is taken from the right posterior region of the skull, looking toward the left anterior view of the skull. Right: top view of the female anterior cranial fossa and inner frontal region facing inferiorly toward the base of the skull demonstrating the change in shape from 20 (blue) to 100 (red) years. L, left; R, right; A, anterior; P, posterior.
Figure 7.
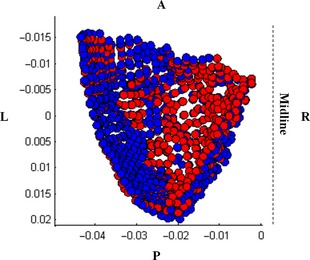
Top view of the interior of the left male middle cranial fossa facing inferiorly toward the base of the skull demonstrating the change in shape from 20 (blue) to 100 (red) years. L, left; R, right; A, anterior; P, posterior.
Figure 8.
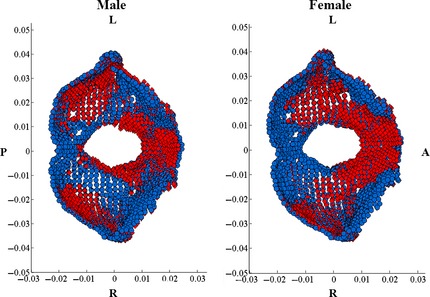
(Left: male, Right: female): Shape change from 20 (blue) to 100 (red) years of age. Landmark regions with blue landmarks are considered to be regions of relative compression with age (i.e. anterior portion of the FM for both male and female). Landmark regions with red landmarks are considered to be regions of relative expansion with age (i.e. region posterior to FM). L, left; R, right; A, anterior; P, posterior.
Discussion
The primary goal of this analysis was to utilize GPA to describe how anatomic regions of the skull change in shape with age. Anatomic regions were selected for analysis due to their hypothesized role in head injury biomechanics. Sex differences were explored due to the possible sex‐based allometry as well as differences in hormone changes with age between males and females. This study is the first of its kind to analyze the adult skull shape changes using a high density of landmarks from sub‐millimeter CT data. The semi‐automated method is valuable for studying age‐related morphology and associated injuries which may be affected by geometric variations with age and sex.
Previous studies have focused on geometric descriptions of the cranial vault and cranial base (Marcus et al. 2008). These measurements are traditionally two‐dimensional (2D) including the degree of curvature, skull width, and skull length. Many of the adult population studies focused on quantifying the average measurements of a population or subject variability. Pirouzmand et al. (2008) collected several measurements from lateral scout x‐rays and 3D head CT reconstructions but the radius measurements were collected manually and may not be compared one‐to‐one with a high degree of confidence as a set of homologous pseudo‐landmarks can be (Pirouzmand & Muhajarine, 2008).
Previous studies have hypothesized that with age, the cranial bones thicken as a result of decreased ICV (May et al. 2012; Royle et al. 2013). The hypothesized mechanism is that the skull compensates for the ICV loss and increases CSF to maintain a relatively constant ICP. The structural changes in skull shape with age may be a physiological response to mechanical force (Crockett et al. 2011). Local pressure changes due to gray matter volume (GMV) loss and increased CSF may cause localized mechanical forces, contributing to bone remodeling.
GPA results gathered from thousands of homologous pseudo‐landmarks demonstrate statistically significant adult skull changes in shape. Similarities were observed between sexes; however, the statistically significant shape changes occurred predominantly in the males. The cranial vault results demonstrate localized regions of shape change with relative compression in the frontal and posterior parietal regions and relative expansion in the inferior parietal and temporal regions. Relative compression in the frontal and posterior parietal regions parallels those regions of GMV loss most prominent in the dorsal frontal and parietal regions of the brain with age (Sowell et al. 2003). The relative expansion of the inferior parietal and temporal regions may correspond to the late increase in GMV (to age 30), followed by a stable decline (Sowell et al. 2003). The localized changes of inner skull shape are similarly reflected by changes in the outer skull. Further consideration of skull shape and volumetric brain changes may explain the relationship between age‐related changes in brain volume and skull morphology.
Surface anatomy changes in shape in the anterior and middle cranial fossae are particularly interesting in relation to injury. The middle cranial fossa surrounds the base of the temporal lobe with the sphenoid crest along the anterior border. This particular structural arrangement may cause vulnerability to the frontal and temporal regions of the brain (Bigler, 2007). The significant anterior cranial fossa changes were attributed to relative compression of the inner surface of the frontal bone for both sexes; however, the compression was more pronounced in females. The significant shape change of the inner frontal region for females may be attributed to a benign physiological condition known as hyperostosis frontalis interna (HFI), which causes a thickening of the skull frontal region. HFI patients are considered to be anatomically normal and are noted as unremarkable in radiology reports (May et al. 2010, 2012; Raikos et al. 2011). Upon visual inspection of the scans analyzed, 11% of the subjects had changes compatible with HFI, in parallel with estimations of the incidence of HFI in the population (She & Szakacs, 2004). Therefore, these scans were not excluded. The middle cranial fossa displayed relative compression with age along the sphenoid crest posteriorly, including the medial base of the middle cranial fossa with a slight relative bilateral expansion along the lateral edges of the middle cranial fossa. The combined relative compression of the inner frontal region with the medial compression and lateral expansion of the middle cranial fossa may play a role in the biomechanical response of the brain to head impact and subsequent injury location. Investigation into the biomechanical role of the cranial fossae during impact is needed to fully understand this phenomenon. There were no significant changes in posterior cranial fossa shape for either sex. However, predictive model results reveal a relationship between age and shape in the posterior cranial fossa.
There are limitations inherent to scan collection for a population‐based study. Random sampling of normal adult head CT scans may introduce a range of subject variability in head size and bone quality, especially in the elderly. However, the regressions represent average predictive models for each age and sex from the data. Additionally, the inclusion of approximately one scan per year of age may be a limitation of the represented population. Larger population‐based studies may provide more robust representations of each age and sex. There may be slight inter‐ and/or intra‐observer variation in the cutting planes that may affect the image registration; however, the error as a result of this is minimal due to the selection of the cutting plane from anatomic landmarks. Lastly, the accuracy of the landmark mapping is limited by the scan resolution.
Concluding remarks
A methodology was presented to identify homologous skull landmarks from 122 subject head CT scans. A 3D geometric morphometric analysis of the adult cranial vault and cranial base was performed to assess shape variation in specific anatomic regions of the skull with age. Results demonstrate significant adult skull shape changes with increasing age. Shape changes were mostly notable within the inner cranial vault and the anterior and middle cranial fossae. Males revealed the most significant shape changes with age, particularly in the outer cranial vault, inner cranial vault, anterior cranial fossa, and middle cranial fossa. Females revealed significant shape changes with age within the anterior cranial fossa and middle cranial fossa. The methods and data may be extended to pediatrics to assess developmental changes in the skull. The shape functions may also be used in forensics to predict skull age from postmortem CT data. These data will be used in conjunction with brain shape and size definitions to morph finite element models to represent different ages. Ultimately, the data presented will be used to better understand how skull morphology influences the biomechanics of TBI.
Author contributions
Jillian Urban: concept/design, acquisition of data, data analysis/interpretation, drafting of the manuscript. Ashley Weaver: concept/design, data analysis/interpretation, critical revision of the manuscript, approval of the article. Elizabeth Lillie: acquisition of data. Joseph Maldjian: data analysis, critical review of the manuscript, approval of the article. Christopher Whitlow: data interpretation, critical review of the manuscript, approval of the article. Joel Stitzel: concept/design, data interpretation, critical review of the manuscript, approval of the article.
Conflict of interest
No competing financial interests exist.
Acknowledgements
Funding was provided by the National Highway Traffic Safety Administration under Cooperative Agreement Number DTN22‐09‐H‐00242. Views expressed are those of the authors and do not represent the views of NHTSA. The authors would like to thank Callistus Nguyen for assistance with image segmentation, as well as Jaclyn Caccese and Mimin Meliyani for assistance in data collection.
References
- Avants B, Gee JC (2004) Geodesic estimation for large deformation anatomical shape averaging and interpolation. Neuroimage 23(Suppl 1), S139–S150. [DOI] [PubMed] [Google Scholar]
- Avants BB, Epstein CL, Grossman M, et al. (2008) Symmetric diffeomorphic image registration with cross‐correlation: evaluating automated labeling of elderly and neurodegenerative brain. Med Image Anal 12, 26–41. [DOI] [PMC free article] [PubMed] [Google Scholar]
- Axelsson S, Kjaer I, Bjornland T, et al. (2003) Longitudinal cephalometric standards for the neurocranium in Norwegians from 6 to 21 years of age. Eur J Orthod 25, 185–198. [DOI] [PubMed] [Google Scholar]
- Bigler ED (2007) Anterior and middle cranial fossa in traumatic brain injury: relevant neuroanatomy and neuropathology in the study of neuropsychological outcome. Neuropsychology 21, 515–531. [DOI] [PubMed] [Google Scholar]
- Chen SY, Lestrel PE, Kerr WJ, et al. (2000) Describing shape changes in the human mandible using elliptical Fourier functions. Eur J Orthod 22, 205–216. [DOI] [PubMed] [Google Scholar]
- Coronado VG, Thomas KE, Sattin RW, et al. (2005) The CDC traumatic brain injury surveillance system: characteristics of persons aged 65 years and older hospitalized with a TBI. J Head Trauma Rehabil 20, 215–228. [DOI] [PubMed] [Google Scholar]
- Crockett JC, Rogers MJ, Coxon FP, et al. (2011) Bone remodelling at a glance. J Cell Sci 124, 991–998. [DOI] [PubMed] [Google Scholar]
- Danelson KA, Geer CP, Stitzel JD, et al. (2008) Age and gender based biomechanical shape and size analysis of the pediatric brain. Stapp Car Crash J 52, 59–81. [DOI] [PubMed] [Google Scholar]
- De Groote I (2011) Femoral curvature in Neanderthals and modern humans: a 3D geometric morphometric analysis. J Hum Evol 60, 540–548. [DOI] [PubMed] [Google Scholar]
- Fakhry N, Puymerail L, Michel J, et al. (2013) Analysis of hyoid bone using 3D geometric morphometrics: an anatomical study and discussion of potential clinical implications. Dysphagia 28, 435–445. [DOI] [PubMed] [Google Scholar]
- Fedorov A, Beichel R, Kalpathy‐Cramer J, et al. (2012) 3D Slicer as an image computing platform for the Quantitative Imaging Network. Magn Reson Imaging 30, 1323–1341. [DOI] [PMC free article] [PubMed] [Google Scholar]
- Fowles D, Greenburg S (2010) A Profile of Older Americans: 2010. (ed. Administration on Aging, AoA). Washington, DC: USDoHaHS. [Google Scholar]
- Frost HM (1996) Dynamics of bone remodelling In: Bone Dynamics (ed. Frost HM.), pp. 315–333. Boston: Little Brown. [Google Scholar]
- Gayzik FS, Yu MM, Danelson KA, et al. (2008) Quantification of age‐related shape change of the human rib cage through geometric morphometrics. J Biomech 41, 1545–1554. [DOI] [PubMed] [Google Scholar]
- Gayzik FS, Moreno DP, Geer CP, et al. (2011) Development of a full body CAD dataset for computational modeling: a multi‐modality approach. Ann Biomed Eng 39, 2568–2583. [DOI] [PubMed] [Google Scholar]
- Good PI (2000) Permutation Tests: A Practical Guide to Resampling Methods for Testing Hypotheses, Vol. 2 Springer Series in Statistics. New York, NY: Springer. [Google Scholar]
- Gunz P, Mitteroecker P, Bookstein FL (2005) Modern Morphometerics in Physical Anthropology. New York: Plenum Publishers. [Google Scholar]
- Hadjidakis DJ, Androulakis II (2006) Bone remodeling. Ann N Y Acad Sci 1092, 385–396. [DOI] [PubMed] [Google Scholar]
- Harvati K (2003) Quantitative analysis of Neanderthal temporal bone morphology using three‐dimensional geometric morphometrics. Am J Phys Anthropol 120, 323–338. [DOI] [PubMed] [Google Scholar]
- Kanodia G, Parihar V, Yadav YR, et al. (2012) Morphometric analysis of posterior fossa and foramen magnum. J Neurosci Rural Pract 3, 261–266. [DOI] [PMC free article] [PubMed] [Google Scholar]
- Marcus JR, Domeshek LF, Das R, et al. (2008) Objective three‐dimensional analysis of cranial morphology. Eplasty 8, e20. [PMC free article] [PubMed] [Google Scholar]
- May H, Peled N, Dar G, et al. (2010) Identifying and classifying hyperostosis frontalis interna via computerized tomography. Anat Rec (Hoboken) 293, 2007–2011. [DOI] [PubMed] [Google Scholar]
- May H, Mali Y, Dar G, et al. (2012) Intracranial volume, cranial thickness, and hyperostosis frontalis interna in the elderly. Am J Hum Biol 24, 812–819. [DOI] [PubMed] [Google Scholar]
- McIntyre GT, Mossey PA (2003) Size and shape measurement in contemporary cephalometrics. Eur J Orthod 25, 231–242. [DOI] [PubMed] [Google Scholar]
- Neubauer S, Gunz P, Hublin JJ (2009) The pattern of endocranial ontogenetic shape changes in humans. J Anat 215, 240–255. [DOI] [PMC free article] [PubMed] [Google Scholar]
- Oddie TH, Meade JH Jr, Fisher DA (1966) An analysis of published data on thyroxine turnover in human subjects. J Clin Endocrinol Metab 26, 425–436. [DOI] [PubMed] [Google Scholar]
- Pirouzmand F, Muhajarine N (2008) Definition of topographic organization of skull profile in normal population and its implications on the role of sutures in skull morphology. J Craniofac Surg 19, 27–36. [DOI] [PubMed] [Google Scholar]
- Raikos A, Paraskevas GK, Yusuf F, et al. (2011) Etiopathogenesis of hyperostosis frontalis interna: a mystery still. Ann Anat 193, 453–458. [DOI] [PubMed] [Google Scholar]
- Royle NA, Hernandez MC, Maniega SM, et al. (2013) Influence of thickening of the inner skull table on intracranial volume measurement in older people. Magn Reson Imaging 31, 918–922. [DOI] [PMC free article] [PubMed] [Google Scholar]
- She R, Szakacs J (2004) Hyperostosis frontalis interna: case report and review of literature. Ann Clin Lab Sci 34, 206–208. [PubMed] [Google Scholar]
- Slice DE (2005) Modern morphometrics in physical anthropology In: Modern Morphometrics (ed. Slice D.), pp. 1–45. New York: Plenum Publishers. [Google Scholar]
- Slice DE, Stitzel JD (2004) Landmark‐based geometric morphometrics and the study of allometry. SAE Technical Paper, No. 2004‐01‐2181. [Google Scholar]
- Sowell ER, Peterson BS, Thompson PM, et al. (2003) Mapping cortical change across the human life span. Nat Neurosci 6, 309–315. [DOI] [PubMed] [Google Scholar]
- Weaver AA, Schoell SL, Nguyen CM, Lynch SK, Stitzel JD. (2014) Morphometric analysis of variation in the sternum with sex and age. J Morphol, doi: 10.1002/jmor.20302. [DOI] [PubMed] [Google Scholar]
- Weaver AA, Schoell SL, Stitzel JD (2014b) Morphometric analysis of variation in the ribs with age and sex. J Anat 225, 246–261. [DOI] [PMC free article] [PubMed] [Google Scholar]


