Abstract
Chromatin regulators play a major role in establishing and maintaining gene expression states. Yet how they control gene expression in single cells, quantitatively and over time, remains unclear. We used time-lapse microscopy to analyze the dynamic effects of four silencers associated with diverse modifications: DNA methylation, histone deacetylation, and histone methylation. For all regulators, silencing and reactivation occurred in all-or-none events, enabling the regulators to modulate the fraction of cells silenced rather than the amount of gene expression. These dynamics could be described by a three-state model involving stochastic transitions between active, reversibly silent, and irreversibly silent states. Through their individual transition rates, these regulators operate over different time scales and generate distinct types of epigenetic memory. Our results provide a framework for understanding and engineering mammalian chromatin regulation and epigenetic memory.
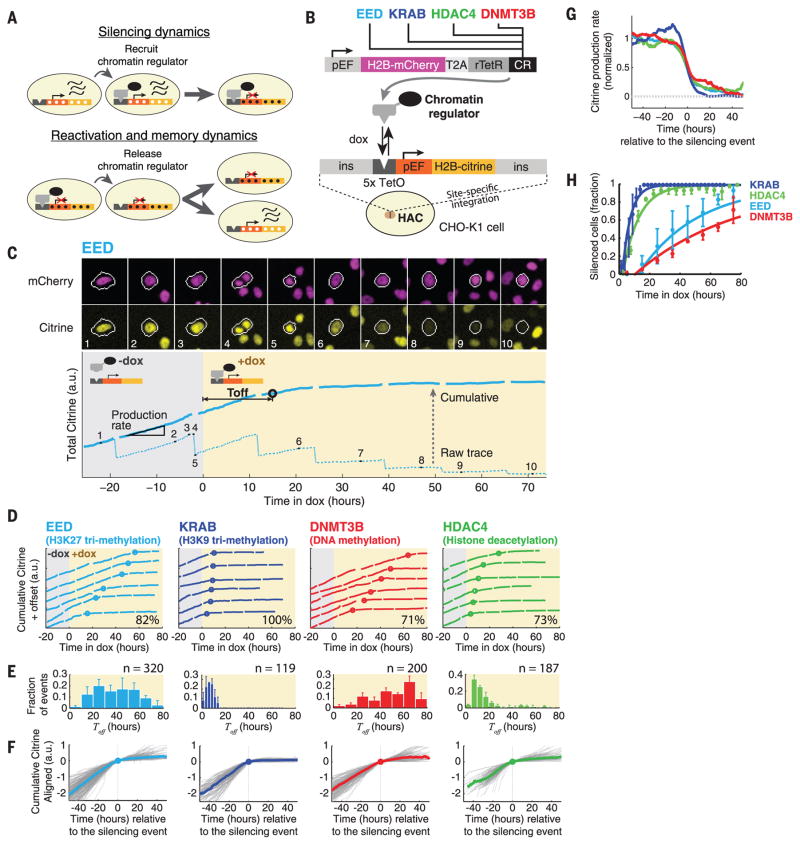
Cells use a system of chromatin regulators (CRs) and associated histone and DNA modifications to modulate gene expression and establish long-term epigenetic memory (1–4). This system is critical in development (5), aging (6), and disease (7) and could provide essential capabilities for synthetic biology (8). In all of these contexts, the temporal dynamics and cell-to-cell variability of gene expression are critical but have been difficult to study, as current methods usually provide static correlations between chromatin modifications and gene expression or aggregate data across potentially heterogeneous cell populations. Therefore, it has remained unclear how strongly, rapidly, and uniformly each regulator can alter gene expression, and how long these effects persist (Fig. 1A).
Fig. 1. Time-lapse analysis reveals that silencing occurs through stochastic all-or-none events in individual cells.
(A) Direct recruitment of a CR (black oval) to a reporter gene enables analysis of subsequent silencing dynamics (upper panel). After silencing, releasing the CR allows analysis of epigenetic memory and reactivation dynamics (lower panel). White and black dots represent changes in chromatin modifications. Wavy lines represent transcribed mRNA. (B) Construct for constitutive coexpression of H2B-mCherry and one of four CRs fused with the DNA binding protein rTetR (top). Engineered cells also contained a target H2B-citrine reporter gene driven by the mammalian elongation factor 1a promoter (pEF) (35) with five upstream rTetR binding sites (5x TetO). The reporter is flanked by insulators (ins) and is site-specifically integrated on a HAC in CHO-K1 cells (bottom). H2B domains localize fluorescent protein signals to the nucleus, improving quantitation. (C) (Top) Typical filmstrip of silencing dynamics (from movie S1). (Bottom) Total citrine fluorescence (a.u., arbitrary units) is plotted (dotted line) for the cell lineage circled in white, before (gray shading) and during (yellow shading) recruitment. A cumulative fluorescence trace (solid blue) was obtained by computationally restoring the fluorescence signal lost to the sister cell at each division. This procedure facilitates continuous quantification of the reporter production rate (slope of cumulative trace) and identification of silencing events (black circle) (see materials and methods). Numbers correspond to frames in the filmstrip above. (D) Representative single-cell traces showing silencing events (circles) induced by recruitment of the indicated CR. Only cells silenced during the corresponding movie (see movies S1 to S4) are shown. For clarity, traces are offset by arbitrary amounts on the y axis. The percentage of traces that resemble those shown here is indicated on each plot (see fig. S4 for other behaviors). (E) Distributions of silencing times, Toff (mean ± SD). n indicates the number of events for each histogram. (F) Single-cell cumulative fluorescence traces (gray lines) were aligned at the silencing event (0 on the x axis) and superimposed. The median of all traces is plotted as a colored line. (G) Median reporter production rates, obtained from all slopes of the individual traces in (F), showing the all-or-none nature of silencing events. (H) Fraction of cells silenced as a function of time (dots, mean ± SD). Curves represent exponential fits to a single silencing rate with a time delay for each CR (materials and methods).
To answer these questions, we combined targeted CR recruitment (9–12) with time-lapse microscopy (13) to develop a system to quantitatively track the effects of CRs on a reporter gene in individual cells. More specifically, we fused individual CRs to the reverse Tet repressor (rTetR) (14), which binds to DNA only in the presence of doxycycline (dox), allowing us to control the timing and duration of CR recruitment upstream of a fluorescent reporter gene expressing histone 2B (H2B)–citrine (Fig. 1B). To isolate the system from other genes, the reporter was flanked by insulators (15) and integrated on a human artificial chromosome (HAC) (16). All constructs were stably integrated in Chinese hamster ovary (CHO)–K1 cells, a major model system for synthetic mammalian biology (see supplementary materials and methods). Each cell line constitutively coexpressed H2B-mCherry, thus allowing cell tracking even when the reporter was silenced (Fig. 1, B and C). Control experiments indicated that recruitment of rTetR alone does not repress reporter expression (fig. S1) and that changes in gene regulation could be detected over time scales as short as 6 hours (fig. S2). Therefore, this system enables analysis of the effects of recruitment and release of each CR on gene expression in individual cells.
To compare the capabilities of distinct regulators, we selected four repressive CRs that span a broad range of chromatin modifications: embryonic ectoderm development (EED), Krüppel associated box (KRAB), DNA methyltransferase 3B (DNMT3B), and histone deacetylase 4 (HDAC4). EED functions as part of the Polycomb repressive complex 2 (PRC2), which methylates histone H3 at lysine 27 (H3K27me3) (17). KRAB functions within >400 zinc finger transcription factors (18), associates with other CRs that write or read H3K9me3 (19), and is often used in genetic engineering (10, 20). DNMT3B causes de novo methylation of cytosine-guanine dinucleotides (CpGs) (21). HDAC4 removes acetyl groups from histones H3 and H4 (22). All of these CRs have been shown to silence gene expression during development, and their molecular mechanisms have been dissected in diverse studies (19, 23–25). However, their dynamic operational behaviors have not been analyzed in single cells and compared side-by-side at the same target gene.
To analyze how recruitment of each CR alters gene expression, we used time-lapse microscopy to follow silencing in individual cells after the addition of dox (Fig. 1C, movies S1 to S8, and materials and methods). Recruitment of each CR strongly and specifically silenced H2B-citrine expression (Fig. 1D and fig. S3, B and C). Silencing occurred in an all-or-none fashion in individual cells for all four CRs (Fig. 1D) at varying times after recruitment (Fig. 1E). During the silencing event, median production rates dropped below 20% of their presilencing value within ~20 hours, or about one cell cycle (Fig. 1, F and G; see also fig. S4 for deviations from this behavior). This all-or-none response is similar to that observed upon recruitment of heterochromatin protein 1 (HP1) (9) and is consistent with previous reports of chromatin-related gene silencing (26, 27).
In contrast to the overall similarity in silencing event profiles, the timing of the silencing events we observed varied widely between cells, and the rate of silencing depended strongly on the CR used (Fig. 1, E and H). Silencing by KRAB and HDAC4 was rapid, with all cells silenced within one cell cycle (~20 hours), whereas EED and DNMT3B exhibited slower rates of silencing, with 50% of cells silenced at 35 and 62 hours, respectively. For these CRs, the broad cell-to-cell variability in Toff (defined as the delay between dox addition and silencing) (Fig. 1E) and the lack of a strong correlation of silencing behavior between sister cells (fig. S5) indicate that chromatin silencing is a stochastic process. In fact, after a relatively short time lag, the fraction of silenced cells as a function of time is well described by a single-rate process for each CR (solid lines in Fig. 1H). Together, these results strongly suggest that silencing occurs through stochastic all-or-none events at distinct rates for each CR.
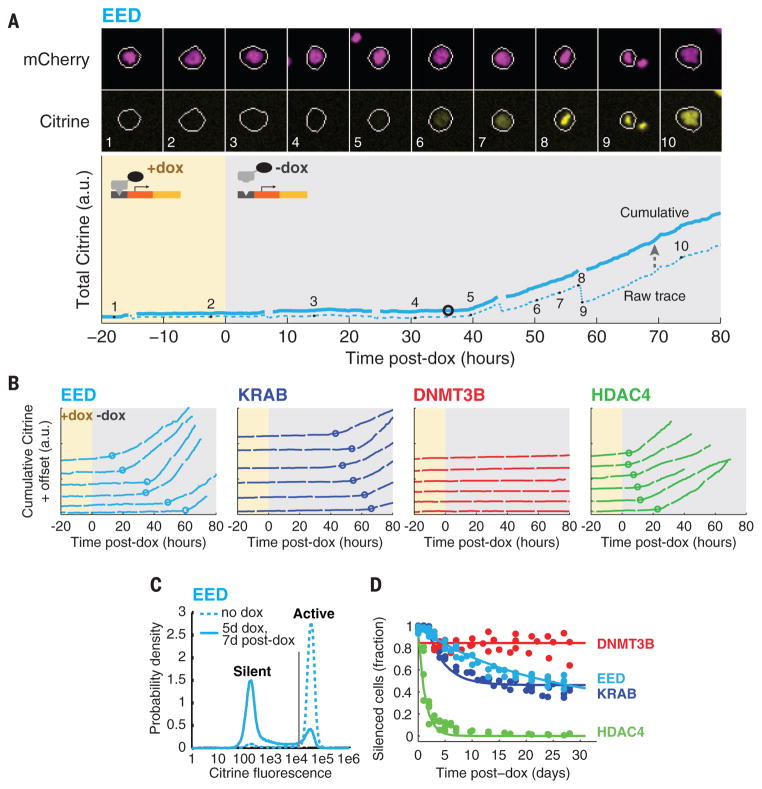
We next asked how the CRs differed in terms of reactivation dynamics and epigenetic memory. After 5 days of recruitment, we washed out dox to release the CRs and tracked the resulting changes in gene expression using time-lapse movies (Fig. 2A, fig. S6, and movies S9 to S16). For EED, KRAB, and HDAC4, reactivation occurred in stochastic all-or-none events, resembling silencing events in reverse (Fig. 2B). In contrast, we observed no reactivation events in cells silenced by DNMT3B recruitment, up to 80 hours after dox removal, after which cell density became too high for tracking.
Fig. 2. Chromatin regulators produce distinct time scales of memory.
(A) (Top) Filmstrip and (bottom) corresponding fluorescence trace before and after EED release (from movie S9). Traces, numbers, and shading are similar to those in Fig. 1C. (B) Representative single-cell traces showing reactivation events for EED, KRAB, and HDAC4 (circles; only reactivated cells are shown). No reactivation events were observed for DNMT3B, so only silent cells are plotted. Traces are vertically offset for clarity. (C) Flow cytometry enables classification of cells as silent (low-fluorescence peak) or active (high-fluorescence peak), using a threshold (gray line). (D) Fraction of silenced cells measured by flow cytometry at various time points after CR release. Each dot represents one flow cytometry measurement. Data from three independent experiments are shown. Spontaneous background silencing rates have been subtracted (fig. S7D and materials and methods). Solid lines are fits to the model in Fig. 3A.
To extend these measurements to longer durations, we switched to flow cytometry analysis. As expected for all-or-none reactivation, distributions of total fluorescence were bimodal (Fig. 2C and fig. S7, A to C), allowing us to quantitatively track the fraction of silent cells as a function of time (Fig. 2D and fig. S7D). The CRs produced qualitatively different modes of epigenetic memory (Fig. 2D), associated with distinct sets of chromatin modifications, as measured by DNA and chromatin immunoprecipitation and quantitative polymerase chain reaction (fig. S8). HDAC4 imparted short-term memory: Upon its release, silencing was lost in all cells within 5 days, consistent with rapid dynamics of histone acetylation and deacetylation (28). In contrast, DNMT3B produced long-term memory: Cells were stably silenced for the duration of the experiment (30 days), in agreement with reports that DNA methylation is stably inherited (4). Finally, both EED and KRAB enabled a distinct type of hybrid memory that is not associated with DNA methylation (fig. S8B). For these CRs, a fraction of cells fully reactivated within 2 to 3 weeks, whereas the remaining fraction remained completely silenced for at least a month.
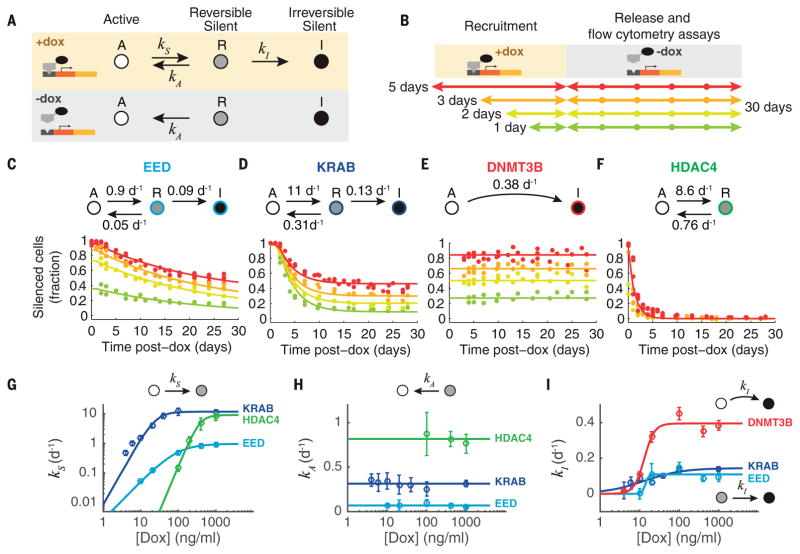
The hybrid memory could be explained by a three-state model (Fig. 3A) in which recruitment of a silencing CR causes cells to stochastically advance from an actively expressing state (A) to a reversibly silent state (R) and then to an irreversibly silent state (I). We assume that after the end of recruitment, the forward silencing rates become negligible, allowing cells in the R state to revert to the A state, reactivating gene expression, whereas cells in the I state remain silenced.
Fig. 3. A three-state model explains gene expression dynamics across different recruitment durations and strengths.
(A) Proposed model based on stochastic transitions between actively expressing (A), reversibly silent (R), and irreversibly silent (I) states. Silencing (at rates kS and kI) depends on recruitment, whereas reactivation (at rate kA) is independent of recruitment. (B) Experimental strategy: The duration of recruitment was varied from 1 to 5 days (colored arrows). After removal of dox, the fraction of cells remaining silenced was measured for up to 30 days. (C to F) Flow cytometry measurements show the fraction of silent cells over time after CR release. Colors indicate recruitment duration, as in (B). Data from two or more independent experiments are shown. Each set of solid lines represents a single fit of all data for that factor to the model, with rate constants indicated above each panel (see materials and methods for details of fitting). (G to I) Silencing and reactivation dynamics are measured at different dox concentrations. For each concentration, these data are fit with the corresponding model for each CR to extract the kinetic rates indicated in the diagram (dots, see materials and methods). Error bars represent the 95% confidence interval of the fit. Curves [(G) and (I)] are fits to a Michaelis-Menten–like equation. Lines in (H) are fits to a constant value.
This three-state model predicts that longer durations of recruitment should increase the fraction of irreversibly silenced cells. To test this prediction, we systematically varied the duration of recruitment and analyzed the subsequent reactivation dynamics (Fig. 3B). For both EED and KRAB, the fraction of cells remaining silent 30 days after CR release increased with the duration of the initial recruitment, as predicted (Fig. 3, C and D). Similar increases in the stability of silencing with recruitment duration were also reported for HP1 (9). Aside from a relatively small time lag before the onset of reactivation (1 to 2 days), all data for a given CR could be fit to the three-state model with a single set of rate constants across the entire range of recruitment durations (solid lines in Fig. 3, C and D; see also materials and methods). Moreover, simplified forms of this model can also explain the behavior of HDAC4 and DNMT3B, each requiring only two of the three states (Fig. 3, E and F).
A key parameter in these experiments is the recruitment strength of the CR, which is controlled by the dox concentration. To understand how recruitment strength affects silencing and reactivation capabilities, we analyzed the effects of 5 days of CR recruitment for a range of dox concentrations. Qualitatively, each CR produced the same number and type of states across dox concentrations (compare Fig. 3, C to F, to fig. S9, B to E). Quantitatively, recruitment strength modulated the silencing rates, but not the reactivation rates, which depended only on the identity of the silencing CR (Fig. 3, G to I). Together, these data provide a comprehensive view of how the dynamic effects of each CR on gene expression depend on recruitment duration and strength.
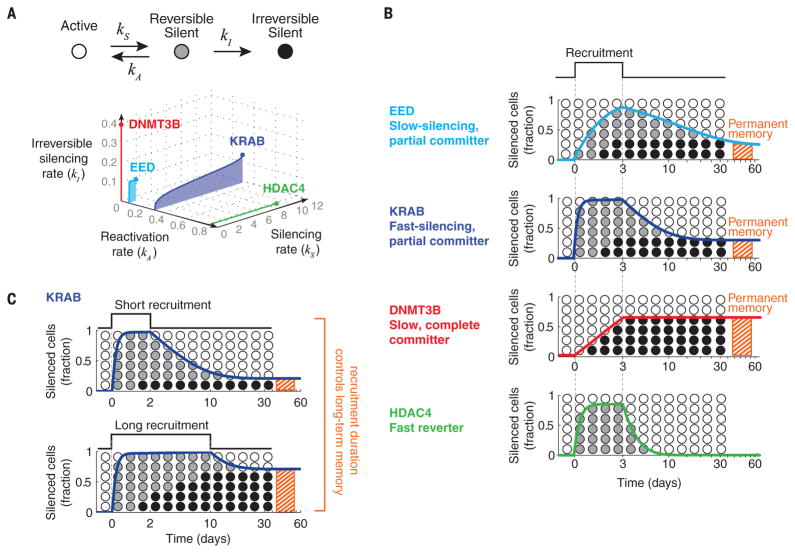
The three-state model (Fig. 3A) provides a unifying framework for comparing the operational capabilities of different CRs. More specifically, each CR traces a distinct curve within the parameter space defined by the three rate constants of the model over a range of recruitment strengths (Fig. 4A). Going forward, it will be critical to determine how these operational parameters depend on promoter architecture, the chromatin state of the locus, and the specific set of chromatin regulatory components expressed in different cell types. Moreover, it will be important to determine how the phenomenological states and transitions associated with each CR emerge from underlying molecular states and biochemical processes. Although the stochastic nature of silencing is consistent with simple models of spreading of chromatin modifications (9) (supplementary text and fig. S10), other processes—such as chromatin compaction and translocation to the nuclear lamina—may be involved.
Fig. 4. Chromatin regulators generate diverse modes of duration-dependent fractional silencing and memory.
(A) The four CRs can be represented in a three-dimensional parameter space defined by the rate constants in the model (axis labels) over a range of recruitment strengths. The curve occupied by each CR in this space encapsulates its dynamic effects on gene expression and epigenetic memory. The colored dot at the end of each curve represents rate constants at full recruitment strength (saturating dox concentration). (B) For each regulator, the response to a pulse of recruitment is computed and plotted using the rate constants at full recruitment strength. The total fraction of silent cells in states R and I is indicated by the solid color line; the fractions of cells in each of these states are approximately indicated by the fraction of black and gray circles. Time is indicated on the x axis (log scale). The final fraction of cells in the I state is indicated by the red hatched bar. (C) Different durations of recruitment (upper and lower panels) can similarly produce full silencing on shorter time scales but can generate different amounts of permanent memory (red hatched bars).
Despite their differences, the CRs analyzed here were all capable of regulating gene expression through duration-dependent fractional control. In this mode, the duration of CR recruitment controls the fraction of cells in which the target gene is silenced in all-or-none fashion. This is possible when the lifetime of the reversible silenced state is long compared with the lifetimes of mRNA and protein (supplementary text and fig. S11). Duration-dependent fractional control can be contrasted with other transcriptional regulation systems, in which more rapid dynamics enables the occupancy of a transcription factor at the promoter to control protein expression levels in a graded manner (29–31). Because of their different parameters, each CR generates a distinct control mode (Fig. 4B): DNMT3B faithfully records the duration or strength of recruitment. HDAC4 enables fast and reversible fractional control at maximum recruitment strengths but can also lead to graded changes in protein levels at lower ones (fig. S11). EED and KRAB, due to their hybrid memory, enable regulation across multiple time scales. For example, with these CRs, pulses of recruitment of different durations that both silence the entire population in the short term can establish different degrees of permanent memory in the longer term (Fig. 4C), similarly to the classical example of PRC2-mediated silencing of the flowering locus during vernalization (32). These types of fractional control strategies could be used to integrate signals for cellular decision-making (33, 34).
It is now possible to use the framework developed here to classify the operational capabilities of other CRs, as well as to determine how their behaviors depend on biological context and how they interact combinatorially to provide additional capabilities. More generally, this approach should help us to understand why specific CRs are employed in particular natural genetic circuits and to enable the design of synthetic gene circuits that take advantage of the inherent temporal control and memory capabilities of chromatin-mediated regulation.
Supplementary Material
Acknowledgments
We thank G. M. Abadi, J. Cao, L. Santat, and the Caltech Flow Cytometry Facility for technical assistance and U. Alon, L. Cai, J. Garcia-Ojalvo, A. I. Geraschenko, M. Guttman, B. A. Hay, R. Kishony, A. Moses, R. Phillips, K. Plath, E. Rothenberg, M.-H. Sung, and members of the Elowitz lab for discussions and feedback. This work was supported by the NIH (grants R01 HD075335A and R01 HD075605A to M.B.E.), the Defense Advanced Research Projects Agency (grant W911NF-11-2-0055 to M.B.E.), the Human Frontier Science Program (grant RGP0020/2012 to M.B.E. and Y.E.A.), the Jane Coffin Childs Memorial Fund for Medical Research (postdoctoral fellowship to L.B.), the Beckman Institute at California Institute of Technology (equipment grant to L.B.), the Burroughs Wellcome Fund (Career at the Scientific Interface Award to L.B.), the Gordon and Betty Moore Foundation (through grant GBMF2809 to the Caltech Programmable Molecular Technology Initiative), and HHMI (M.B.E.). M.B.E., L.B., J.Y., and California Institute of Technology filed a provisional patent application (CIT-7162-P) that relates to fractional control devices based on CRs.
Footnotes
REFERENCES AND NOTES
- 1.Kouzarides T. Cell. 2007;128:693–705. doi: 10.1016/j.cell.2007.02.005. [DOI] [PubMed] [Google Scholar]
- 2.Li E, Zhang Y. Cold Spring Harb Perspect Biol. 2014;6:a019133. doi: 10.1101/cshperspect.a019133. [DOI] [PMC free article] [PubMed] [Google Scholar]
- 3.Zhou VW, Goren A, Bernstein BE. Nat Rev Genet. 2011;12:7–18. doi: 10.1038/nrg2905. [DOI] [PubMed] [Google Scholar]
- 4.Bird A. Genes Dev. 2002;16:6–21. doi: 10.1101/gad.947102. [DOI] [PubMed] [Google Scholar]
- 5.Zhu J, et al. Cell. 2013;152:642–654. doi: 10.1016/j.cell.2012.12.033. [DOI] [PMC free article] [PubMed] [Google Scholar]
- 6.Fraga MF, Esteller M. Trends Genet. 2007;23:413–418. doi: 10.1016/j.tig.2007.05.008. [DOI] [PubMed] [Google Scholar]
- 7.Egger G, Liang G, Aparicio A, Jones PA. Nature. 2004;429:457–463. doi: 10.1038/nature02625. [DOI] [PubMed] [Google Scholar]
- 8.Keung AJ, Joung JK, Khalil AS, Collins JJ. Nat Rev Genet. 2015;16:159–171. doi: 10.1038/nrg3900. [DOI] [PMC free article] [PubMed] [Google Scholar]
- 9.Hathaway NA, et al. Cell. 2012;149:1447–1460. doi: 10.1016/j.cell.2012.03.052. [DOI] [PMC free article] [PubMed] [Google Scholar]
- 10.Gilbert LA, et al. Cell. 2013;154:442–451. doi: 10.1016/j.cell.2013.06.044. [DOI] [PMC free article] [PubMed] [Google Scholar]
- 11.Keung AJ, Bashor CJ, Kiriakov S, Collins JJ, Khalil AS. Cell. 2014;158:110–120. doi: 10.1016/j.cell.2014.04.047. [DOI] [PMC free article] [PubMed] [Google Scholar]
- 12.Maeder ML, et al. Nat Biotechnol. 2013;31:1137–1142. doi: 10.1038/nbt.2726. [DOI] [PMC free article] [PubMed] [Google Scholar]
- 13.Locke JCW, Elowitz MB. Nat Rev Microbiol. 2009;7:383–392. doi: 10.1038/nrmicro2056. [DOI] [PMC free article] [PubMed] [Google Scholar]
- 14.Urlinger S, et al. Proc Natl Acad Sci USA. 2000;97:7963–7968. doi: 10.1073/pnas.130192197. [DOI] [PMC free article] [PubMed] [Google Scholar]
- 15.Yusufzai TM, Felsenfeld G. Proc Natl Acad Sci USA. 2004;101:8620–8624. doi: 10.1073/pnas.0402938101. [DOI] [PMC free article] [PubMed] [Google Scholar]
- 16.Yamaguchi S, et al. PLOS ONE. 2011;6:e17267. doi: 10.1371/journal.pone.0017267. [DOI] [PMC free article] [PubMed] [Google Scholar]
- 17.Margueron R, Reinberg D. Nature. 2011;469:343–349. doi: 10.1038/nature09784. [DOI] [PMC free article] [PubMed] [Google Scholar]
- 18.Urrutia R. Genome Biol. 2003;4:231. doi: 10.1186/gb-2003-4-10-231. [DOI] [PMC free article] [PubMed] [Google Scholar]
- 19.Ayyanathan K, et al. Genes Dev. 2003;17:1855–1869. doi: 10.1101/gad.1102803. [DOI] [PMC free article] [PubMed] [Google Scholar]
- 20.Fussenegger M, et al. Nat Biotechnol. 2000;18:1203–1208. doi: 10.1038/81208. [DOI] [PubMed] [Google Scholar]
- 21.Okano M, Bell DW, Haber DA, Li E. Cell. 1999;99:247–257. doi: 10.1016/s0092-8674(00)81656-6. [DOI] [PubMed] [Google Scholar]
- 22.Miska EA, et al. EMBO J. 1999;18:5099–5107. doi: 10.1093/emboj/18.18.5099. [DOI] [PMC free article] [PubMed] [Google Scholar]
- 23.Hansen KH, et al. Nat Cell Biol. 2008;10:1291–1300. doi: 10.1038/ncb1787. [DOI] [PubMed] [Google Scholar]
- 24.Blackledge NP, et al. Cell. 2014;157:1445–1459. doi: 10.1016/j.cell.2014.05.004. [DOI] [PMC free article] [PubMed] [Google Scholar]
- 25.Margolin JF, et al. Proc Natl Acad Sci USA. 1994;91:4509–4513. doi: 10.1073/pnas.91.10.4509. [DOI] [PMC free article] [PubMed] [Google Scholar]
- 26.Sutherland HGE, et al. Mamm Genome. 2000;11:347–355. doi: 10.1007/s003350010066. [DOI] [PubMed] [Google Scholar]
- 27.Pirrotta V, Gross DS. Mol Cell. 2005;18:395–398. doi: 10.1016/j.molcel.2005.04.013. [DOI] [PubMed] [Google Scholar]
- 28.Katan-Khaykovich Y, Struhl K. Genes Dev. 2002;16:743–752. doi: 10.1101/gad.967302. [DOI] [PMC free article] [PubMed] [Google Scholar]
- 29.Kringstein AM, Rossi FM, Hofmann A, Blau HM. Proc Natl Acad Sci USA. 1998;95:13670–13675. doi: 10.1073/pnas.95.23.13670. [DOI] [PMC free article] [PubMed] [Google Scholar]
- 30.Biggar SR, Crabtree GR. EMBO J. 2001;20:3167–3176. doi: 10.1093/emboj/20.12.3167. [DOI] [PMC free article] [PubMed] [Google Scholar]
- 31.Stewart-Ornstein J, Nelson C, DeRisi J, Weissman JS, El-Samad H. Curr Biol. 2013;23:2336–2345. doi: 10.1016/j.cub.2013.09.043. [DOI] [PMC free article] [PubMed] [Google Scholar]
- 32.Song J, Angel A, Howard M, Dean C. J Cell Sci. 2012;125:3723–3731. doi: 10.1242/jcs.084764. [DOI] [PubMed] [Google Scholar]
- 33.Busslinger M, Tarakhovsky A. Cold Spring Harb Perspect Biol. 2014;6:a019307. doi: 10.1101/cshperspect.a019307. [DOI] [PMC free article] [PubMed] [Google Scholar]
- 34.Tay S, et al. Nature. 2010;466:267–271. doi: 10.1038/nature09145. [DOI] [PMC free article] [PubMed] [Google Scholar]
- 35.Wakabayashi-Ito N, Nagata S. J Biol Chem. 1994;269:29831–29837. [PubMed] [Google Scholar]
Associated Data
This section collects any data citations, data availability statements, or supplementary materials included in this article.


