
Figure 4.
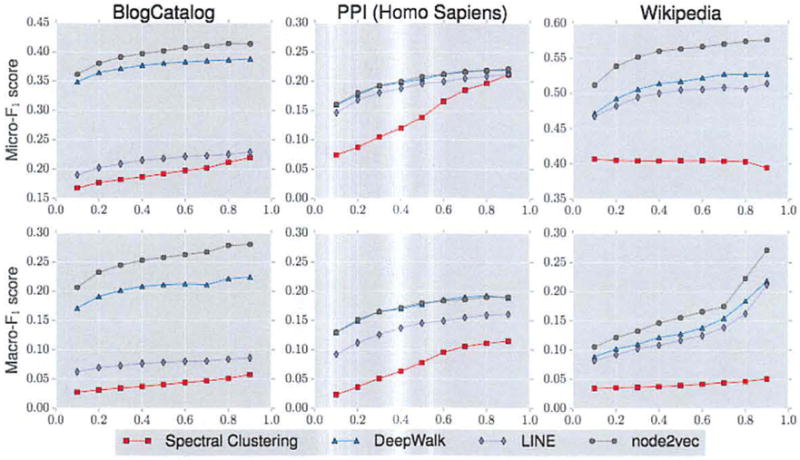
Performance evaluation of different benchmarks on varying the amount of labeled data used for training. The x axis denotes the fraction of labeled data, whereas the y axis in the top and bottom rows denote the Micro-F1 and Macro-F1 scores respectively. DeepWalk and node2vec give comparable performance on PPL In all other networks, across all fractions of labeled data node2vec performs best.