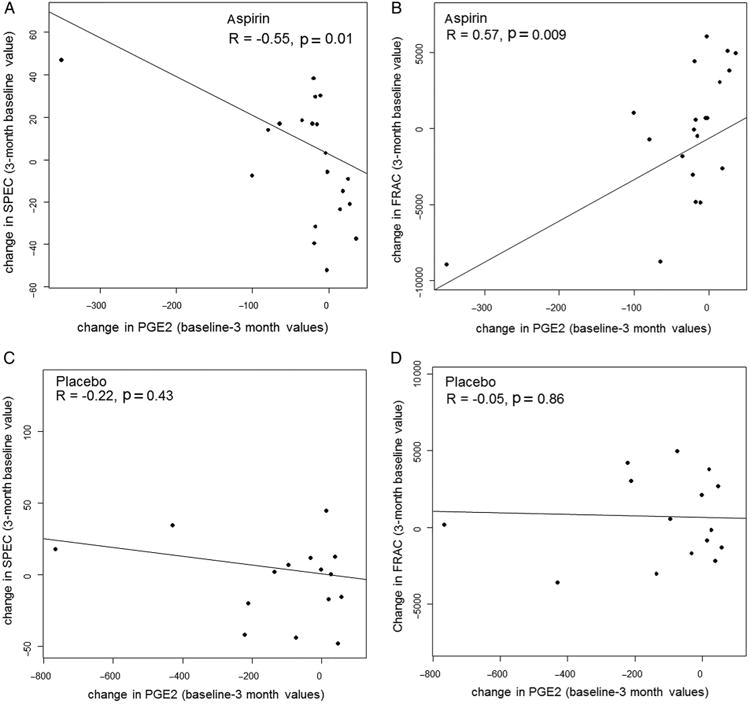
Figure 3.

Plots of changes in spectral markers versus changes in prostaglandin E2 (PGE2) expression in tissue are shown as scatter plots of changes in spectral slope (SPEC) (A and C) and fractal dimension (FRAC) (B and D) versus changes in PGE2 for individual patients treated with aspirin (A and B) or placebo (C and D).
