Abstract
Skeletal muscle insulin resistance is a major characteristic of obesity and type 2 diabetes. Although obesity-mediated inflammation is causally associated with insulin resistance, the underlying mechanism is unclear. Here, we examined the effects of chronic obesity in mice with muscle-specific overexpression of interleukin-10 (MIL10). After 16 weeks of a high-fat diet (HFD), MIL10 mice became markedly obese but showed improved insulin action compared to that of wild-type mice, which was largely due to increased glucose metabolism and reduced inflammation in skeletal muscle. Since leptin regulates inflammation, the beneficial effects of interleukin-10 (IL-10) were further examined in leptin-deficient ob/ob mice. Muscle-specific overexpression of IL-10 in ob/ob mice (MCK-IL10ob/ob) did not affect spontaneous obesity, but MCK-IL10ob/ob mice showed increased glucose turnover compared to that in ob/ob mice. Last, mice with muscle-specific ablation of IL-10 receptor (M-IL10R−/−) were generated to determine whether IL-10 signaling in skeletal muscle is involved in IL-10 effects on glucose metabolism. After an HFD, M-IL10R−/− mice developed insulin resistance with reduced glucose metabolism compared to that in wild-type mice. Overall, these results demonstrate IL-10 effects to attenuate obesity-mediated inflammation and improve insulin sensitivity in skeletal muscle, and our findings implicate a potential therapeutic role of anti-inflammatory cytokines in treating insulin resistance and type 2 diabetes.
INTRODUCTION
Obesity has emerged as a global issue in recent decades and is associated with numerous human diseases, including insulin resistance, type 2 diabetes, and cardiovascular diseases (1, 2). The underlying mechanism by which obesity induces numerous health problems remains poorly understood. In that regard, increasing evidence suggests an important role of a dysregulated immune system in obesity-mediated insulin resistance (3, 4). Obesity is characterized by altered levels of circulating cytokines, and adipose tissue macrophage accumulation and inflammation have been causally associated with insulin resistance (5, 6). However, recent studies have challenged this earlier notion on the causal role of adipose tissue macrophages and inflammation in the development of insulin resistance (7, 8).
While adipose tissue is widely viewed as the epicenter of obesity-mediated inflammation, it is not the only organ shown to develop macrophage infiltration and inflammation in obesity. In fact, recent studies indicate that obesity-mediated inflammation and macrophage accumulation develop in multiple organs, including skeletal muscle, liver, pancreas, heart, and brain (9–13). In that regard, our recent study found that exercise-mediated weight loss improved insulin action without affecting adipose tissue inflammation in mice with diet-induced obesity (7). Additionally, improved insulin action following weight loss was associated with reduced local inflammation in skeletal muscle, suggesting an important role of muscle inflammation in obesity-mediated insulin resistance (7). These findings clearly contest the adipocentric view of insulin resistance.
Interleukin-10 (IL-10) is a Th2-type cytokine that inhibits the synthesis and activity of proinflammatory cytokines and counteracts Toll-like receptor-mediated inflammation (14–16). We have previously shown that transgenic overexpression of IL-10 selectively in skeletal muscle improved glucose metabolism in mice after 3 weeks of a high-fat diet (HFD) (9). While our previous data suggest a potential therapeutic role of IL-10 in type 2 diabetes, our interpretation is limited due to the short-term feeding of an HFD not resulting in mice having developed type 2 diabetes phenotypes (i.e., hyperglycemia). Therefore, the current study was designed to specifically examine the role of IL-10 in markedly obese and diabetic mice after 16 weeks of an HFD (chronic HFD), a better representation of obese type 2 diabetic human subjects. Additionally, leptin is an important adipocyte-derived hormone that is elevated in obesity and regulates numerous physiological functions, including energy balance and inflammation (17). Thus, the present study also examined the effects of muscle-specific transgenic expression of IL-10 on glucose metabolism in leptin-deficient ob/ob mice. Last, we examined whether IL-10 signaling in skeletal muscle is directly responsible for IL-10 effects on muscle glucose metabolism using a newly generated mouse model lacking the IL-10 receptor 1 type chain selectively in skeletal muscle. Our findings indicate that selective targeting of IL-10 signaling in skeletal muscle improves glucose metabolism in obese and diabetic mice following a chronic HFD or with a deficiency in leptin and further demonstrate that these effects are mediated by direct activation of IL-10 signaling in skeletal muscle.
MATERIALS AND METHODS
Chronic HFD in MIL10 mice.
Male transgenic mice with muscle-specific overexpression of IL-10 (MIL10) and wild-type (WT) littermates were fed an HFD (55% fat by calories [Teklad TD93075; Harlan, Madison, WI]) or standard chow diet (Prolab Isopro RMH 3000 5P75; LabDiet, St. Louis, MO) ad libitum for 16 weeks (n = 6/group). During chronic high-fat feeding, we performed a weekly measurement of body composition to determine the changes in whole-body fat and lean masses.
Generation of MCK-IL10ob/ob mice.
We generated leptin-deficient mice with muscle-specific overexpression of IL-10 (MCK-IL10ob/ob) by cross-breeding MIL10 mice with ob/+ heterozygous mice (purchased from the Jackson Laboratory, Bar Harbor, ME). The F1 female MCK-IL10ob/+ mice were then intercrossed with male ob/+ mice to generate MCK-IL10ob/ob mice. The metabolic studies were conducted in MCK-IL10ob/ob mice that had been backcrossed for more than five generations (ob/ob, n = 7; MCK-IL10ob/ob, n = 12).
Generation of M-IL10R−/− mice.
Mice lacking IL-10 signaling in skeletal muscle (M-IL10R−/−) were generated by cross-breeding MCK-Cre-expressing mice (kindly donated by Roger J. Davis) and floxed IL10R1−/− mice (kindly donated by Werner Muller). The metabolic studies were conducted in M-IL10R−/− mice that had been backcrossed for several generations. M-IL10R−/− mice and MCK-Cre mice (referred to as WT) serving as controls were fed with an HFD or standard chow diet for 6 weeks (n = 6 to 11/group). All mice were housed under a controlled temperature (23°C) and light/dark cycle with free access to food and water. The animal studies were approved by the Institutional Animal Care and Use Committee of the University of Massachusetts Medical School.
Body composition and energy balance.
Whole-body fat and lean masses were noninvasively measured using proton magnetic resonance spectroscopy (1H-MRS) (Echo Medical Systems, Houston, TX). Indirect calorimetry and energy balance parameters, including food/water intake, energy expenditure, respiratory exchange ratio, and physical activity were noninvasively assessed for 3 days using metabolic cages (TSE-Systems, Inc., Bad Homburg, Germany). We used the TSE-Systems LabMaster platform with easy-to-use calorimetry featuring fully automated monitoring for food and water and activity in the x, y, and z planes. LabMaster cages that are most similar to facility home cages were used, thereby allowing the use of bedding in the cage and minimizing any animal anxiety during the experimental period. The system provides intuitive software with flexibility for experimental setup and data utilization.
Hyperinsulinemic-euglycemic clamp experiments.
Following a standard chow diet or an HFD, survival surgery was performed at 5 to 6 days before clamp experiments to establish an indwelling catheter in the jugular vein. On the day of the clamp experiment, mice were fasted overnight (∼17 h), and a 2-h hyperinsulinemic-euglycemic clamp was conducted in conscious mice with a primed and continuous infusion of human insulin (priming at 150 mU/kg body weight, followed by 2.5 mU/kg/min [Humulin; Eli Lilly, IN]) (18). To maintain euglycemia, 20% glucose was infused at variable rates during the clamps. Whole-body glucose turnover was assessed with a continuous infusion of [3-3H]glucose (PerkinElmer, Waltham, MA), and 2-deoxy-d-[1-14C]glucose (2-[14C]DG) (PerkinElmer, Waltham, MA) was administered as a bolus (10 μCi) at 75 min after the start of the clamps to measure insulin-stimulated glucose uptake in individual organs. At the end of the clamps, mice were anesthetized, and tissues were taken for biochemical analysis.
Biochemical analysis and calculation.
Glucose concentrations during the clamps were analyzed using 10 μl of plasma by a glucose oxidase method on an Analox GM9 Analyser (Analox Instruments, Ltd., London, United Kingdom). Plasma concentrations of [3-3H]glucose, 2-[14C]DG, and 3H2O were determined following deproteinization of plasma samples as previously described (18). For the determination of tissue 2-[14C]DG-6-phosphate (2-[14C]DG-6-P) content, tissue samples were homogenized, and the supernatants were subjected to an ion exchange column to separate 2-[14C]DG-6-P from 2-[14C]DG. Plasma insulin levels were measured using an enzyme-linked immunosorbent assay (ELISA) kit (Alpco Diagnostics, Salem, NH). Intramuscular triglyceride concentrations were determined by homogenizing muscle samples (quadriceps) in chloroform-methanol and using a triglyceride assay kit (Sigma, St. Louis, MO). Plasma nonesterified fatty acid (NEFA) levels were measured by an NEFA kit (Zenbio, Durham, NC), according to the manufacturer's protocol.
Rates of basal hepatic glucose production (HGP) and insulin-stimulated whole-body glucose turnover were determined as previously described (18). The insulin-stimulated rate of HGP was determined by subtracting the glucose infusion rate from whole-body glucose turnover. Whole-body glycolysis and glycogen plus lipid synthesis from glucose were calculated as previously described (18). Insulin-stimulated glucose uptake in individual tissues was assessed by determining the tissue (e.g., skeletal muscle) content of 2-[14C]DG-6-phosphate and the plasma 2-[14C]DG profile.
Molecular analysis for insulin signaling and inflammation.
Skeletal muscle (quadriceps) and liver samples were collected at the end of the clamp experiments to assess insulin signaling by immunoblotting with rabbit monoclonal antibodies against Akt and phospho-Akt-Ser473 (p-Akt-Ser473) (Cell Signaling, Danvers, MA). Muscle samples were homogenized, and plasma and homogenized muscle samples were used to measure the levels of interleukin-6 (IL-6), IL-10, gamma interferon (IFN-γ), and IL-1α using an enzyme-linked immunosorbent assay (ELISA) with a Luminex 200 Multiplex system (Millipore, Darmstadt, Germany). Plasma IL-10 levels were measured using an ELISA kit (Abcam, Cambridge, United Kingdom).
For quantitative real-time PCR (qRT-PCR), RNA isolation was performed with homogenized muscle (gastrocnemius and quadriceps), liver, and white adipose tissue samples using TRIzol (Life Sciences, Carlsbad, CA) according to the manufacturer's protocols. cDNA was synthesized from 2 μg of total RNA by use of an Omniscript cDNA synthesis kit (Qiagen, Venlo, Netherlands). cDNA and Sybr Green supermix (Bio-Rad, Hercules, CA) were run in a Bio-Rad-CFX96 real-time system with the primers listed in Table S1 in the supplemental material. Relative gene expression was calculated in comparison to the level of the housekeeping gene.
Histologic analysis.
Skeletal muscle samples (gastrocnemius) were collected, fixed in 10% neutral formalin for 48 h, and embedded in paraffin blocks. Sections (5 μm) were taken and stained with hematoxylin-eosin. Images were taken under a magnification of ×20.
Statistical analysis.
Data are expressed as means ± standard errors (SE). The significance of difference in mean values was determined using two-way analysis of variance (ANOVA) with Newman-Keuls and Games-Howell tests for post hoc analysis and Student's t test where applicable. The statistical significance was set at a P value of <0.05.
RESULTS
Chronic feeding of an HFD in MIL10 mice.
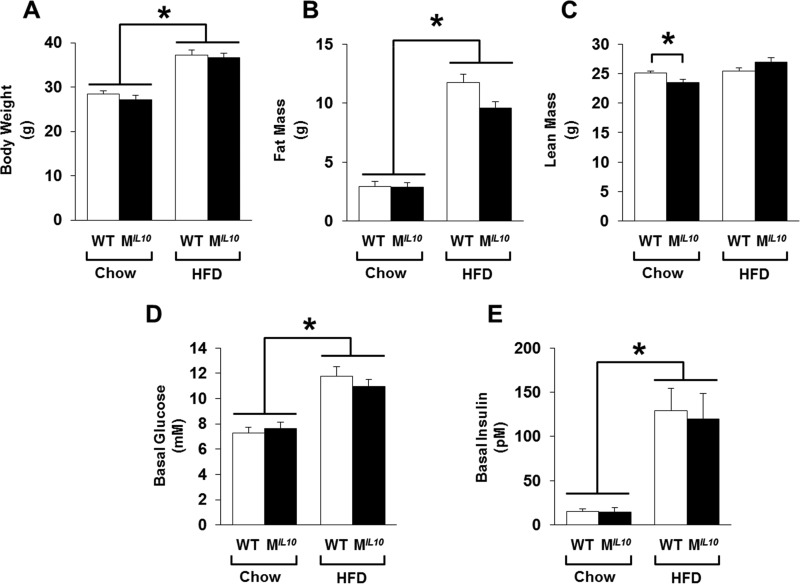
Starting at 6 to 7 weeks of age, male MIL10 and WT mice were fed with a standard chow diet or an HFD ad libitum for 16 weeks. At the end of the feeding period, all mice were age matched for metabolic studies. MIL10 and WT mice showed similar body weights on the standard chow diet, and after 16 weeks of an HFD, both groups of mice became obese with comparable increases in body weights (Fig. 1A). Consistent with this, whole-body fat mass, measured using 1H-MRS, was not different between standard-chow-fed MIL10 and WT mice, and fat mass increased by 3- to 4-fold after an HFD in both groups of mice (Fig. 1B). Although whole-body lean mass was statistically different between the groups on the standard chow diet (25.1 ± 0.3 g in WT mice versus 23.5 ± 0.6 g in MIL10 mice; P = 0.03), this difference of 1.5 g of lean mass is within the range of variability for the lean mass of C57BL/6 mice. Whole-body lean mass measurements after an HFD did not differ between groups (Fig. 1C). Metabolic cage analysis showed no significant difference in values for daily food intake, VO2 consumption, and physical activity between MIL10 and WT mice after 16 weeks of an HFD (see Fig. S1 in the supplemental material).
FIG 1.
Metabolic profiles of muscle-specific IL-10-overexpressing mice (MIL10) and WT mice on standard chow and after 16 weeks of an HFD. (A) Body weight. (B) Whole-body fat mass. (C) Whole-body lean mass. (D and E) Basal plasma glucose and insulin levels following overnight fast (∼17 h). Values are means ± SE for 6 mice in each group. *, P < 0.05.
MIL10 mice are protected from HFD-induced insulin resistance.
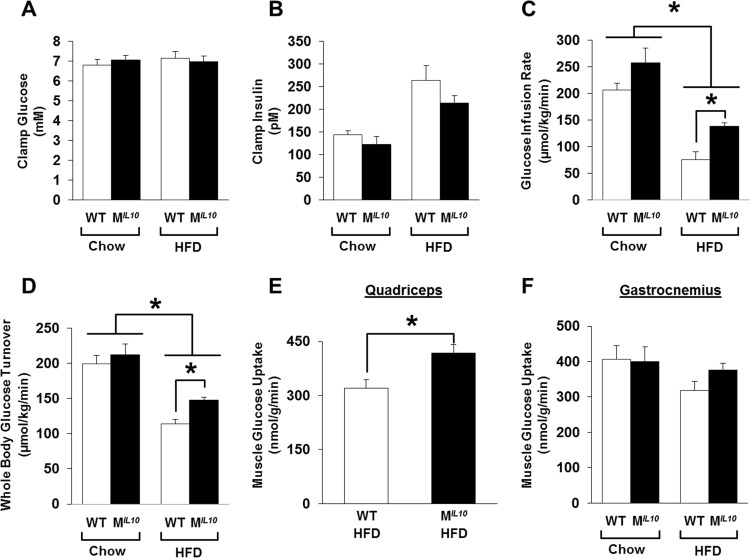
Basal glucose levels increased after 16 weeks of an HFD in both groups of mice (i.e., hyperglycemia), and plasma insulin levels were also elevated by more than 6-fold in both groups of mice after an HFD (Fig. 1D and E). To determine the effects on whole-body glucose metabolism, a 2-h hyperinsulinemic-euglycemic clamp was conducted in awake mice. During the clamp, plasma glucose levels were maintained at euglycemia (∼7 mM), and plasma insulin levels were raised to ∼130 pM and ∼230 pM in both groups of standard-chow- and HFD-fed mice, respectively (Fig. 2A and B).
FIG 2.
A 2-h hyperinsulinemic-euglycemic clamp was performed in awake WT and MIL10 mice after 16 weeks of an HFD to assess insulin sensitivity. (A and B) Plasma glucose and insulin levels during the clamp. (C) Steady-state glucose infusion rates during the clamps. (D) Whole-body glucose turnover. (E and F) Insulin-stimulated glucose uptake in skeletal muscle (quadriceps and gastrocnemius). Values are means ± SE for 6 mice in each group. *, P < 0.05.
After 16 weeks of an HFD, the WT mice developed insulin resistance, as shown by a ∼60% decrease in glucose infusion rates during the clamp compared to the level in standard-chow-fed WT mice (Fig. 2C). Although glucose infusion rates also decreased in the MIL10 mice after an HFD, the glucose infusion rates in the HFD-fed MIL10 mice were significantly higher than in HFD-fed WT mice (Fig. 2C). Radioactive isotope labeling data during the clamp showed a markedly increased whole-body glucose turnover in the HFD-fed MIL10 mice compared to that of the HFD-fed WT mice (Fig. 2D), indicating that MIL10 mice were more insulin sensitive than WT mice after 16 weeks of an HFD.
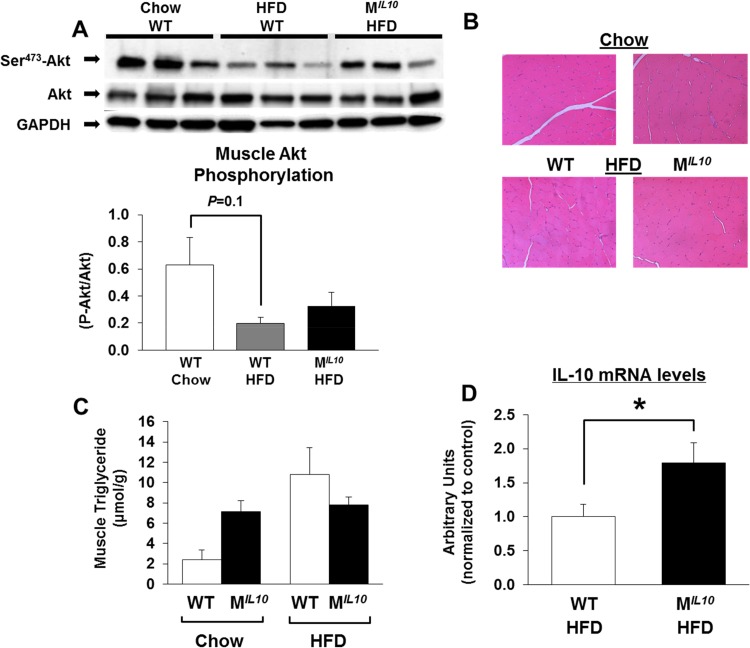
Increased insulin sensitivity in HFD-fed MIL10 mice was largely due to a 30% increase in glucose uptake in skeletal muscle (quadriceps) (Fig. 2E). Insulin-stimulated glucose uptake in gastrocnemius muscle also increased in HFD-fed MIL10 mice compared to that in HFD-fed WT mice, but this difference did not reach statistical significance (Fig. 2F). To further examine muscle insulin action, we performed Western blotting using skeletal muscle to assess insulin signaling and found that Ser-473 phosphorylation of Akt did not differ between WT and MIL10 mice on a standard chow diet, consistent with comparable muscle glucose uptake in these mice (see Fig. S2A in the supplemental material). After 16 weeks of an HFD, muscle Akt phosphorylation was decreased by ∼70% in WT mice (P = 0.1), and muscle Akt phosphorylation tended to be higher in HFD-fed MIL10 mice than in HFD-fed WT mice (Fig. 3A). Hematoxylin-eosin-stained sections of skeletal muscle from WT and MIL10 mice showed no obvious anomaly in the overall structure (Fig. 3B). Additionally, intramuscular triglyceride levels tended to be elevated in standard-chow-fed MIL10 mice compared to the levels in standard-chow-fed WT mice (Fig. 3C). After the HFD, intramuscular triglyceride levels were comparable between MIL10 and WT mice. The IL-10 mRNA levels in skeletal muscle were approximately 2-fold higher in HFD-fed MIL10 mice than in HFD-fed WT mice (Fig. 3D).
FIG 3.
Insulin signaling, muscle morphology, and triglyceride and IL-10 levels in skeletal muscle. (A) Insulin-stimulated Akt phosphorylation in quadriceps muscles. (B) Hematoxylin-eosin staining of gastrocnemius muscles of MIL10 and WT mice fed standard chow or an HFD. (C) Intramuscular triglyceride content in quadriceps muscles of MIL10 and WT mice fed standard chow or an HFD (n = 3 to 5/group). (D) IL-10 mRNA levels in gastrocnemius muscles of HFD-fed MIL10 and WT mice as measured by qRT-PCR (n = 4 or 5/group). Values are means ± SE for each group. *, P < 0.05. GAPDH, glyceraldehyde-3-phosphate dehydrogenase.
Obesity-mediated inflammation in skeletal muscle is attenuated in MIL10 mice.
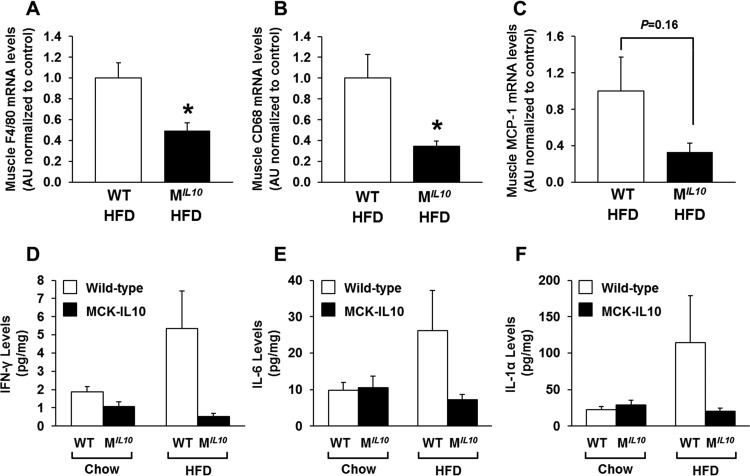
We have previously shown that inflammation develops in skeletal muscle after 3 weeks of an HFD and that this local inflammation may be causally associated with insulin resistance (9). To that end, we assessed the inflammation profile in skeletal muscle by performing quantitative RT-PCR using samples obtained from HFD-fed MIL10 and WT mice. Skeletal muscle mRNA levels of F4/80 and CD68, as markers of macrophage infiltration, were decreased significantly in HFD-fed MIL10 mice compared to levels in HFD-fed WT mice (Fig. 4A and B). Muscle monocyte chemotactic protein 1 (MCP-1) mRNA levels also decreased in HFD-fed MIL10 mice (Fig. 4C). Using Luminex analysis, we found that local levels of IFN-γ, IL-1α, and IL-6 were increased by 2- to 4-fold in muscle samples from WT mice after 16 weeks of an HFD (Fig. 4D to F). In contrast, muscle samples from HFD-fed MIL10 mice showed completely normal levels of IFN-γ, IL-1α, and IL-6, indicating that muscle IL-10 overexpression protected against diet-induced inflammation in skeletal muscle (Fig. 4D to F). Plasma levels of IL-10 and IL-6 did not significantly differ between WT and MIL10 mice on standard chow or an HFD (see Fig. S2B and C in the supplemental material). Plasma IL-1α levels tended to increase by more than 2-fold in WT mice after 16 weeks of an HFD, but levels in MIL10 mice were not affected by an HFD (see Fig. S2D).
FIG 4.
Local inflammation in skeletal muscles of MIL10 and WT mice on standard chow or after 16 weeks of an HFD. (A to C) F4/80, CD68, and MCP-1 mRNA levels in quadriceps muscles of HFD-fed MIL10 and WT mice as measured by qRT-PCR (n = 3/group). (D to F) IFN-γ, IL-6, and IL-1α levels in gastrocnemius muscles of HFD- and standard-chow-fed MIL10 and WT mice as measured by multiplex ELISA (n = 4 to 6/group). Values are means ± SE for each group. *, P < 0.05. AU, arbitrary units.
Obesity-mediated inflammation and insulin resistance in adipose tissue and liver.
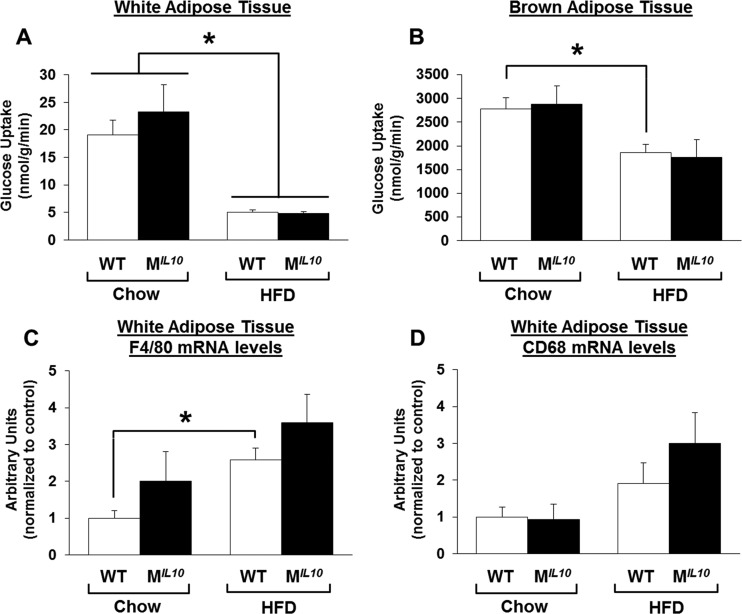
Insulin-stimulated glucose uptake in white and brown adipose tissues did not differ between standard-chow-fed WT and MIL10 mice (Fig. 5A and B). After 16 weeks of an HFD, white and brown adipose tissue developed insulin resistance in both groups of mice (Fig. 5A and B). mRNA levels of the macrophage markers F4/80 and CD68 were also increased in white adipose tissue by a chronic HFD but were not different between HFD-fed WT and MIL10 mice (Fig. 5C and D).
FIG 5.
Insulin-stimulated glucose uptake and inflammation in adipose tissues. (A and B) Insulin-stimulated glucose uptake in white (epidydimal) and brown (intrascapular) adipose tissue in MIL10 and WT mice fed standard chow or an HFD (n = 4 to 7/group). (C and D) F4/80 and CD68 mRNA levels in white adipose tissues of MIL10 and WT mice fed standard chow or an HFD (n = 5 or 6/group). Values are means ± SE for each group. *, P < 0.05.
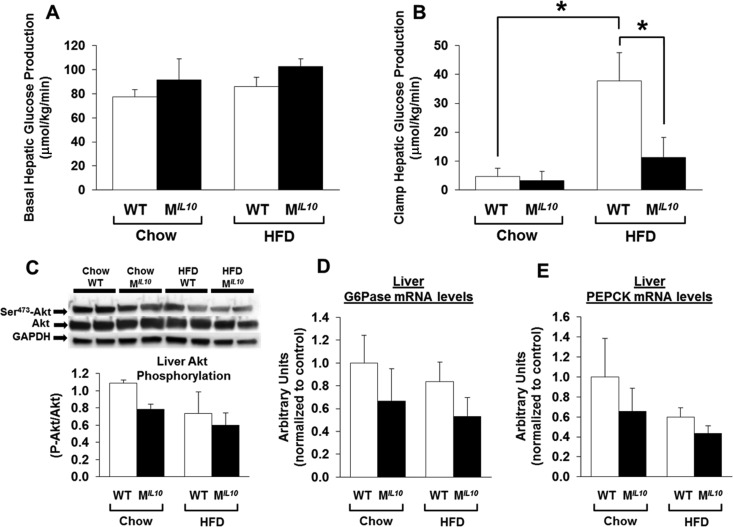
Basal HGP levels did not differ between WT and MIL10 mice on a standard chow diet or an HFD (Fig. 6A). During the clamp, insulin decreased HGP in both standard-chow-fed WT and MIL10 mice (Fig. 6B). HFD-fed WT mice developed insulin resistance in liver, as indicated by increased clamp HGP, but HFD-fed MIL10 mice showed lower clamp HGP than HFD-fed WT mice (Fig. 6B). Western blot analysis showed that neither phospho-Akt nor total Akt protein levels were altered between WT and MIL10 mice on standard chow or an HFD (Fig. 6C). However, liver mRNA levels of glucose-6-phosphatase (G6Pase) and phosphoenolpyruvate carboxykinase (PEPCK) tended to be lower in HFD-fed MIL10 mice than in HFD-fed WT mice (Fig. 6D and E). mRNA levels in liver of the macrophage markers CD68 and F4/80 were not significantly altered in HFD-fed MIL10 mice, indicating that local inflammation was selectively suppressed in skeletal muscle (see Fig. S2E and F in the supplemental material).
FIG 6.
Hepatic glucose metabolism and insulin signaling in MIL10 and WT mice fed standard chow or an HFD for 16 weeks. (A and B) Hepatic glucose production (HGP) at the basal state and during a hyperinsulinemic-euglycemic clamp in mice (n = 5 or 6/group). (C) Insulin-stimulated Akt phosphorylation in liver. (D and E) Liver G6Pase and PEPCK mRNA levels (n = 4 to 6/group). Values are means ± SE for each group. *, P < 0.05.
IL-10-expressing leptin-deficient mice are protected from insulin resistance.
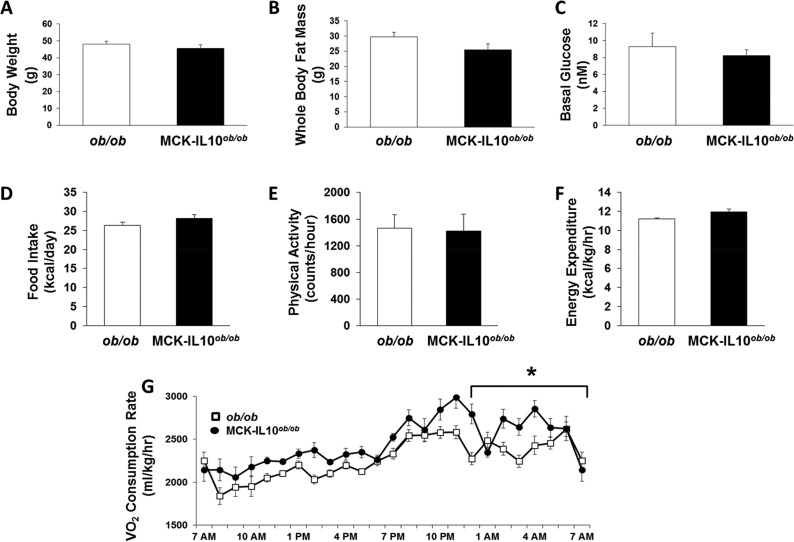
Recent studies have shown deleterious effects of an HFD on the intestinal epithelium and the role of gut microbes on obesity-mediated inflammation (19). Thus, we have generated muscle-selective IL-10-expressing, spontaneously obese mice by cross-breeding MIL10 mice with heterozygous leptin-deficient ob/+ mice. The offspring from this cross were further mated to obtain MCK-IL10ob/ob mice. As expected, ob/ob mice became obese spontaneously on a standard chow diet, and by 16 weeks of age, whole-body fat mass accounted for more than 50% of body weight in ob/ob mice (Fig. 7A and B). MCK-IL10ob/ob mice also became spontaneously obese on a standard chow diet and reached a degree of obesity comparable to that of ob/ob mice at 16 weeks of age (Fig. 7A and B). Basal plasma glucose and fatty acid levels were similar in both groups of mice (Fig. 7C; see also Fig. S3A in the supplemental material). A 3-day metabolic cage analysis showed that daily food intake and physical activity did not differ between groups (Fig. 7D and E). In contrast, MCK-IL10ob/ob mice showed a modest but significant increase in energy expenditure that was largely due to elevated VO2 consumption selectively in the night cycle compared to levels in ob/ob mice (Fig. 7F and G).
FIG 7.
Metabolic effects of muscle-specific IL-10 overexpression in leptin-deficient ob/ob mice (MCK-IL10ob/ob). (A to C) Body weight, whole-body fat mass using 1H-MRS, and fasting glucose levels were measured from 7 MCK-IL10ob/ob and 11 ob/ob mice. (D to G) Daily food intake, physical activity, energy expenditure, and average of hourly VO2 consumption were measured during a 3-day analysis of metabolic cages in 3 MCK-IL10ob/ob and 4 ob/ob mice. Values are means ± SE for each group. *, P < 0.05.
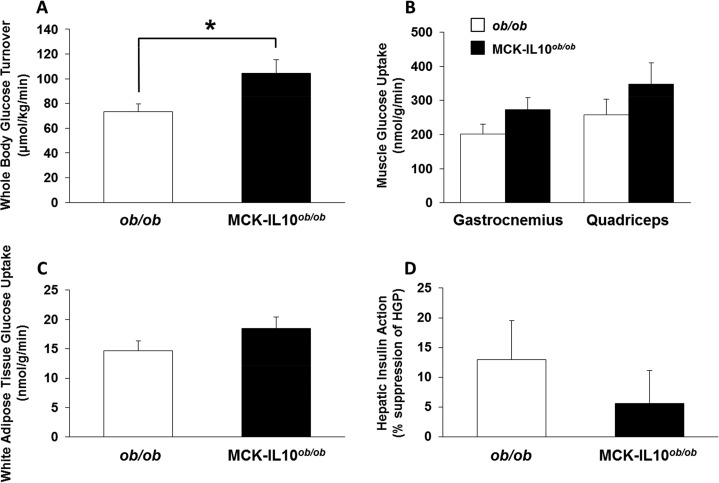
The hyperinsulinemic-euglycemic clamp study showed a significantly increased whole-body glucose turnover in MCK-IL10ob/ob mice compared to that in ob/ob mice, suggesting increased insulin sensitivity in these mice (Fig. 8A). Consistent with this notion, insulin-stimulated glucose uptake in skeletal muscle tended to increase in MCK-IL10ob/ob mice compared to that in ob/ob mice although this difference did not reach statistical significance (Fig. 8B). Glucose uptake in white adipose tissue and hepatic insulin action did not differ between groups (Fig. 8C and D).
FIG 8.
A 2-h hyperinsulinemic-euglycemic clamp in awake MCK-IL10ob/ob and ob/ob mice. (A) Whole-body glucose turnover in MCK-IL10ob/ob (n = 7) and ob/ob (n = 11) mice. (B) Insulin-stimulated glucose uptake in gastrocnemius and quadriceps muscles. (C) White adipose tissue glucose uptake in MCK-IL10ob/ob (n = 7) and ob/ob (n = 12) mice. (D) Hepatic insulin action reflected as insulin-mediated percent suppression of HGP in MCK-IL10ob/ob (n = 7) and ob/ob mice (n = 11). Values are means ± SE for each group. *, P < 0.05.
Mice lacking muscle IL-10 signaling are insulin resistant after an HFD.
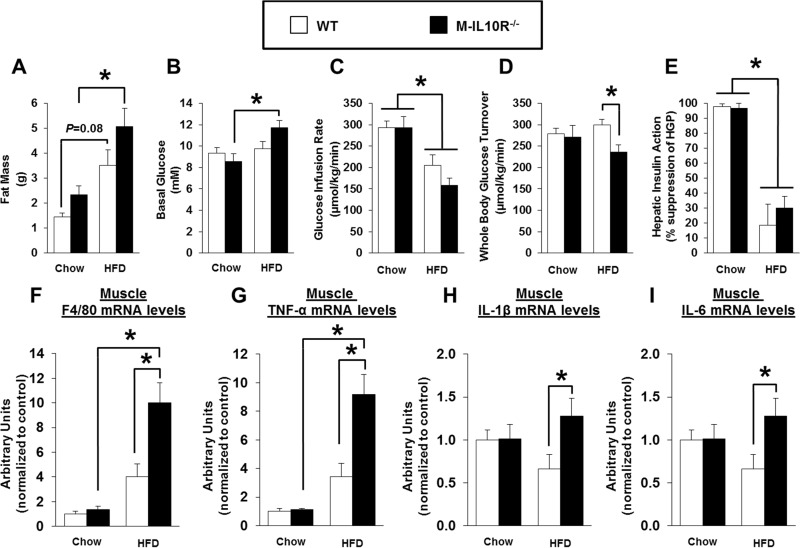
To determine the cell type responsible for the downstream effects of IL-10, we have generated mice with muscle-specific ablation of IL-10 receptor (M-IL10R−/−) (see Fig. S3B and C). Male M-IL10R−/− mice and MCK-Cre mice (as controls; WT) were fed an HFD or standard chow diet ad libitum starting at 7 weeks of age. Metabolic studies were performed after 6 weeks of an HFD, prior to the onset of overt hyperglycemia that may affect glucose metabolism (i.e., glucose toxicity). Both groups of M-IL10R−/− and WT mice gained similar fat masses after 6 weeks of an HFD (Fig. 9A). Basal glucose levels were higher after an HFD in M-IL10R−/− mice than in WT mice (Fig. 9B). During the hyperinsulinemic-euglycemic clamp, plasma glucose levels were maintained at euglycemia (∼7 mM) in both groups of mice (data not shown). Strikingly, whole-body glucose turnover rates were significantly decreased, and glucose infusion rates were lower in HFD-fed M-IL10R−/− than in HFD-fed WT mice (Fig. 9C and D). Hepatic insulin action during the clamp did not differ between WT and M-IL10R−/− mice fed standard chow or an HFD (Fig. 9E). Quadriceps and gastrocnemius muscle glucose uptake tended to be lower in M-IL10R−/− mice than in WT mice after an HFD (see Fig. S3D in the supplemental material).
FIG 9.
Metabolic profile, insulin action, and skeletal muscle inflammation were assessed in M-IL10R−/− mice and WT mice after 6 weeks of an HFD or standard chow diet. (A) Whole-body fat mass measured using 1H-MRS. (B) Basal glucose levels. (C) Glucose infusion rates during a hyperinsulinemic-euglycemic clamp in awake mice (n = 6 to 11). (D) Whole-body glucose turnover. (E) Hepatic insulin action expressed as insulin-mediated percent suppression of HGP. (F to I) F4/80, TNF-α, IL-1β, and IL-6 mRNA levels in skeletal muscles of WT and M-IL10R−/− mice fed standard chow or an HFD (n = 3 to 7/group). Values are means ± SE for each group. *, P < 0.05.
Furthermore, local IL-10 levels in skeletal muscle tended to decrease in M-IL10R−/− mice as a possible feedback loop of IL-10 signaling (see Fig. S3E). Muscle mRNA levels of F4/80 (macrophage marker) and tumor necrosis factor alpha (TNF-α) were markedly increased in WT mice after an HFD (Fig. 9F and G). Importantly, HFD-fed M-IL10R−/− mice showed a significant further increase in muscle mRNA levels of F4/80, TNF-α, IL-6, and IL-1β compared to levels in HFD-fed WT mice, indicating that muscle deletion of IL-10 receptor exacerbated HFD-induced local inflammation in skeletal muscle (Fig. 9F to I).
DISCUSSION
Although adipose tissue macrophage accumulation and inflammation are well-described characteristics of obesity-mediated insulin resistance, recent studies refute the cause-and-effect relationship between adipose tissue inflammation and insulin resistance (5–8). Lee et al. have shown that insulin resistance develops in the absence of adipose tissue inflammation after 3 days of high-fat feeding (8). Our recent study also found that a short-term weight loss induced by a low-calorie diet or by exercise improves insulin sensitivity without altering adipose tissue inflammation (7). These findings indicate that adipose tissue inflammation develops in obesity, but it may not be causally associated with insulin resistance in skeletal muscle, a major organ responsible for glucose disposal.
Obesity is a state of systemic inflammation, and local inflammation develops in multiple organs, including skeletal muscle and liver (9, 10). Importantly, recent studies have suggested a direct and causal role of skeletal muscle inflammation and muscle-derived cytokines in the development of insulin resistance (20–25). Our previous study has found that after 3 weeks of high-fat feeding, skeletal muscle was characterized by inflammation, insulin resistance, and reduced glucose metabolism (9). Thus, these findings are consistent with a notion that an HFD-mediated local inflammation in skeletal muscle is causally associated with insulin resistance. However, the metabolic and inflammatory process developing in metabolic organs after a short-term high-fat feeding may differ from the events following chronic obesity. Additionally, chronic obesity models (e.g., a long-term HFD) that are better reflecting type 2 diabetes conditions potentially involve increased insult from immune cells and inflammatory signaling in skeletal muscle, adipose tissue, and kidney as well as more compromised lipid metabolism and inflammation in the liver (8, 26, 27). Therefore, our current study addresses the effects of anti-inflammatory cytokine IL-10 under chronically obese conditions induced by a 16-week feeding of an HFD. Moreover, leptin is known to regulate inflammation and immunity with its effects on T cell and macrophage-secreted cytokines (17, 28, 29). Thus, the leptin-deficient model used in the current study rules out the potential leptin effects on inflammation. Our newly generated MCK-IL10ob/ob mice also circumvent direct effects of excess dietary lipid uptake and lipid-induced inflammation/insulin resistance because these mice develop spontaneous obesity on a standard chow diet.
As a model of diet-induced obesity and type 2 diabetes, we examined the effects of a long-term HFD on glucose metabolism and local inflammation in MIL10 mice. After 16 weeks of an HFD, WT mice became markedly obese, with a 4-fold increase in whole-body fat mass. Intramuscular levels of IL-6, IFN-γ, and IL-1α were low in chow-fed mice as expected, but after 16 weeks of an HFD, local cytokine levels in skeletal muscle were elevated by 3- to 4-fold in WT mice. Some of these inflammatory cytokines may be released by locally infiltrating macrophages and/or surrounding adipocytes in skeletal muscle fiber. IL-6 was previously shown to induce insulin resistance by activating STAT3 and increasing intracellular levels of SOCS3, which may target insulin-signaling proteins for ubiquitin-mediated degradation, causing insulin resistance (30, 31). In contrast, IL-6 has also been shown to be released by postexercise skeletal muscle and to promote glucose metabolism, but this cellular effect involves a much higher level of IL-6 than what is typically observed in obesity (32). Furthermore, IL-1α was shown to inhibit insulin signaling by inducing serine phosphorylation of insulin receptor substrate 1 (IRS-1) in adipocytes (33). Consistent with this notion, insulin-stimulated Akt phosphorylation was reduced in the skeletal muscle of HFD-fed WT mice, supporting the cause-and-effect relationship between obesity-mediated increases in local macrophages and inflammatory cytokines and skeletal muscle insulin resistance.
Despite marked obesity after 16 weeks of an HFD, MIL10 mice were significantly more insulin sensitive than WT mice, which was largely due to increased insulin signaling and glucose metabolism in skeletal muscle. Intramuscular lipid levels were also similar between WT and MIL10 mice after an HFD, indicating that IL-10-mediated suppression of muscle inflammation can improve insulin sensitivity without altering intramuscular lipid content in obese mice. IL-10 is an anti-inflammatory cytokine previously known as cytokine synthesis inhibiting factor (CSIF) and produced by many immune cell types, including CD4 T helper cells and macrophages (34, 35). Similar to other cytokines, such as IL-6 and tumor necrosis factor alpha (TNF-α), myocytes have also been shown to express IL-10 and IL-10 receptors (9, 36). IL-10 suppresses local inflammation by inhibiting the synthesis and action of proinflammatory cytokines, including TNF-α, IL-1β, and IL-6, as well as by inhibiting macrophage activation (37, 38). To that end, intramuscular injection of IL-10 DNA was shown to be effective in suppressing inflammation and preventing autoimmune diabetes in mice (39).
Our findings that an obesity-mediated increase in IL-6, IFN-γ, and IL-1α in skeletal muscle was normalized in MIL10 mice support the anti-inflammatory action of IL-10 in these mice. Also, HFD-fed MIL10 mice had decreased levels of the macrophage markers F4/80 and CD68, as well as reduced MCP-1 mRNA levels. Importantly, these data indicate that improved muscle glucose metabolism may be due to IL-10 effects to counteract local inflammation in response to chronic high-fat feeding in mice. Additionally, the inflammation was suppressed only in skeletal muscle of HFD-fed MIL10 mice; there was no difference in liver and adipose tissue inflammation levels in these mice. Plasma IL-10 levels were also not different in HFD-fed MIL10 mice. Furthermore, in contrast to skeletal muscle, white and brown adipose tissues of MIL10 mice remained insulin resistant after an HFD, supporting the muscle-specific expression of IL-10 and its effects on muscle glucose metabolism. However, we found that HGP during the clamp was significantly reduced in MIL10 mice compared to the level in WT mice after 16 weeks of an HFD, suggesting improved hepatic insulin action in HFD-fed MIL10 mice. Since IL-10 has been shown to be released by myocytes and since its level has been shown to modestly increase in circulation (9), IL-10 may also be responsible for suppressing gluconeogenesis in these mice. In that regard, we did not see alterations in liver Akt phosphorylation in HFD-fed MIL10 mice, but gluconeogenic gene expression tended to decrease in MIL10 mice, consistent with reduced HGP in these mice.
Recent studies have shown that an HFD with selective composition of fatty acids may be directly responsible for systemic inflammation, possibly by altering intestinal permeability or the gut microbe population (19). We along with others have also suggested that obesity-mediated inflammation is due to excess nutrient availability, imbalanced nutrient flux and metabolism, and activation of intracellular endoplasmic reticulum and oxidative stress (3, 12, 30). In order to delineate the important question pertaining to the source of obesity-mediated inflammation, we determined the effects of IL-10 in spontaneously obese mice by cross-breeding MIL10 mice with leptin-deficient ob/ob mice. As expected, IL-10-expressing ob/ob mice (MCK-IL10ob/ob) became profoundly obese while on a standard chow diet, with a fat mass accounting for more than 50% of their body weight. Despite being markedly obese and having the same level of plasma free fatty acids (FFA), MCK-IL10ob/ob mice were more insulin sensitive than ob/ob mice, further demonstrating IL-10's potent insulin-sensitizing effects associated with its anti-inflammatory effect in skeletal muscle. Thus, these data indicate that obesity-mediated inflammation and insulin resistance in skeletal muscle are not dependent on dietary composition. Our findings also suggest that IL-10's insulin-sensitizing effects are independent of leptin signaling.
The beneficial effects of IL-10 to protect against obesity-mediated insulin resistance may be due to IL-10's ability to suppress local inflammation and the deleterious action of proinflammatory cytokines in skeletal muscle. Gao et al. have recently shown that hydrodynamic delivery of mouse IL-10 protects against the HFD-mediated glucose intolerance that was associated with reduced inflammation in adipose tissue (40). However, since IL-10 receptors are expressed in multiple cell types, including immune cells and myocytes (9, 41), IL-10's direct action on myocytes cannot be ruled out. To further determine the mechanism of IL-10's insulin-sensitizing effects, we generated mice with muscle-specific ablation of IL-10 receptor. Since deletion was specific to IL-10 receptor type 1, we excluded only IL-10 signaling and not all IL-10 cytokine subfamily members. After 6 weeks of an HFD, M-IL10R−/− mice became more insulin resistant than WT mice, indicating that absence of IL-10 signaling in skeletal muscle exacerbates diet-induced insulin resistance. Also, mRNA levels of macrophage markers and inflammatory cytokines were profoundly elevated in HFD-fed M-IL10R−/− mice. These results suggest that IL-10 effects may be mediated by intracellular IL-10 signaling in skeletal muscle. To that end, we have previously found that the obesity-induced signal to activate local inflammation may involve oxidative stress and altered Ca2+ homeostasis in skeletal muscle (42). Muscle IL-10 levels also tended to be lower in M-IL10R−/− mice, which might be the result of a feedback mechanism. Thus, IL-10 signaling in myocytes may relieve oxidative stress and suppress local inflammation, resulting in improved glucose metabolism in skeletal muscle. Further studies are needed to understand how IL-10 may affect oxidative stress in skeletal muscle.
In conclusion, our findings demonstrate that obesity due to chronic high-fat feeding or leptin deficiency causes local inflammation with marked increases in IL-6, IL-1α, and IFN-γ levels in skeletal muscle. Obesity-mediated muscle inflammation is completely attenuated by local expression of IL-10, and this anti-inflammatory action of IL-10 protects against muscle insulin resistance. Additionally, IL-10 signaling in myocytes may relieve obesity-induced oxidative stress and inflammation in skeletal muscle. Taken together, these results support our previous notion that IL-10 may be a potential therapeutic target to treat insulin resistance and type 2 diabetes. Although IL-10 has a short half-life in vivo, local delivery of IL-10 is safe and may have positive effects in skeletal muscle insulin sensitivity (35). While the eventual clinical application and method of delivery need further investigation, the role of IL-10 as an anti-inflammatory and insulin-sensitizing agent may open new doors in type 2 diabetes research.
Supplementary Material
ACKNOWLEDGMENTS
We thank Roger J. Davis at the University of Massachusetts Medical School for kindly providing the MCK-Cre mice.
We have no potential conflicts of interest relevant to this article.
Funding Statement
This study was supported by grants from the U.S. Public Health Service (R01-DK080756, R01-DK079999, R24-DK090963, and UC2-DK093000 awarded to J.K.K.), an American Diabetes Association Research Award (7-07-RA-80 to J.K.K.), the Mid-Career Researcher Program (2015R1A2A1A10053567 awarded to K.W.L.) through a National Research Foundation (NRF) grant funded by the Ministry of Education, Science and Technology, Republic of Korea, and the Bio & Medical Technology Development Program (2013M3C8A2A01079268 awarded to K.W.L.) of the NRF (the civil research projects for solving social problems through the NRF) funded by the Ministry of Science, ICT, and Future Planning, Republic of Korea.
Footnotes
Supplemental material for this article may be found at http://dx.doi.org/10.1128/MCB.00181-16.
REFERENCES
- 1.Goran MI, Ball GD, Cruz ML. 2003. Obesity and risk of type 2 diabetes and cardiovascular disease in children and adolescents. J Clin Endocrinol Metab 88:1417–1427. doi: 10.1210/jc.2002-021442. [DOI] [PubMed] [Google Scholar]
- 2.Hossain P, Kawar B, El Nahas M. 2007. Obesity and diabetes in the developing world—a growing challenge. N Engl J Med 356:213–215. doi: 10.1056/NEJMp068177. [DOI] [PubMed] [Google Scholar]
- 3.Wellen K, Hotamisligil GS. 2005. Inflammation, stress, and diabetes. J Clin Invest 115:1111–1119. doi: 10.1172/JCI25102. [DOI] [PMC free article] [PubMed] [Google Scholar]
- 4.Haffner SM. 2006. The metabolic syndrome: inflammation, diabetes mellitus, and cardiovascular disease. Am J Cardiol 97:3A–11A. [DOI] [PubMed] [Google Scholar]
- 5.Wellen KE, Hotamisligil GS. 2003. Obesity-induced inflammatory changes in adipose tissue. J Clin Invest 12:1785–1788. [DOI] [PMC free article] [PubMed] [Google Scholar]
- 6.Weisberg SP, McCann D, Desai M, Rosenbaum M, Leibel RL, Ferrante AW Jr. 2003. Obesity is associated with macrophage accumulation in adipose tissue. J Clin Invest 112:1796–1808. doi: 10.1172/JCI200319246. [DOI] [PMC free article] [PubMed] [Google Scholar]
- 7.Jung DY, Ko HJ, Lichtman EI, Lee E, Lawton E, Ong H, Yu K, Azuma Y, Friedline RH, Lee KW, Kim JK. 2013. Short-term weight loss attenuates local tissue inflammation and improves insulin sensitivity without affecting adipose inflammation in obese mice. Am J Physiol Endocrinol Metab 304:E964–E976. doi: 10.1152/ajpendo.00462.2012. [DOI] [PMC free article] [PubMed] [Google Scholar]
- 8.Lee YS, Li P, Huh JY, Lu M, Kim JI, Ham M, Talukdar S, Chen A, Lu WJ, Bandyopadhyay GK, Schwendener R, Olefsky J, Kim JB. 2011. Inflammation is necessary for long-term but not short-term high-fat diet-induced insulin resistance. Diabetes 60:2474–2483. doi: 10.2337/db11-0194. [DOI] [PMC free article] [PubMed] [Google Scholar]
- 9.Hong E, Ko HJ, Cho Y, Kim HJ, Ma Z, Yu TY, Friedline RH, Kurt-Jones E, Finberg R, Fischer MA, Granger EL, Norbury CC, Hauschka SD, Philbrick WM, Lee CG, Elias JA, Kim JK. 2009. Interleukin-10 prevents diet-induced insulin resistance by attenuating macrophage and cytokine response in skeletal muscle. Diabetes 58:2525–2535. doi: 10.2337/db08-1261. [DOI] [PMC free article] [PubMed] [Google Scholar]
- 10.Cai D, Yuan M, Frantz DF, Melendez PA, Hansen L, Lee J, Shoelson S. 2005. Local and systemic insulin resistance resulting from hepatic activation of IKK-β and NF-κB. Nat Med 11:183–190. doi: 10.1038/nm1166. [DOI] [PMC free article] [PubMed] [Google Scholar]
- 11.Gukovsky I, Li N, Todoric J, Gukovskaya A, Karin M. 2013. Inflammation, autophagy, and obesity: common features in the pathogenesis of pancreatitis and pancreatic cancer. Gastroenterology 144:1199–1209. doi: 10.1053/j.gastro.2013.02.007. [DOI] [PMC free article] [PubMed] [Google Scholar]
- 12.Ko HJ, Zhang Z, Jung DY, Jun JY, Ma Z, Jones KE, Chan SY, Kim JK. 2009. Nutrient stress activates inflammation and reduces glucose metabolism by suppressing AMPK in heart. Diabetes 58:2536–2546. doi: 10.2337/db08-1361. [DOI] [PMC free article] [PubMed] [Google Scholar]
- 13.Thaler JP, Guyenet SJ, Dorfman MD, Wisse BE, Schwartz MW. 2013. Hypothalamic inflammation: marker or mechanism of obesity pathogenesis? Diabetes 62:2629–2634. doi: 10.2337/db12-1605. [DOI] [PMC free article] [PubMed] [Google Scholar]
- 14.Akdis CA, Blaser K. 2001. Mechanisms of interleukin-10-mediated immune suppression. Immunology 103:131–136. doi: 10.1046/j.1365-2567.2001.01235.x. [DOI] [PMC free article] [PubMed] [Google Scholar]
- 15.Fillatreau S, Gray D, Anderton SM. 2008. Not always the bad guys: B cells as regulators of autoimmune pathology. Nat Rev Immunol 8:391–397. doi: 10.1038/nri2315. [DOI] [PubMed] [Google Scholar]
- 16.Pestka S, Krause CD, Sarkar D, Walter MR, Shi Y, Fisher PB. 2004. Interleukin-10 and related cytokines and receptors. Annu Rev Immunol 22:929–979. doi: 10.1146/annurev.immunol.22.012703.104622. [DOI] [PubMed] [Google Scholar]
- 17.Fantuzzi G, Faggioni R. 2000. Leptin in the regulation of immunity, inflammation, and hematopoiesis. J Leukoc Biol 68:437–446. [PubMed] [Google Scholar]
- 18.Kim JK. 2009. Hyperinsulinemic-euglycemic clamp to assess insulin sensitivity in vivo. Methods Mol Biol 560:221–238. doi: 10.1007/978-1-59745-448-3_15. [DOI] [PubMed] [Google Scholar]
- 19.Cani PD, Bibiloni R, Knauf C, Waget A, Neyrinck AM, Delzenne NM, Burcelin R. 2008. Changes in gut microbiota control metabolic endotoxemia-induced inflammation in high-fat diet-induced obesity and diabetes in mice. Diabetes 57:1470–1481. doi: 10.2337/db07-1403. [DOI] [PubMed] [Google Scholar]
- 20.Kewalramani G, Bilan PJ, Klip A. 2010. Muscle insulin resistance: assault by lipids, cytokines and local macrophages. Curr Opin Clin Nutr Metab Care 13:382–390. doi: 10.1097/MCO.0b013e32833aabd9. [DOI] [PubMed] [Google Scholar]
- 21.Olefsky JM, Glass CK. 2010. Macrophages, inflammation, and insulin resistance. Annu Rev Physiol 72:219–246. doi: 10.1146/annurev-physiol-021909-135846. [DOI] [PubMed] [Google Scholar]
- 22.Pillon NJ, Bilan PJ, Fink LN, Klip A. 2013. Cross-talk between skeletal muscle and immune cells: Muscle-derived mediators and metabolic implications. Am J Physiol Endocrinol Metab 304:E453–E465. doi: 10.1152/ajpendo.00553.2012. [DOI] [PubMed] [Google Scholar]
- 23.Saghizadeh M, Ong JM, Garvey WT, Henry RR, Kern PA. 1996. The expression of TNF alpha by human muscle. Relationship to insulin resistance. J Clin Invest 97:1111–1116. [DOI] [PMC free article] [PubMed] [Google Scholar]
- 24.Torres S, De Sanctis J, de Briceno L, Hernández N, Finol HJ. 2004. Inflammation and nitric oxide production in skeletal muscle of type 2 diabetic patients. J Endocrinol 181:419–427. doi: 10.1677/joe.0.1810419. [DOI] [PubMed] [Google Scholar]
- 25.Varma V, Yao-Borengasser A, Rasouli N, Nolen GT, Phanavanh B, Starks T, Gurley C, Simpson P, McGehee RE Jr, Kern PA, Peterson CA. 2009. Muscle inflammatory response and insulin resistance: synergistic interaction between macrophages and fatty acids leads to impaired insulin action. Am Physiol Endocrinol Metab 296:E1300–E1310. doi: 10.1152/ajpendo.90885.2008. [DOI] [PMC free article] [PubMed] [Google Scholar]
- 26.Ciapaite J, van den Broek NM, Te Brinke H, Nicolay K, Jeneson JA, Houten SM, Prompers JJ. 2011. Differential effects of short- and long-term high-fat diet feeding on hepatic fatty acid metabolism in rats. Biochim Biophys Acta 1811:441–1451. doi: 10.1016/j.bbalip.2011.05.005. [DOI] [PubMed] [Google Scholar]
- 27.Crinigan C, Calhoun M, Sweazea KL. 2015. Short-term high fat intake does not significantly alter markers of renal function or inflammation in young male Sprague-Dawley rats. J Nutr Metab 2015:157520–157529. doi: 10.1155/2015/157520. [DOI] [PMC free article] [PubMed] [Google Scholar]
- 28.Lord GM, Matarese G, Howard JK, Baker RJ, Bloom SR, Lechler RI. 1998. Leptin modulates the T-cell immune response and reverses starvation-induced immunosuppression. Nature 394:897–901. doi: 10.1038/29795. [DOI] [PubMed] [Google Scholar]
- 29.Santos-Alvarez J, Goberna R, Sanchez-Margalet V. 1999. Human leptin stimulates proliferation and activation of human circulating monocytes. Cell Immunol 194:6–11. doi: 10.1006/cimm.1999.1490. [DOI] [PubMed] [Google Scholar]
- 30.Kern PA, Ranganathan S, Li C, Wood L, Ranganathan G. 2001. Adipose tissue tumor necrosis factor and interleukin-6 expression in human obesity and insulin resistance. Am J Physiol Endocrinol Metab 280:E745–E751. [DOI] [PubMed] [Google Scholar]
- 31.Shi H, Tzameli I, Bjørbæk J, Flier JS. 2004. Suppressor of cytokine signaling 3 is a physiological regulator of adipocyte insulin signaling. J Biol Chem 279:34733–34740. doi: 10.1074/jbc.M403886200. [DOI] [PubMed] [Google Scholar]
- 32.Nieto-Vazquez I, Fernández-Veledo S, de Alvaro C, Lorenzo M. 2008. Dual role of interleukin-6 in regulating insulin sensitivity in murine skeletal muscle. Diabetes 57:3211–3221. doi: 10.2337/db07-1062. [DOI] [PMC free article] [PubMed] [Google Scholar] [Retracted]
- 33.He J, Usui I, Ishizuka K, Kanatani Y, Hiratani K, Iwata M, Bukhari A, Haruta T, Sasaoka T, Kobayashi M. 2006. Interleukin-1α inhibits insulin signaling with phosphorylating insulin receptor substrate-1 on serine residues in 3T3-L1 adipocytes. Mol Endocrinol 20:114–124. doi: 10.1210/me.2005-0107. [DOI] [PubMed] [Google Scholar]
- 34.Fiorentino DF, Bond MW, Mosmann TR. 1989. Two types of mouse T helper cell. IV. Th2 clones secrete a factor that inhibits cytokine production by Th1 clones. J Exp Med 170:2081–2095. [DOI] [PMC free article] [PubMed] [Google Scholar]
- 35.Asadullah K, Sterry W, Volk HD. 2003. Interleukin-10 therapy-review of a new approach. Pharm Rev 55:241–269. doi: 10.1124/pr.55.2.4. [DOI] [PubMed] [Google Scholar]
- 36.Alvarez B, Quinn LS, Busquets S, López-Soriano FJ, Argilés JM. 2002. TNF-α modulates cytokine and cytokine receptors in C2C12 myotubes. Cancer Lett 175:181–185. doi: 10.1016/S0304-3835(01)00717-0. [DOI] [PubMed] [Google Scholar]
- 37.de Waal Malefyt R, Abrams J, Bennett B, Figdor CG, de Vries JE. 1991. Interleukin 10 (IL-10) inhibits cytokine synthesis by human monocytes: An autoregulatory role of IL-10 produced by monocytes. J Exp Med 174:1209–1220. doi: 10.1084/jem.174.5.1209. [DOI] [PMC free article] [PubMed] [Google Scholar]
- 38.O'Farrell A, Liu Y, Moore KW, Mui AL. 1998. IL-10 inhibits macrophage activation and proliferation by distinct signaling mechanisms: evidence for Stat3-dependent and-independent pathways. EMBO J 17:1006–1018. doi: 10.1093/emboj/17.4.1006. [DOI] [PMC free article] [PubMed] [Google Scholar]
- 39.Zhang Z, Shen S, Lin B, Yu LY, Zhu LH, Wang WP, Luo FH, Guo LH. 2003. Intramuscular injection of interleukin-10 plasmid DNA prevented autoimmune diabetes in mice. Acta Pharmacol Sin 24:751–756. [PubMed] [Google Scholar]
- 40.Gao M, Zhang C, Ma Y, Bu L, Yan L, Liu D. 2013. Hydrodynamic delivery of mIL10 gene protects mice from high-fat diet-induced obesity and glucose intolerance. Mol Ther 21:1852–1861. doi: 10.1038/mt.2013.125. [DOI] [PMC free article] [PubMed] [Google Scholar]
- 41.Moore KW, de Waal Malefyt R, Coffman RL, O'Garra A. 2001. Interleukin-10 and the interleukin-10 receptor. Annu Rev Immunol 19:683–765. doi: 10.1146/annurev.immunol.19.1.683. [DOI] [PubMed] [Google Scholar]
- 42.Zhang Z, Zhang W, Jung DY, Ko HJ, Lee Y, Friedline RH, Lee E, Jun J, Ma Z, Kim F, Tsitsilianos N, Chapman K, Morrison A, Cooper MP, Miller BA, Kim JK. 2012. TRPM2 Ca2+ channel regulates energy balance and glucose metabolism. Am J Physiol Endocrinol Metab 302:E807–E816. doi: 10.1152/ajpendo.00239.2011. [DOI] [PMC free article] [PubMed] [Google Scholar]
Associated Data
This section collects any data citations, data availability statements, or supplementary materials included in this article.


