

Abstract
Objective:
To examine the utility and reliability of volumetric MRI in measuring disease progression in the 4 repeat tauopathies, progressive supranuclear palsy (PSP) and corticobasal syndrome (CBS), to support clinical development of new tau-directed therapeutic agents.
Methods:
Six- and 12-month changes in regional MRI volumes and PSP Rating Scale scores were examined in 55 patients with PSP and 33 patients with CBS (78% amyloid PET negative) compared to 30 normal controls from a multicenter natural history study. Longitudinal voxel-based morphometric analyses identified patterns of volume loss, and region-of-interest analyses examined rates of volume loss in brainstem (midbrain, pons, superior cerebellar peduncle), cortical, and subcortical regions based on previously validated atlases. Results were compared to those in a replication cohort of 226 patients with PSP with MRI data from the AL-108-231 clinical trial.
Results:
Patients with CBS exhibited greater baseline atrophy and greater longitudinal atrophy rates in cortical and basal ganglia regions than patients with PSP; however, midbrain and pontine atrophy rates were similar. Voxel-wise analyses showed distinct patterns of regional longitudinal atrophy in each group as compared to normal controls. The midbrain/pons volumetric ratio differed between diagnoses but remained stable over time. In both patient groups, brainstem atrophy rates were correlated with disease progression measured using the PSP Rating Scale.
Conclusions:
Volume loss is quantifiable over a period of 6 months in CBS and PSP. Future clinical trials may be able to combine CBS and PSP to measure therapeutic effects.
Progressive supranuclear palsy (PSP) and corticobasal degeneration (CBD) are rare neurodegenerative disorders associated with the accumulation of insoluble deposits of predominantly 4 microtubule binding domain repeat (4R) tau protein in specific brain regions, mainly in the absence of other pathogenic proteins including β-amyloid.1 Accordingly, PSP and CBD are classified as primary 4R tauopathies. There are currently no effective therapies for either disorder, but the development of new therapeutic agents that target the tau protein has led to increased interest in pursuing clinical trials in CBD and PSP, either individually or for a combined 4R tauopathy indication.
Both PSP and corticobasal syndrome (CBS), the most common clinical syndrome associated with CBD pathology, exhibit specific patterns of brain atrophy that are measurable on MRI scans. Atrophy is most prominent in brainstem regions in PSP, with more variable involvement of the basal ganglia and neocortical regions.2–7 In CBS, atrophy predominantly involves dorsal neocortical gray and white matter and the basal ganglia.2,3,5,7–10 Prior studies have identified global and regional MRI changes in PSP over the course of 1 year or longer11–14 but shorter intervals were rarely examined and CBS was not included. The present study compared regional patterns and rates of atrophy in these two 4R tauopathies over a shorter time frame that would be more feasible for clinical trials. To determine the validity and reliability of the measurements, analyses were repeated in a replication cohort of patients with PSP drawn from the AL-108-231 clinical trial.
METHODS
Participants.
Thirty-three participants with CBS and 55 with PSP were recruited at 4 sites (University of California, San Francisco [UCSF]; University of Toronto [Toronto]; University of California, San Diego [UCSD]; Massachusetts General Hospital [MGH]) as part of the 4 Repeat Tauopathy Neuroimaging Initiative (4RTNI) study. Participants with PSP met the National Institute of Neurological Disorders and Stroke/Society for PSP criteria for PSP-Richardson syndrome as modified for the AL-108-231 study15,16 (PSP). Patients with CBS met Armstrong criteria for possible or probable CBS-CBD subtype17 (CBS). Patients with nonmotor presentations of CBS or PSP were not included. A subset of patients received amyloid PET imaging with Pittsburgh compound B or florbetapir. Twenty-one of 27 participants (78%) showed no evidence of elevated uptake. Three participants with CBS and 3 with PSP (22%) were amyloid-positive but were included in the study based on analyses showing comparable MRI changes to amyloid-negative individuals (table e-1B at Neurology.org). A validation cohort of patients with PSP (n = 226) with MRI data at baseline and 12-month follow-up was included from the AL-108-23 multicenter trial of davunetide (DAV)16 (PSP-DAV). Thirty age- and sex-matched normal controls (NCs) were recruited from the Frontotemporal Lobar Degeneration Neuroimaging Initiative dataset, a companion study to 4RTNI (http://4rtni-ftldni.ini.usc.edu/), for comparisons with the PSP and CBS groups. NCs had a Mini-Mental State Examination (MMSE)18 score ≥26, a Clinical Dementia Rating19 score of 0, and no subjective cognitive complaints. One hundred two age- and sex-matched NCs were selected based on these criteria from the Frontotemporal Lobar Degeneration Neuroimaging Initiative, the Alzheimer's Disease Neuroimaging Initiative, and UCSF normal aging cohorts for comparisons with the PSP-DAV group.
Standard protocol approvals, registrations, and patient consents.
The study was approved by the UCSF, UCSD, Toronto, and MGH institutional review boards, and written informed consent was obtained from all participants before enrollment.
Clinical evaluations.
4RTNI natural history study.
Participants were evaluated at baseline and 6 and 12 months with clinical rating scales, MRI scans, and other ancillary measurements. The MMSE,18 the Unified Parkinson's Disease Rating Scale,20 the Progressive Supranuclear Palsy Rating Scale (PSPRS),21 the Montreal Cognitive Assessment,22 and the Schwab and England Activities of Daily Living (SEADL)23 scale were administered at each visit, in addition to a neuropsychological battery testing memory, executive function, and other domains (data not shown).
DAV clinical trial.
This was a 52-week clinical trial that included MRI scans at baseline and 52 weeks only, but collected clinical measures more frequently. The primary outcome measures for the clinical trial were the PSPRS21 and SEADL.23
Handling of missing data.
Imaging analyses included some 4RTNI participants who were missing data at either 6 or 12 months. Twenty-two of 33 patients with CBS (67%) and 37 of 55 patients with PSP (67%) had complete data. Since missing data could bias the analyses, additional analyses were performed using only individuals with complete data at all 3 time points, shown in figure e-1.
MRI data acquisition.
Detailed MRI scanning measures are given in the e-Methods.
MRI processing and voxel-based statistical analysis.
MRI data were processed using Statistical Parametric Mapping 12 software (http://www.fil.ion.ucl.ac.uk/spm/), and longitudinal changes in regional brain volume were estimated with the Longitudinal Registration Toolbox.24 Voxel-level differences in gray and white matter at baseline, 6-month follow-up, and 12-month follow-up were assessed using 2-sample t tests, with age, sex, and baseline total intracranial volume included as covariates of no interest, and a threshold of p < 0.05 with family-wise error (FWE) correction was used, except where noted. Total intracranial volume was calculated as the sum of gray matter, white matter, and CSF. Region-of-interest (ROI) volumes were calculated for 136 cortical and basal ganglia ROIs from the Neuromorphometric Atlas (http://neuromorphometrics.com/). Our results discuss 20 of these ROIs selected based on a priori evidence implicating these regions in PSP and CBS,1–14 in addition to 2 control regions (left and right superior temporal gyrus) and 3 brainstem ROIs (midbrain, pons, superior cerebellar peduncle) from a previously validated atlas.25 Further details of MRI processing are given in the e-Methods.
Statistical analysis.
Analyses were performed with Stata/IC 13.1 (2013) (StataCorp, College Station, TX). Hypotheses regarding group differences in demographics, clinical variables, and ROI volumes were tested using Kruskal-Wallis tests, followed by pairwise comparisons using Mann–Whitney U tests. A nominal threshold of p < 0.05 was accepted for all tests. Correlations between clinical and neuroimaging variables were calculated using nonparametric Spearman rank correlations, with a statistical threshold of p < 0.05.
RESULTS
Baseline demographic and clinical data.
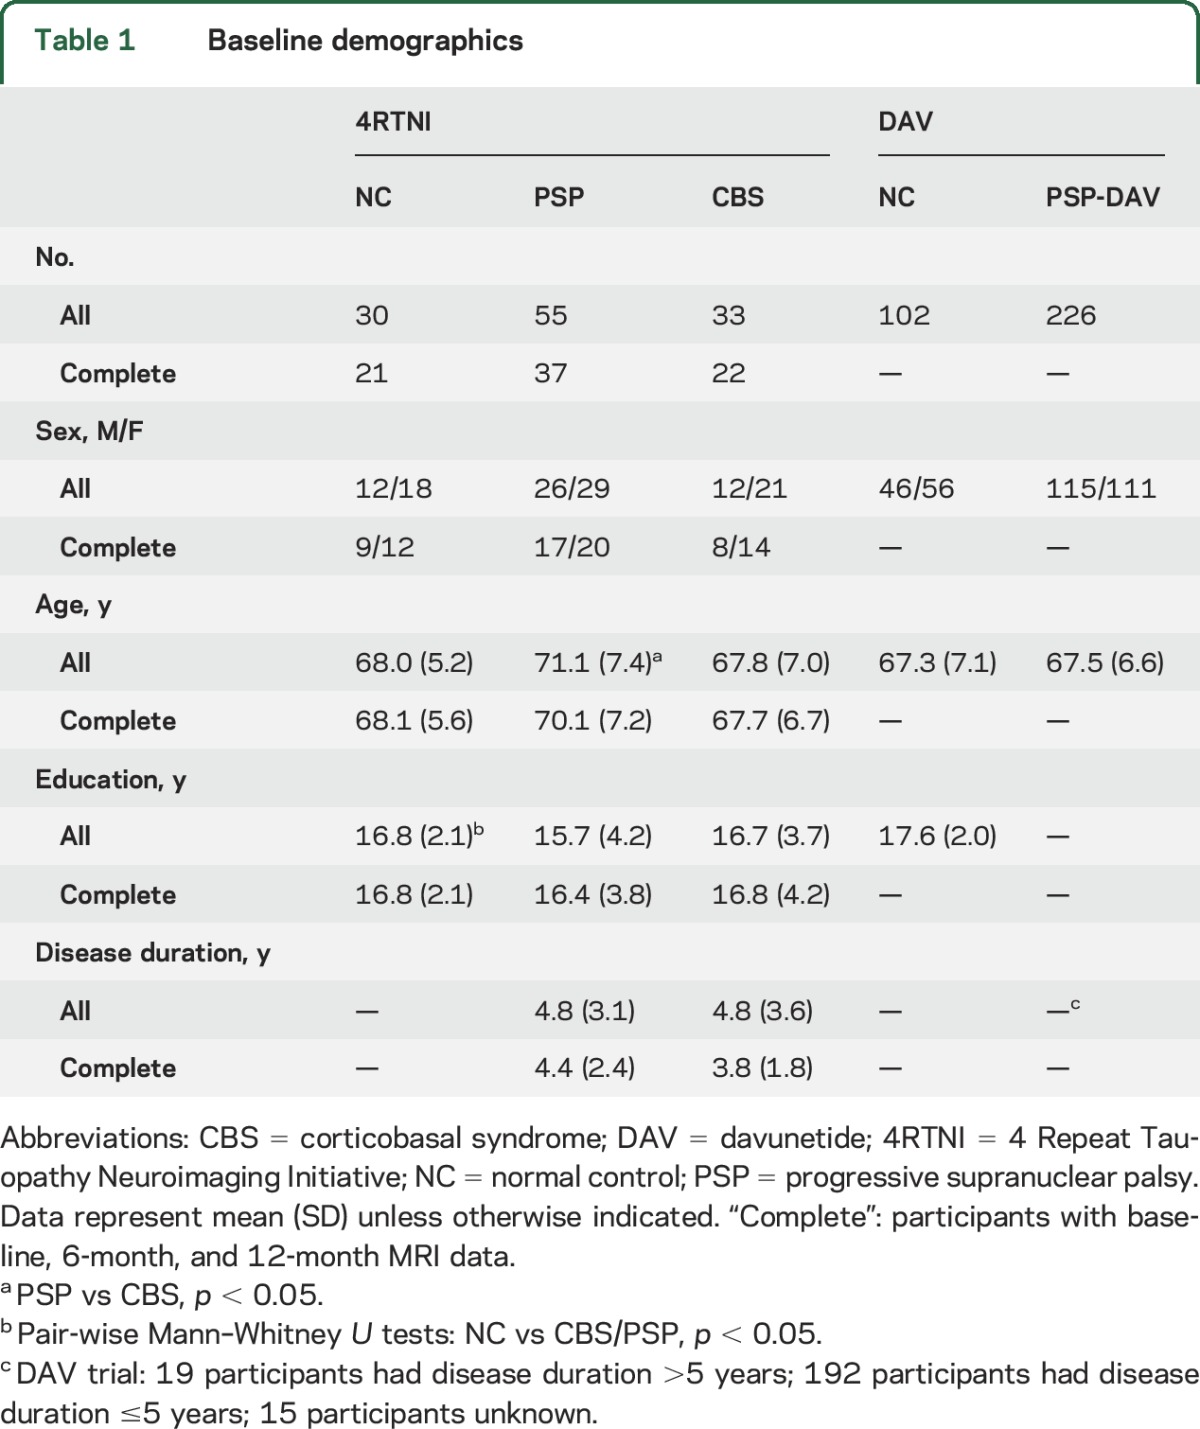
Participant groups were well matched at baseline (table 1). There were more women than men in all groups except PSP-DAV, which had more men than women. The only significant pairwise group differences in age, education, or disease duration were as follows: participants with PSP were slightly older than those with CBS at baseline, and NC participants had higher education than participants with PSP. Interscan intervals were well matched between patient groups, but patients with PSP had shorter intervals than NCs at 6 months. NCs had higher MMSE and Montreal Cognitive Assessment scores compared to PSP and CBS, but there were no differences between the patient groups. Participants with PSP had higher PSPRS scores than participants with CBS at baseline (table e-2).
Table 1.
Baseline demographics
Baseline patterns of brain atrophy.
CBS vs NC.
At baseline, the CBS group showed decreased volume bilaterally in the putamen, precentral gyrus (PreCG), supplementary motor cortex (SMC), and postcentral gyrus, as well as frontoparietal white matter (figure 1A).
Figure 1. Cross-sectional gray and white matter voxel-based morphometry analysis at baseline.

The t maps are results of 2-sample t tests at baseline with age, sex, and total intracranial volume included as covariates of no interest between normal controls and (A) patients with CBS, (B) patients with PSP, and (C) patients with PSP-DAV. All t maps are thresholded at cluster-level family-wise error–corrected p < 0.05. Slices displayed are as follows: coronal (−10, 10), sagittal (−23, 5, 23), and axial (−20, 6, 36). Minimum and maximum t scores are displayed on the color bars. CBS = corticobasal syndrome; DAV = davunetide; GM = gray matter; PSP = progressive supranuclear palsy; WM = white matter.
PSP vs NC.
The most prominent regions of atrophy in PSP at baseline were the midbrain and pons, followed by left dorsal white matter, left thalamus, bilateral cerebellar white matter, and bilateral putamen (figure 1B).
PSP-DAV vs NC.
Because of the larger sample size (n = 226), a more stringent statistical threshold (p < 0.001, FWE) was used to allow resolution of atrophy patterns (figure 1C). The pattern of gray matter atrophy in PSP-DAV was similar to PSP, but the anatomical extent was greater; the midbrain and pons were most affected.
PSP vs CBS.
Since PSP and CBS were part of the same study designed to compare tauopathies, we directly compared baseline atrophy patterns in these groups. CBS had reduced volume compared to PSP in the left parietal lobe, while PSP had less volume than CBS in the midbrain, cerebellar white matter, and posterior medulla (data not shown).
Longitudinal clinical data.
CBS and PSP groups showed decline on the PSPRS and SEADL over 6 and 12 months, and the magnitudes of decline did not differ between groups (figure 2, A and B). The CBS group showed more impairment than the PSP group on the MMSE at 6 months, but both groups performed similarly on all other measures of cognition at each time point (table e-2).
Figure 2. Profile plots of longitudinal clinical and volumetric change.
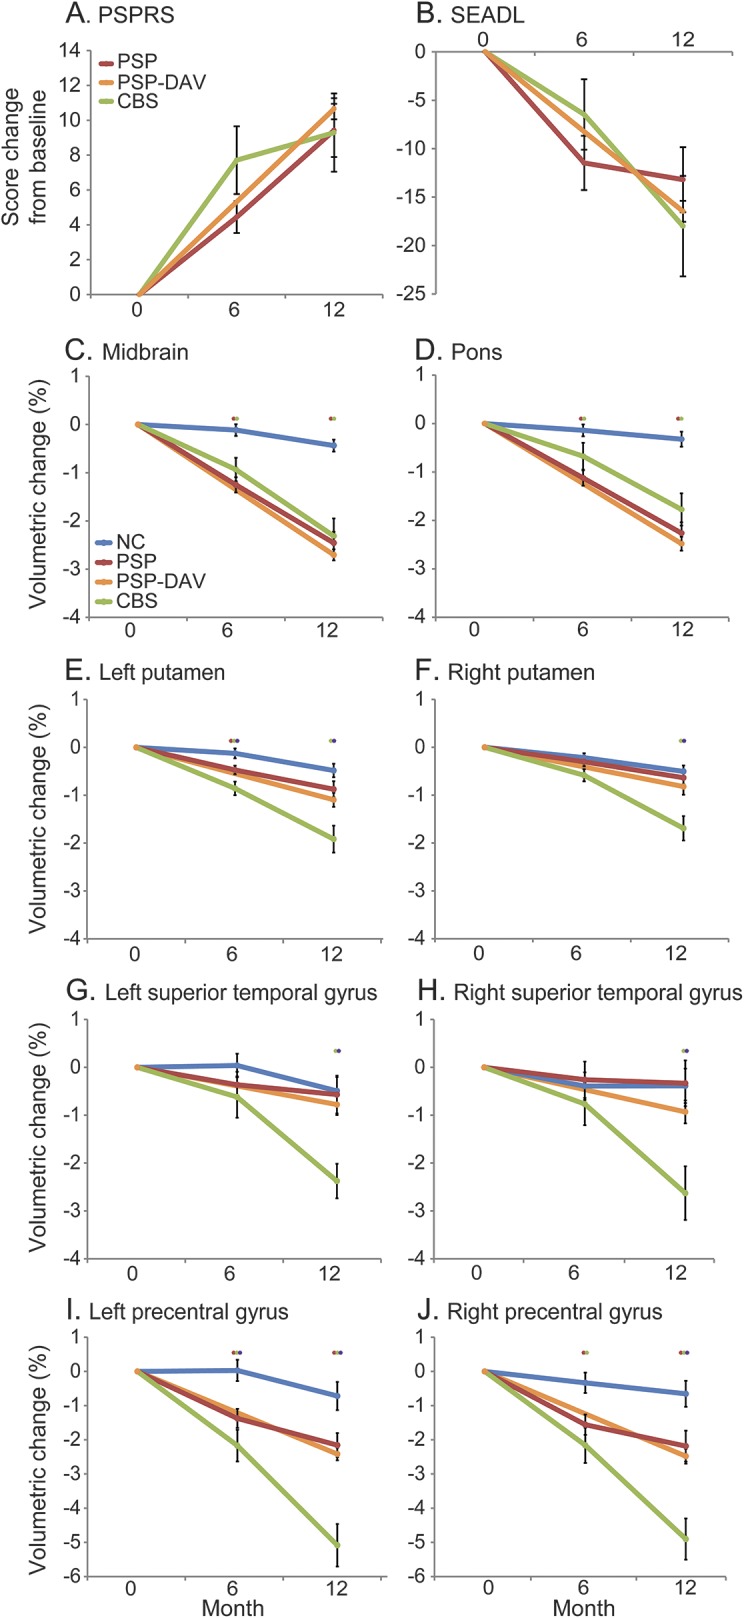
Profile plots show percent change in (A, B) clinical scores and (C–J) volumes in select regions at baseline, 6 months, and 12 months. Red stars indicate significant difference between PSP and NC, green stars significant difference between CBS and NC, and purple stars significant difference between CBS and PSP. Mann–Whitney U tests with p < 0.05 were considered statistically significant. Error bars indicate standard error of the mean. CBS = corticobasal syndrome; DAV = davunetide; NC = normal control; PSP = progressive supranuclear palsy; PSPRS = Progressive Supranuclear Palsy Rating Scale; SEADL = Schwab and England Activities of Daily Living.
Longitudinal patterns of brain atrophy.
CBS vs NC.
When 6-month changes in regional gray and white matter volume were compared between participants with CBS and NCs, there were no regions of significant volume loss at our prespecified threshold of p < 0.05, FWE. However, when using a less stringent threshold (p < 0.001, uncorrected; figure 3A, first row), the most prominent regional volume loss over 6 months occurred in the PreCG and putamen. This was accompanied by adjacent white matter loss. After 1 year, gray matter loss occurred extending from the PreCG to opercular parts of the inferior frontal gyrus, and in the putamen, pallidum, and medial frontal gyrus (figure 3A, second row). White matter loss also occurred in adjacent regions.
Figure 3. Longitudinal gray and white matter voxel-based morphometry analysis at 6 and 12 months.

The t maps are results of 2-sample t tests at 6- and 12-month intervals with age, sex, and total intracranial volume included as covariates of no interest between normal controls and (A) patients with CBS, (B) patients with PSP, and (C) patients with PSP-DAV. All t maps are thresholded at cluster-level FWE-corrected p < 0.05, except for the following: PSP-DAV 12 months, displayed at p < 0.001 FWE-corrected; CBS 6 months, displayed at p < 0.001 uncorrected. Minimum t score is represented by dark blue for GM and orange for WM: CBS 6 months GM and WM, t = 3.2; CBS 12 months GM, t = 4.9; CBS 12 months WM, t = 4.7; PSP 6 months GM, t = 4.7; PSP 6 months WM, t = 4.5; PSP 12 months GM, t = 4.9; PSP 12 months WM, t = 4.6; PSP-DAV 12 months GM, t = 4.4; PSP-DAV 12 months WM, t = 4.2. Maximum t score (light blue for GM; yellow for WM) displayed for all groups is t = 6, except for PSP-DAV, which is t = 8. Slices displayed are as follows: coronal (−10, 17), sagittal (−38, 6, 51), axial (−20, 6, 36). CBS = corticobasal syndrome; DAV = davunetide; FWE = family-wise error; GM = gray matter; PSP = progressive supranuclear palsy; WM = white matter.
PSP vs NC.
Over 6 months, patients with PSP exhibited prominent volume loss in the dorsal midbrain and pontine tegmentum (figure 3B, first row). After 1 year, volume loss extended to encompass the whole midbrain and pons, as well as the bilateral thalamus and cerebellar white matter, including all 3 cerebellar peduncles (figure 3B, second row).
PSP-DAV vs NC.
To confirm our findings in PSP, we examined longitudinal volume loss over 1 year in the PSP-DAV group. Voxel-wise longitudinal changes were considerable, necessitating a more stringent statistical threshold (p < 0.001, FWE) to allow anatomical resolution (figure 3C). Similar to PSP, the most pronounced regional atrophy occurred in the midbrain and pons, but more widespread cortical atrophy of frontoparietal and occipital regions was observed in PSP-DAV. Subcortically, this was accompanied by atrophy of the putamen and pallidum. Extensive white matter loss was observed in the cerebrum, brainstem, and cerebellar peduncles.
PSP vs CBS.
Over 6 and 12 months, there were no significant voxel-wise differences between CBS and PSP in volume loss.
Magnitude of longitudinal volumetric changes in defined ROIs.
To directly compare the magnitude of volume loss in different brain regions, we generated percent volume changes for ROIs previously implicated in other 4R tauopathy studies that were also identified in our whole-brain voxel-based morphometry (VBM) analysis. At 6 months, participants with PSP exhibited midbrain, pontine, and whole brainstem changes that were greater than in NCs (p < 0.001) but similar to those of participants with CBS (figure 2, C and D; table e-1A). At 12 months, participants with PSP exhibited midbrain, pontine, and whole brainstem changes that were again greater than in NCs (p < 0.001) and similar to those of participants with CBS (figure 2, C and D; table e-1A).
In many of the cortical and basal ganglia regions found to have greater atrophy in CBS than in NCs in the baseline and longitudinal VBM analyses, the CBS group also had greater rates of change than PSP and NC groups. At 6 months, the CBS group had greater atrophy rates than PSP and NC groups in the left PreCG, left putamen, and bilateral SMC (figure 2, E–J; table e-1A). At 12 months, the CBS group again had greater atrophy rates than PSP and NC groups in the PreCG, superior temporal gyrus, putamen, SMC, superior parietal lobule, and caudate (figure 2, E–J; table e-1A).
The midbrain/pons volumetric ratio has previously been reported as diagnostically valuable in differentiating CBS from PSP.26–30 At all time points, both PSP and PSP-DAV groups had lower midbrain to pons ratios than NC and CBS groups (figure e-2). Moreover, midbrain/pons ratios within all groups remained stable over 1 year in all groups.
Clinical correlates of longitudinal imaging changes.
Regional volume changes were not correlated with changes in the PSPRS at 6 months; however, over 1 year, volume changes in multiple ROIs were correlated with PSPRS change in patient groups. The strongest correlations were observed when CBS and PSP data were combined. In the combined patient group, annual midbrain (ρ = −0.43, 95% confidence interval [CI] −0.65 to −0.15, p < 0.01; figure 4A), pontine (ρ = −0.38, 95% CI −0.61 to −0.09, p = 0.01; figure 4B), left PreCG (ρ = −0.47, 95% CI −0.68 to −0.20, p < 0.01; figure 4C), and right PreCG (ρ = −0.33, 95% CI −0.58 to −0.04, p = 0.03; figure 4D) atrophy rates were correlated with annual PSPRS changes. Similarly, in PSP-DAV, there were comparable correlations between midbrain (ρ = −0.26, 95% CI −0.38 to −0.13, p < 0.001; figure 4E) and pontine (ρ = −0.33, 95% CI [−0.45 to −0.21], p < 0.001; figure 4F) atrophy rates and the PSPRS.
Figure 4. Clinical correlations.

Scatterplots show correlations in a combined PSP and CBS group between annual change in PSPRS and annual change in (A) midbrain volume, (B) pontine volume, (C) left precentral gyrus volume, and (D) right precentral gyrus volume. In addition, correlations are shown in the PSP-DAV group between annual change in PSPRS and (E) midbrain volume and (F) pontine volume. Spearman ρ values and p values are the result of nonparametric Spearman rank order correlations, with p < 0.05 considered statistically significant. CBS = corticobasal syndrome; CI = confidence interval; DAV = davunetide; PSP = progressive supranuclear palsy; PSPRS = Progressive Supranuclear Palsy Rating Scale.
DISCUSSION
Our results show that progressive brain atrophy associated with both CBS and PSP is measurable on structural MRI scans over 6- and 12-month intervals, and the patterns of longitudinal gray and white matter loss recapitulate the atrophy patterns observed at baseline as compared to controls. At baseline, patients with CBS displayed the most prominent atrophy in dorsal neocortical regions involving both gray and white matter, as well as in basal ganglia structures. In PSP, the most severe baseline atrophy was in the midbrain and pons. Over 6- and 12-month intervals, CBS demonstrated more severe volume loss than PSP in the basal ganglia and cortical structures such as the PreCG. However, atrophy rates for the midbrain and pons were nearly identical across the 2 groups. Moreover, when combining PSP and CBS, volumetric changes in brainstem structures were correlated with clinical disease progression (PSPRS), supporting the validity of these longitudinal imaging measures as biomarkers of progression in 4R tauopathies.
Longitudinal atrophy rate measurements in PSP were highly reproducible in 2 independent multicenter datasets, but there appeared to be a more extensive anatomical distribution of neocortical and basal ganglia volume loss in the PSP-DAV group than in the PSP group (figure 2C). This is most likely the result of greater statistical power in the larger PSP-DAV sample rather than the accidental inclusion of CBS patients. The similarity of ROI-measured atrophy rates between PSP and PSP-DAV supports the conclusion that the larger PSP-DAV sample size enabled detection of smaller cortical changes using VBM maps, which indicate statistical significance but not magnitude. In addition, the midbrain to pons ratio, which has previously been shown to be decreased in PSP,26–30 was nearly identical in the PSP and PSP-DAV groups and smaller than in the CBS or NC group. Future studies of autopsy-confirmed CBD and PSP cases will be necessary to definitively determine the differences in rates of volume loss between these disorders.
The observed annual rates of change in PSP and CBS are consistent with previous studies. A smaller study (n = 5) of CBS12 identified whole-brain atrophy rates similar to the cortical atrophy rates that we observed in CBS. The voxel-based methods used here allowed us to examine regional changes in areas known to be most severely affected by CBD pathology, including the subcortical white matter, basal ganglia, and cortical motor regions31; these regions showed the greatest longitudinal changes in CBS. Another longitudinal imaging study of PSP that included 6-month MRI data along with 12- to 24-month data found similar annual rates of change to our study.32 This consistency across prior studies and our own findings supports the use of specific regions—midbrain, pons, basal ganglia, cortical motor regions, subcortical white matter—in estimating required sample sizes for detecting an effect of an intervention. We calculated the number of patients with CBS, PSP, or CBS and PSP combined needed to detect effects on clinical measures and brain volumes and found that midbrain, pons, and the PSPRS provided the smallest sample size estimates for a 1-year study (table e-3). Despite differences in both clinical and imaging features, these findings suggest that clinical trials of tau-directed therapies combining CBS and PSP are feasible if midbrain and pontine atrophy and the PSPRS are included as outcomes.
One limitation of the present study was the assumption that longitudinal volumetric changes proceed linearly despite the unknown temporal progression of atrophy in 4R tauopathies. In support of this approach, a previous study in PSP32 found that longitudinal atrophy of most brain regions was better fit by linear than nonlinear models. However, this remains an unresolved empirical question that should be addressed in future studies. Furthermore, we included participants in the natural history study who did not complete all 3 time points, which could have influenced results at either interval. To partially address this potential confound, we performed a sensitivity analysis restricting inclusion to only participants with complete data at all 3 time points, and comparable patterns and magnitudes of volume loss were observed (figure e-2). Since the ultimate goal of this work is to develop MRI biomarkers for use in clinical trials that generally last 1 year or less,16,33 the robustness of the measurements regarding missing data supports their utility as outcome measures.
Another limitation of this study was the lack of autopsy-confirmed diagnoses for our patient populations and the inclusion of a small subset of individuals who may have had CBS due to, or concurrent with, Alzheimer pathology based on amyloid PET scan results. Additional analyses were performed to demonstrate that these participants' data did not bias the results (table e-1B). Since the present study was meant to inform clinical trials that, by definition, cannot use autopsy-confirmed diagnoses as enrollment criteria, our inclusion of a small number of amyloid-positive participants reflects an important challenge faced when designing trials of disease-modifying therapies for 4R tauopathies. Lastly, our study included only typical movement disorder presentations of CBS and PSP-Richardson syndrome. Future studies should examine differences in nonmotor variants of CBS and PSP.
Longitudinal volume loss in a combined group of CBS and PSP was correlated with longitudinal change in the PSPRS most prominently in the brainstem, but also in cortical regions, such as the PreCG. These correlations support the face validity of longitudinal volumetric MRI being sensitive to disease progression in 4R tauopathies. Although the PSPRS was not designed to capture disease progression in CBS, the considerable genetic, pathologic, and clinical overlap between PSP and CBS supports the feasibility of combining these rare diseases when designing clinical trials. These results should be further validated using optimized scales for each syndrome when they are developed. As multiple novel therapeutic agents that target the tau protein are now entering clinical trials for PSP, competition for qualified patients able to participate in studies may be a limiting factor in developing treatments.34 Our data suggest that volumetric MRI measurements may be useful outcome measures in both CBS and PSP clinical trials and might facilitate the design of combined 4R tauopathy clinical trials including both syndromes.
Supplementary Material
ACKNOWLEDGMENT
The authors thank all the patients and caregivers who participated in the research.
GLOSSARY
- CBD
corticobasal degeneration
- CBS
corticobasal syndrome
- CI
confidence interval
- DAV
davunetide
- 4R
4 repeat
- 4RTNI
4 Repeat Tauopathy Neuroimaging Initiative
- FWE
family-wise error
- MGH
Massachusetts General Hospital
- MMSE
Mini-Mental State Examination
- NC
normal control
- PreCG
precentral gyrus
- PSP
progressive supranuclear palsy
- PSPRS
Progressive Supranuclear Palsy Rating Scale
- ROI
region of interest
- SEADL
Schwab and England Activities of Daily Living
- SMC
supplementary motor cortex
- UCSD
University of California, San Diego
- UCSF
University of California, San Francisco
- VBM
voxel-based morphometry
Footnotes
Supplemental data at Neurology.org
Contributor Information
Collaborators: AL-108-231 investigators, David Williams, Anne Louise Lafontaine, Connie Marras, Mandar Jog, Michael Panisset, Anthony Lang, Lesley Parker, Alistair J. Stewart, Jean-Christophe Corvol, Jean-Philippe Azulay, Philippe Couratier, Brit Mollenhauer, Stefan Lorenzl, Albert Ludolph, Reiner Benecke, Gunter Hoglinger, Axel Lipp, Heinz Reichmann, Dirk Woitalla, Dennis Chan, Adam Zermansky, David Burn, Andrew Lees, Illana Gozes, Adam Boxer, Bruce L. Miller, Iryna V. Lobach, Erik Roberson, Lawrence Honig, Edward Zamrini, Rajesh Pahwa, Yvette Bordelon, Erika Driver-Dunkley, Stephanie Lessig, Mark Lew, Kyle Womack, Brad Boeve, Joseph Ferrara, Argyle Hillis, Daniel Kaufer, Rajeev Kumar, Tao Xie, Steven Gunzler, Theresa Zesiewicz, Praveen Dayalu, Lawrence Golbe, Murray Grossman, Joseph Jankovic, Scott McGinnis, Anthony Santiago, Paul Tuite, Stuart Isaacson, Julie Leegwater-Kim, Irene Litvan, David S. Knopman, Lon S. Schneider, Rachelle S. Doody, Mary Koestler, Clifford R. Jack, Jr, Viviana Van Deerlin, Christopher Randolph, Steve Whitaker, Joe Hirman, Michael Gold, and Bruce H. Morimoto
AUTHOR CONTRIBUTIONS
Mr. Dutt is first author and contributed by assisting with study concept and design, analyzing/interpreting the data, conducting the statistical analyses, and drafting/revising the manuscript. Dr. Binney is an author and contributed by analyzing/interpreting the data and drafting/revising the manuscript. Dr. Heuer is an author and contributed by analyzing/interpreting the data and drafting/revising the manuscript. Mr. Luong is an author and contributed by coordinating the study, analyzing/interpreting the data, and drafting/revising the manuscript. Mr. Attygalle is an author and contributed by analyzing/interpreting the data and drafting/revising the manuscript. Ms. Bhatt is an author and contributed by analyzing/interpreting the data and drafting/revising the manuscript. Mr. Marx is an author and contributed by analyzing/interpreting the data and drafting/revising the manuscript. Mr. Elofson is an author and contributed by analyzing/interpreting the data and drafting/revising the manuscript. Dr. Tartaglia is an author and contributed by assisting with data collection/study coordination and revising the manuscript. Dr. Litvan is an author and contributed by assisting with data collection/study coordination and revising the manuscript. Dr. McGinnis is an author and contributed by assisting with data collection/study coordination and revising the manuscript. Dr. Dickerson is an author and contributed by assisting with data collection/study coordination and revising the manuscript. Dr. Kornak is an author and contributed by assisting with statistical analyses and revising the manuscript. Dr. Waltzman is an author and contributed by analyzing/interpreting the data and drafting/revising the manuscript. Ms. Voltarelli is an author and contributed by coordinating the study, analyzing/interpreting the data, and drafting/revising the manuscript. Dr. Schuff is an author and contributed by revising the manuscript. Dr. Rabinovici is an author and contributed by revising the manuscript. Dr. Kramer is an author and contributed by drafting/revising the manuscript. Dr. Jack is an author and contributed by assisting with data collection/study coordination and revising the manuscript. Dr. Miller is an author and contributed by revising the manuscript. Dr. Rosen is an author and contributed by assisting with data collection/study coordination and revising the manuscript. Dr. Boxer is the senior and corresponding author and contributed by generating the study concept/design, supervising the study, and drafting/revising the manuscript.
STUDY FUNDING
This study was supported by NIH grants R01AG038791, U54NS092089, P01AG019724, and P50AG023501, Corticobasal Degeneration Solutions, and the Tau Research Consortium.
DISCLOSURE
S. Dutt, R. Binney, H. Heuer, P. Luong, S. Attygalle, P. Bhatt, G. Marx, J. Elofson, and M. Tartaglia report no disclosures relevant to the manuscript. I. Litvan receives grant support from the NIH/NIA/NINDS, Parkinson Study Group, and Michael J. Fox Foundation. Dr. Litvan is on the advisory board for Pfizer/Michael J. Fox Foundation and Biotie/Michael J. Fox Foundation studies and was a consultant for Lundbeck and Cynapsus. She also participates in clinical studies by AVID Pharmaceuticals, C2N Diagnostics, and Bristol-Myers Squibb. S. McGinnis, B. Dickerson, J. Kornak, D. Waltzman, L. Voltarelli, and N. Schuff report no disclosures relevant to the manuscript. G. Rabinovici has received research support from Avid Radiopharmaceuticals, Eli Lilly, GE Healthcare, and Piramal Imaging. He also consults for or receives speaking fees from Piramal, GE Healthcare, Lundbeck, and Medscape. J. Kramer reports no disclosures relevant to the manuscript. C. Jack has provided consulting services for Eli Lilly and owns stock in Johnson & Johnson. He receives research funding from the NIH (R01-AG011378, RO1 AG041851, U01-AG06786, U01-AG024904, R01 AG37551, R01AG043392) and the Alexander Family Alzheimer's Disease Research Professorship of the Mayo Foundation. B. Miller receives grant support from the NIH/NIA and the Centers for Medicare & Medicaid Services (CMS) as grants for the Memory and Aging Center. As an additional disclosure, Dr. Miller serves as medical director for the John Douglas French Foundation; scientific director for the Tau Consortium; director/medical advisory board of the Larry L. Hillblom Foundation; and scientific advisory board member for the National Institute for Health Research Cambridge Biomedical Research Centre and its subunit, the Biomedical Research Unit in Dementia (UK). H. Rosen reports no disclosures relevant to the manuscript. A. Boxer receives research support from the NIH, the Tau Consortium, the Bluefield Project to Cure FTD, Corticobasal Degeneration Solutions, and the following companies: Avid, Biogen, Bristol-Myers Squibb, C2N Diagnostics, Cortice Biosciences, Eli Lilly, Forum Pharmaceuticals, Genentech, and TauRx. He has served as a consultant for AbbVie, Asceneuron, iPierian, Ionis, Janssen, and Merck. He has stock/options in Alector and Delos. Go to Neurology.org for full disclosures.
REFERENCES
- 1.Williams DR, Lees AJ. Progressive supranuclear palsy: clinicopathological concepts and diagnostic challenges. Lancet Neurol 2009;8:270–279. [DOI] [PubMed] [Google Scholar]
- 2.Boxer AL, Geschwind MD, Belfor N, et al. Patterns of brain atrophy that differentiate corticobasal degeneration syndrome from progressive supranuclear palsy. Arch Neurol 2006;63:81–86. [DOI] [PubMed] [Google Scholar]
- 3.Groschel K, Hauser TK, Luft A, et al. Magnetic resonance imaging–based volumetry differentiates progressive supranuclear palsy from corticobasal degeneration. Neuroimage 2004;21:714–724. [DOI] [PubMed] [Google Scholar]
- 4.Groschel K, Kastrup A, Litvan I, Schulz JB. Penguins and hummingbirds: midbrain atrophy in progressive supranuclear palsy. Neurology 2006;66:949–950. [DOI] [PubMed] [Google Scholar]
- 5.Soliveri P, Monza D, Paridi D, et al. Cognitive and magnetic resonance imaging aspects of corticobasal degeneration and progressive supranuclear palsy. Neurology 1999;53:502–507. [DOI] [PubMed] [Google Scholar]
- 6.Whitwell JL, Jack CR Jr, Parisi JE, et al. Midbrain atrophy is not a biomarker of progressive supranuclear palsy pathology. Eur J Neurol 2013;20:1417–1422. [DOI] [PMC free article] [PubMed] [Google Scholar]
- 7.Josephs KA, Whitwell JL, Dickson DW, et al. Voxel-based morphometry in autopsy proven PSP and CBD. Neurobiol Aging 2008;29:280–289. [DOI] [PMC free article] [PubMed] [Google Scholar]
- 8.Josephs KA, Whitwell JL, Boeve BF, et al. Anatomical differences between CBS-corticobasal degeneration and CBS-Alzheimer's disease. Mov Disord 2010;25:1246–1252. [DOI] [PMC free article] [PubMed] [Google Scholar]
- 9.Whitwell JL, Jack CR Jr, Boeve BF, et al. Imaging correlates of pathology in corticobasal syndrome. Neurology 2010;75:1879–1887. [DOI] [PMC free article] [PubMed] [Google Scholar]
- 10.Lee SE, Rabinovici GD, Mayo MC, et al. Clinicopathological correlations in corticobasal degeneration. Ann Neurol 2011;70:327–340. [DOI] [PMC free article] [PubMed] [Google Scholar]
- 11.Paviour DC, Price SL, Jahanshahi M, Lees AJ, Fox NC. Longitudinal MRI in progressive supranuclear palsy and multiple system atrophy: rates and regions of atrophy. Brain 2006;129:1040–1049. [DOI] [PubMed] [Google Scholar]
- 12.Whitwell JL, Jack CR Jr, Parisi JE, et al. Rates of cerebral atrophy differ in different degenerative pathologies. Brain 2007;130:1148–1158. [DOI] [PMC free article] [PubMed] [Google Scholar]
- 13.Josephs KA, Whitwell JL, Boeve BF, et al. Rates of cerebral atrophy in autopsy-confirmed progressive supranuclear palsy. Ann Neurol 2006;59:200–203. [DOI] [PubMed] [Google Scholar]
- 14.Whitwell JL, Xu J, Mandrekar JN, Gunter JL, Jack CR Jr, Josephs KA. Rates of brain atrophy and clinical decline over 6- and 12-month intervals in PSP: determining sample size for treatment trials. Parkinsonism Relat Disord 2011;18:252–256. [DOI] [PMC free article] [PubMed] [Google Scholar]
- 15.Litvan I, Agid Y, Calne D, et al. Clinical research criteria for the diagnosis of progressive supranuclear palsy (Steele-Richardson-Olszewski syndrome): report of the NINDS-SPSP international workshop. Neurology 1996;47:1–9. [DOI] [PubMed] [Google Scholar]
- 16.Boxer AL, Lang AE, Grossman M, et al. Davunetide in patients with progressive supranuclear palsy: a randomised, double-blind, placebo-controlled phase 2/3 trial. Lancet Neurol 2014;13:676–685. [DOI] [PMC free article] [PubMed] [Google Scholar]
- 17.Armstrong MJ, Litvan I, Lang AE, et al. Criteria for the diagnosis of corticobasal degeneration. Neurology 2013;80:496–503. [DOI] [PMC free article] [PubMed] [Google Scholar]
- 18.Folstein MF, Folstein SE, McHugh PR. “Mini-Mental State”: a practical method for grading the cognitive state of patients for the clinician. J Psychiatr Res 1975;12:189–198. [DOI] [PubMed] [Google Scholar]
- 19.Morris JC. The Clinical Dementia Rating (CDR): current version and scoring rules. Neurology 1993;43:2412–2414. [DOI] [PubMed] [Google Scholar]
- 20.Fahn S, Marsden CD, Calne DB, Goldstein M, editors. Recent Developments in Parkinson's Disease, Vol 2. Florham Park, NJ: Macmillan Health Care Information; 1987. [Google Scholar]
- 21.Golbe LI, Ohman-Strickland PA. A clinical rating scale for progressive supranuclear palsy. Brain 2007;130:1552–1565. [DOI] [PubMed] [Google Scholar]
- 22.Nasreddine ZS, Phillips NA, Bedirian V, et al. The Montreal Cognitive Assessment, MoCA: a brief screening tool for mild cognitive impairment. J Am Geriatr Soc 2005;53:695–699. [DOI] [PubMed] [Google Scholar]
- 23.Schwab RS, England AC. Projection technique for evaluating surgery in Parkinson's disease. In: Billingham FH, Donaldson MC, editors. Third Symposium on Parkinson's Disease. Edinburgh, Scotland: Churchill Livingstone; 1969:152–157. [Google Scholar]
- 24.Ashburner J, Ridgway GR. Symmetric diffeomorphic modeling of longitudinal structural MRI. Front Neurosci 2012;6:197. [DOI] [PMC free article] [PubMed] [Google Scholar]
- 25.Iglesias JE, Van Leemput K, Bhatt P, et al. Bayesian segmentation of brainstem structures in MRI. Neuroimage 2015;113:184–195. [DOI] [PMC free article] [PubMed] [Google Scholar]
- 26.Oba H, Yagishita A, Terada H, et al. New and reliable MRI diagnosis for progressive supranuclear palsy. Neurology 2005;64:2050–2055. [DOI] [PubMed] [Google Scholar]
- 27.Hussl A, Mahlknecht P, Scherfler C, et al. Diagnostic accuracy of the magnetic resonance parkinsonism index and the midbrain-to-pontine area ratio to differentiate progressive supranuclear palsy from Parkinson's disease and the Parkinson variant of multiple system atrophy. Mov Disord 2010;25:2444–2449. [DOI] [PubMed] [Google Scholar]
- 28.Longoni G, Agosta F, Kostić VS, et al. MRI measurements of brainstem structures in patients with Richardson's syndrome, progressive supranuclear palsy-parkinsonism, and Parkinson's disease. Mov Disord 2011;26:247–255. [DOI] [PubMed] [Google Scholar]
- 29.Massey LA, Jäger HR, Paviour DC, et al. The midbrain to pons ratio: a simple and specific MRI sign of progressive supranuclear palsy. Neurology 2013;80:1856–1861. [DOI] [PMC free article] [PubMed] [Google Scholar]
- 30.Kaasinen V, Kangassalo N, Gardberg M, et al. Midbrain-to-pons ratio in autopsy-confirmed progressive supranuclear palsy: replication in an independent cohort. Neurol Sci 2015;36:1251–1253. [DOI] [PubMed] [Google Scholar]
- 31.Dickson DW, Bergeron C, Chin SS, et al. Office of Rare Diseases neuropathologic criteria for corticobasal degeneration. J Neuropathol Exp Neurol 2002;61:935–946. [DOI] [PubMed] [Google Scholar]
- 32.Josephs KA, Xia R, Mandrekar J, et al. Modeling trajectories of regional volume loss in progressive supranuclear palsy. Mov Disord 2013;28:1117–1124. [DOI] [PubMed] [Google Scholar]
- 33.Tolosa E, Litvan I, Hoglinger GU, et al. A phase 2 trial of the GSK-3 inhibitor tideglusib in progressive supranuclear palsy. Mov Disord 2014;4:470–478. [DOI] [PubMed] [Google Scholar]
- 34.Boxer AL, Gold M, Huey E, et al. The advantages of frontotemporal degeneration drug development (part 2 of frontotemporal degeneration: the next therapeutic frontier). Alzheimers Dement 2013;9:189–198. [DOI] [PMC free article] [PubMed] [Google Scholar]
Associated Data
This section collects any data citations, data availability statements, or supplementary materials included in this article.