

Abstract
The hereditary kidney stone disease primary hyperoxaluria type 1 (PH1) is caused by a functional deficiency of the liver-specific, peroxisomal, pyridoxal-phosphate-dependent enzyme, alanine:glyoxylate aminotransferase (AGT). One third of PH1 patients, particularly those expressing the p.[(Pro11Leu; Gly170Arg; Ile340Met)] mutant allele, respond clinically to pharmacological doses of pyridoxine. To gain further insight into the metabolic effects of AGT dysfunction in PH1 and the effect of pyridoxine, we established an “indirect” glycolate cytotoxicity assay using CHO cells expressing glycolate oxidase (GO) and various normal and mutant forms of AGT. In cells expressing GO the great majority of glycolate was converted to oxalate and glyoxylate, with the latter causing the greater decrease in cell survival. Co-expression of normal AGTs and some, but not all, mutant AGT variants partially counteracted this cytotoxicity and led to decreased synthesis of oxalate and glyoxylate. Increasing the extracellular pyridoxine up to 0.3 μM led to an increased metabolic effectiveness of normal AGTs and the AGT-Gly170Arg variant. The increased survival seen with AGT-Gly170Arg was paralleled by a 40% decrease in oxalate and glyoxylate levels. These data support the suggestion that the effectiveness of pharmacological doses of pyridoxine results from an improved metabolic effectiveness of AGT; that is the increased rate of transamination of glyoxylate to glycine. The indirect glycolate toxicity assay used in the present study has potential to be used in cell-based drug screening protocols to identify chemotherapeutics that might enhance or decrease the activity and metabolic effectiveness of AGT and GO, respectively, and be useful in the treatment of PH1.
Keywords: Primary hyperoxaluria, Alanine:glyoxylate aminotransferase, Kidney stones, Pyridoxine, Oxalate, Glyoxylate
1. Introduction
The hereditary kidney stone disease primary hyperoxaluria type 1 (PH1, OMIM 259900) is caused by a functional deficiency of the liver-specific peroxisomal pyridoxal-phosphate-dependent enzyme alanine:glyoxylate aminotransferase (AGT) [1]. Failure to transaminate intraperoxisomal glyoxylate to glycine in PH1 leads to its oxidation by cytosolic lactate dehydrogenase (LDH) to the metabolic end-product oxalate. The elevated synthesis and excretion of oxalate can lead to the deposition of insoluble calcium oxalate in the kidney and urinary tract, and eventually renal failure. More than 170 mutations have been identified in the gene encoding AGT (i.e. AGXT), which lead to a wide variety of molecular and cellular phenotypes, including accelerated AGT degradation, aggregation, loss of catalytic activity, and peroxisome-to-mitochondrion mistargeting [2–4].
For patients with PH1, pyridoxine remains the only pharmacological treatment [5–8] although other options are currently being investigated [8–12]. Despite having been used for decades in PH1, there are still many questions regarding the effect of pyridoxine in PH1. By definition, pyridoxine responsiveness is defined as a minimum 30% decrease in urinary oxalate after a 3 month trial at an optimal dose [8]. Some patients may even normalize their urinary oxalate with pyridoxine [13–15]. A few mutations have been positively linked with pyridoxine responsiveness but represent only a third of PH1 patients [3,16–19]. The first to be identified and most responsive to pyridoxine is the p.[(Pro11Leu; Gly170Arg; Ile340Met)] found in ~30% of PH1 patients [13,16]. Two other mutations, the p.[(Pro11Leu; Phe152Ile; Ile340Met)] and p.[(Pro11Leu; Ile244Thr; Ile340Met)], have also been shown to be potentially B6 responsive [13,14,16,20–24]. However, even within these groups, not all patients respond with a sufficient decrease in urinary oxalate. It is well known that pyridoxine is metabolized to pyridoxal-5′-phosphate (PLP), the essential cofactor of AGT. Depending on the particular AGT mutation, PLP can function as a prosthetic group and/or a chemical chaperone [21–23,25–27]. In a CHO cell-based system expressing various normal and mutant forms of AGT, extracellular pyridoxine, via intracellular PLP, was shown to lead to increased expression of immunoreactive AGT, increased catalytic activity and increased peroxisomal targeting [23]. These effects of pyridoxine are presumed, without direct evidence as yet, to result in an increased metabolic effectiveness of AGT, that is, an increased efficiency in the transamination of peroxisomal glyoxylate to glycine, thus limiting net glyoxylate and oxalate synthesis (Fig. 1) and decreasing oxalate urinary excretion [8].
Fig. 1.

Compartmentalization of enzymes and the flux of metabolites in CHO cells stably transfected with GO and AGT. AGT: normal alanine:glyoxylate aminotransferase targeted to peroxisomes; AGT*: mutant AGT mistargeted to mitochondria; GO: glycolate oxidase; LDH: lactate dehydrogenase; ECF: extracellular fluid. Untransformed CHO cells express LDH but not AGT or GO. Solid arrows indicate metabolic pathways; dashed arrows indicate transport pathways.
The aim of the present study was to determine the effect of pyridoxine on cell viability and glyoxylate/oxalate synthesis in a previously-established CHO cell cytotoxicity assay in which cells were stably transformed with glycolate oxidase (GO) and various normal and mutant forms of AGT [23,28,29]. Our results show that normal AGTs, as well as some PH1 mutant forms of AGT, improve cell survival after the addition of glycolate by decreasing the synthesis of glyoxylate and oxalate. In addition, the pyridoxine-responsiveness of PH1 patients expressing the p.[(Pro11Leu; Gly170Arg; Ile340Met)] variant is paralleled in our cell-based system by a decrease in glyoxylate and oxalate synthesis. The cell-based “indirect” glycolate cytotoxicity assay used in the present study has potential as a system for screening drugs that might increase the activity and enhance the metabolic effectiveness of AGT [30].
2. Experimental procedures
2.1. Expression constructs and cell lines
The full-length normal human GO, AGT cDNAs (AGT-MA and AGT-mi) and mutant human AGT cDNAs (AGT-170, AGT-152, AGT-244, AGT-41) were generated as described previously. [28,29,31–33] and subcloned in the mammalian expression vectors pcDNA3.1(-)zeo for GO and pcDNA3.1(+)neo for AGT (both Invitrogen, Carlsbad, CA, USA). The description of the encoded AGT enzymes is listed in Table 1.
Table 1.
Characteristics of CHO cell lines and AGT variants.
| CHO cell lines | GO | Plasmid constructs AGT [amino acid changes compared to AGT-MA] | AGT activity in CHO cellsd | Subcellular localization of immunoreactive AGT in CHO cells | Effects of B6 vitamers on AGT |
|---|---|---|---|---|---|
| CHO wt | − | − | ND | None | |
| CHO GO | + | − | ND | None | |
| CHO GO AGT-MA | + | AGT-MAa | [100] | P | +f |
| CHO GO AGT-mi | + | AGT-mib [P11L, I340M] | 63% | Pe | +f |
| CHO GO AGT-41 | + | AGT-41c [P11L, G41R, I340M] | 2% | P + m | +f |
| CHO GO AGT-152 | + | AGT-152c [P11L, F152I, I340M] | 18% | M + p | +f,g,h |
| CHO GO AGT-170 | + | AGT-170c [P11L, G170R, I340M] | 32% | M + p | +f,g,h |
| CHO GO AGT-244 | + | AGT-244c [P11L, I244T, I340M] | 20% | P + m | +f |
Normal AGT encoded by the major AGXT allele.
Normal AGT encoded by the minor AGXT allele.
Mutant AGTs found in PH1 all on the background of the minor allele.
AGT enzyme catalytic assay performed with 150 μM pyridoxal-5′-phosphate.
Peroxisomal distribution on immunofluorescence, some mitochondrial staining detected by immunoelectron microscopy [29].
Stabilizing effect on purified AGT.
Prosthetic group and chaperone effect on AGT in stably transfected CHO cells.
2.2. Cell lines, transformation and culture
The establishment and characterization of transfected CHO cell lines expressing GO and AGT variants was reported previously [23,28,29]. Briefly, a CHO cell expressing GO was initially created by stable transformation. The same CHO GO cell line was then used to create double transformant cell lines expressing GO and normal or mutant AGTs (Table 1). Transfected and wild-type CHO cells were cultured in Ham’s F12 medium supplemented with 10% fetal bovine serum, as described before [28,29]. Expression of AGT and GO was maintained by adding Geneticin (800 μg/ml) and Zeocin (400 μg/ml), respectively, to the culture medium. The levels of expression of AGT and GO in the transfected cell lines remained stable over a period of at least 3 months. All cell culture reagents were from Invitrogen (Carlsbad, CA, USA) or Corning (NY, USA).
2.3. Pyridoxine and B6 vitamers
The pyridoxine concentration in cells was varied by growing cells for a minimum of four weeks in a medium containing the appropriate pyridoxine concentrations as reported elsewhere [23]. The standard pyridoxine concentration (0.3 μM) was defined by culture in Ham’s F12 and normal FBS. Lower pyridoxine concentrations were achieved by culture in a specialty Ham’s F12 medium without B6 vitamers and either supplemented with normal FBS (defined as < 0.3 μM pyridoxine and referred to as “low” concentration) or dialyzed FBS (defined as nominal 0 μM pyridoxine) (Invitrogen, Carlsbad, CA, USA). The higher pyridoxine concentrations (defined as 50 μM and 250 μM pyridoxine) were achieved by adding pyridoxine hydrochloride (Sigma-Aldrich, St Louis, MO, USA) to the culture.
2.4. Cell-based indirect glycolate toxicity assay
Cells were plated at a density needed to reach sub-confluency at the endpoint. Glycolate was added the day after plating to final concentrations of 0 to 1500 μM in a culture medium and cells were grown under standard conditions (without Geneticin or Zeocin) for 24 to 48 h before analysis. Depending on the experiment, the toxicity was assessed either by measuring cell viability with a CCK-8 assay at 24 h (Dojindo Molecular Technologies, Japan) or by the number of cells surviving at 48 h for increased discrimination between cell lines and conditions using Scepter cell counter (Millipore, Billerica, MA, USA) with size gated between 9.675 and 19.05 μm. Results were normalized to that of controls grown with equal pyridoxine concentrations, without glycolate. Glycolic acid, glyoxylic acid, glycine and oxalate stock solutions were buffered to pH 7.4 with NaOH and filter-sterilized (all from Sigma-Aldrich, St Louis, MO, USA).
2.5. Catalytic activity
AGT and GO activities in cell lysates were measured by a spectrophotometric method as published previously [28,34,35]. The AGT assay was carried out in the presence of 150 μM PLP in the assay.
2.6. Measurement of extracellular metabolites
Cells were seeded at 4 × 10⁵ cells/well in 6 well-plates and incubated with glycolate (0 to 250 μM) for 24 h, so that typical viability with glycolate at 24 h remained >80%. For oxalate and glycolate measurements, the media were collected and filtered with 10 mM HCl-washed 3 K MWCO filters (Millipore, Billerica, MA, USA). The filtrates were acidified to 60 mM with 2 M HCl before being analyzed by ion chromatography (IC) for oxalate and ion chromatography coupled with mass spectrometry (IC-MS) for glycolate. Oxalate was determined by IC (Dionex Corp., Thermo Scientific, Sunnyvale, CA, USA) with suppressed conductivity detection (AERS 500) using an IonPac 6 μm AS22 2 × 250 mm ion exchange column and mobile phase of 30 mM tetraborate at 0.3 ml/min and room temperature [36]. Glycolate was determined by 13C2-glycolate isotope dilution using IC-MS (Thermo Fisher Scientific Inc.). The IC equipment consisted of a Dionex™ ICS-5000 system with an AS15, 2 × 150 mm, anion exchange column at a controlled temperature of 30 °C and a Dionex™ERS™500 anion electrolytically regenerated suppressor. A gradient of KOH from 3 to 80 mM over 30 min at a flow rate of 0.3 ml min−1 was used to separate sample anions. The mass spectrometer (MSQ-PLUS) was operated in ESI negative mode, needle voltage 1.5 V, cone voltage 30 V, and 450 °C, and column eluent was mixed with 50% acetonitrile at 0.30 ml/min using a zero dead volume mixing tee prior to entry into the MSQ. Samples were diluted in the same amount of 13C2-glycolate and selected-ion monitoring (SIM) at the following mass/charge ratios, 12C2-glycolate (SIM75) and 13C2-glycolate (SIM77), were then used to quantify glycolate. Glyoxylate was quantified in cell culture media perchloric acid (0.5 M) extracts by reversed phase high pressure liquid chromatography following derivatization with 30 mM phenylhydrazine for 15 min at room temperature in the dark. A Kinetex 100 * 4.6 mm, 2.6 μm, C18, 100 Ǻ column (Phenomenex Inc., Torrance, CA) was used at a flow rate of 0.4 ml/min, 20 °C, with UV detection at 320 nm to separate and measure the phenylhydrazone products. The mobile phase contained 0.1 M ammonium acetate, 4% acetonitrile and 4% methanol.
2.7. Reactive oxygen species (ROS) production
For intracellular ROS production, cells cultured in white walled 96-well plates were loaded with 10 μM CM-H2DCFDA (Invitrogen, Carlsbad, CA, USA) in HBSS for 30 min. After washing with HBSS, cells were incubated with glycolate in a serum-free medium without phenol red. Fluorescence intensity was measured on a microplate reader (Synergy HT, Biotek, Winooski, VT, USA) at 37 °C for 4 h. Results were expressed as relative fluorescence intensities.
2.8. Statistical analyses
Results are expressed as mean ± SD, unless otherwise specified. Statistical significance was calculated with one or two-way ANOVA to take into account the different cell lines and 2-carbon metabolites concentrations. To compare the effect of pyridoxine on metabolite production, Student’s t-test was used. p values ≤ 0.05 were considered statistically significant.
3. Results
3.1. Characterization of the system: expression of GO and AGT
The expression of immunoreactive AGT and GO examined by immunofluorescence and the AGT catalytic activities have been previously reported [23,29]. All AGT variants had lower catalytic activities compared with AGT-MA (p < 0.001) and AGT-41 was inactive. There was no statistical difference in the catalytic activity of GO in the cell lines expressing this enzyme (Fig. 2) (mean GO: 314 ± 120 nmol/min/mg protein).
Fig. 2.

GO and AGT catalytic activities in stably transfected CHO cell lines. Units: GO nmol substrate/min/mg protein (black boxes); AGT μmol pyruvate/h/mg protein (gray histograms). The results of the AGT assay were published in part previously [29]. The reference ranges for GO and AGT activity in the human liver are 13.2–101.6, and 19.1–47.9, respectively [34,43]. Results (n = 5–9) are expressed as mean ± SEM. GO catalytic activities in different cell lines were compared to the GO activity in CHO GO AGT-MA cells (***p < 0.001).
3.2. Glycolate is only cytotoxic after metabolic conversion to glyoxylate
Different metabolites belonging to the glyoxylate–glyoxylate–oxalate pathway were tested for their toxic effect on various CHO cell lines expressing GO and AGT (Fig. 3.). Both glyoxylate (at 250 μM and above, Fig. 3A) and oxalate (at 1 mM and above, Fig. 3C) were toxic to both wild-type and GO-expressing cells. On the other hand, glycolate was only toxic in cells expressing GO (Fig. 3B). The cytotoxicity of glyoxylate and glycolate, but not oxalate, in GO expressing cells could be partially counteracted by co-expression of AGT-MA.
Fig. 3.

Influence of GO and AGT on cell survival after incubation with 2-carbon metabolites. CHO wt (white), CHO GO (black) and CHO GO AGT-MA (gray) cells were exposed to increasing concentrations (0–1 mM) of either glyoxylate (A), glycolate (B) or oxalate (C) for 1 day. Cell viability was normalized against untreated controls and expressed as mean% of the control (+SD; n ≥ 3). Significant differences are marked as follows: $: AGT-MA vs WT; #: AGT-MA vs GO; *: GO vs WT ($$$/###/***p < 0.001; #/*p < 0.05).
3.3. Glycolate indirect cytotoxicity depends on the activity of normal and mutant AGTs
The dose–response to glycolate incubation at 0.3 μM pyridoxine was studied for all CHO cell lines (Fig. 4). Cell lines expressing functional AGT variants showed intermediate survival curves compared to the control cell lines (CHO wt and CHO GO) or the inactive AGT variant (AGT-41) (Fig. 4). The glycolate concentrations corresponding to a 50% cell survival (IC50) were higher for cells expressing normal AGT variants (AGT-MA and AGT-mi) compared to PH1 mutants and ranged from 739 μM for AGT-MA to 146 μM for AGT-41.
Fig. 4.

Impact of AGT variants on cell survival after incubation with varying concentrations of glycolate. CHO wt cells (black △) and CHO cells stably expressing GO (orange ○) ± different AGT variants (AGT-MA: blue □, AGT-mi: green ◇, AGT-170: red ▲, AGT-152: purple ●, AGT-244: violet ■, AGT-41: yellow ◆) were incubated for 2 days with glycolate (0 to 1500 μM). Cell survival was normalized against untreated controls. Data expressed as mean ± SEM (n ≥ 2). Cell survival curves were fitted with Graphpad Prism 6.0 software.
3.4. Functional AGT reduces production of glyoxylate and oxalate from glycolate in cells expressing GO
The decrease in viability seen after glycolate incubation of cells may result from the formation of glyoxylate and oxalate. Glycolate added to the cell culture media of cells expressing GO resulted in proportional increases in media oxalate. After 24 h incubation with 250 μM glycolate, almost all the glycolate (90%) was metabolized and 60–80% could be recovered as oxalate. Both glycolate and oxalate at concentrations of 250 μM were stable in media for such a period. Recovery of oxalate formed was complete as the media of cells incubated with 250 μM oxalate for 24 h yielded 247 ± 3 μM oxalate. In the absence of GO and AGT, neither oxalate, nor glyoxylate was produced by CHO cells after incubation with glycolate (Fig. 5). In contrast, the expression of different AGT variants resulted in significant differences in the amount of oxalate and glyoxylate produced (p < 0.05) compared to CHO GO. The expression of AGT-MA or AGT-mi resulted in a 4-fold and 3-fold lower oxalate and glyoxylate produced, respectively, compared with CHO GO cells (Fig. 5). In cells expressing the AGT mutant AGT-170, the amount of oxalate and glyoxylate produced was higher compared with normal AGT and amounted to 30–40% of the glycolate added (Fig. 5) (p < 0.05).
Fig. 5.

Synthesis of oxalate and glyoxylate in CHO cells expressing GO and AGT after incubation with varying concentrations of glycolate. CHO wt and CHO cells expressing GO ± AGT-Ma, AGT-mi or AGT-170 were incubated with different glycolate concentrations (a: 0, b: 100, c: 250 μM) for 24 h. The concentrations of oxalate (white bars), glycolate (black bars) and glyoxylate (gray bars) released in the media were measured by IC, IC/MS and HPLC, respectively and plotted as stacked columns. Results (n ≥ 3) are expressed as mean ± SD.
3.5. Pyridoxine attenuates the indirect cytotoxicity of glycolate in cells expressing normal and some mutant forms of AGT
In order to see whether pyridoxine was able to increase the metabolic effectiveness of AGT mutants, cell lines expressing GO and different AGT variants were cultured in the presence of various concentrations of pyridoxine (0–250 μM) before the addition of glycolate (Fig. 6). The survival of CHO wt, CHO GO, as well as cells expressing AGT-41 and AGT-152 remained below 15% at all pyridoxine concentrations. In the other cell lines expressing normal AGTs or AGT-170 pyridoxine significantly modified cell survival (p < 0.001). The survival of cells expressing AGT-MA, AGT-mi or AGT-170 increased significantly with increasing pyridoxine concentration up to 0.3 μM, after which a decrease was observed both at 50 μM (Fig. 6) and 250 μM (data not shown). There was a modest but significant increase of survival for cells expressing AGT-244, with a 1.6 fold increase in cell survival with standard or higher pyridoxine concentrations compared with low concentrations (p < 0.001).
Fig. 6.

Effect of pyridoxine on the survival of CHO GO AGT cells after glycolate incubation. CHO cells stably expressing GO ± different AGT variants (AGT-MA, AGT-mi, AGT-170) grown in different concentrations of pyridoxine (0: light gray, < 0.3: dark gray, 0.3: black, 50 μM: hatched) were incubated for 2 days with glycolate (0, 500, 750 μM). Cell survival was normalized against untreated controls grown in the same pyridoxine concentration and expressed as a ratio to the survival at matched (500 and 750 μM). Glycolate in 0.3 μM pyridoxine. Results are expressed as mean and range (n ≥ 4) of both glycolate concentrations. Different superscript letters denote significant differences between columns (p < 0.01). The estimated range of normal PLP levels in human plasma is 10–100 nmol/l.
3.6. Pyridoxine decreases oxalate and glyoxylate production
To examine if the increased resistance to indirect glycolate toxicity following the addition of pyridoxine could be due to decreased oxalate and glyoxylate production, both metabolites were measured in media containing standard or low concentrations of pyridoxine (Table 2). Changes in pyridoxine concentrations had no effect on oxalate or glyoxylate produced in cells not expressing AGT (CHO GO) and little effect in cells expressing normal AGTs (CHO GO + AGT-MA and CHO GO + AGT-mi). However, at lower levels of pyridoxine, cells expressing the mutant AGT-170 showed a significant increase of oxalate and glyoxylate produced, compared with higher pyridoxine levels (p < 0.001). Oxalate and glyoxylate levels produced in cells expressing AGT-170 were always higher than that produced in cells expressing AGT-MA (p < 0.02, p < 0.01 for oxalate after Bonferroni correction). Syntheses in cells expressing AGT-mi were significantly different from those expressing AGT-MA when pyridoxine levels were low (p < 0.01, p < .0.05 after Bonferroni correction for oxalate).
Table 2.
Effect of pyridoxine on oxalate and glyoxylate production in stably transfected CHO cells incubated with glycolate.
| Cell line | Oxalate (μM)
|
Glyoxylate (μM)
|
||
|---|---|---|---|---|
| Standard B6 | Low B6 | Standard B6 | Low B6 | |
| 100 μM glycolate | ||||
| CHO GO AGT-MA | 2.2 ± 1.7 | 4.9 ± 0.8a,* | 0.6 ± 0.2 | 1.1 ± 0.3 |
| CHO GO AGT-mi | 5.8 ± 0.8b,* | 7.2 ± 1.0b,** | 0.7 ± 0.2 | 1.1 ± 0.3 |
| CHO GO AGT-170 | 16.2 ± 2.8b,** | 30.2 ± 2.2a,b,*** | 2.1 ± 0.7b | 4.7 ± 0.4a,b,*** |
| CHO GO | 69.7 ± 7.0 | 61.1 ± 8.9 | 6.3 ± 0.2 | 9.6 ± 0.2 |
| 250 μM glycolate | ||||
| CHO GO AGT-MA | 11.9 ± 4.3 | 11.1 ± 1.9 | 1.2 ± 0.3 | 2.0 ± 0.4a,* |
| CHO GO AGT-mi | 17.2 ± 3.3 | 20.6 ± 1.6b,*** | 1.7 ± 0.9 | 3.2 ± 0.1b,*** |
| CHO GO AGT-170 | 51.9 ± 6.7b,*** | 86.7 ± 4.3a,b,*** | 8.1 ± 2.5b,** | 18.4 ± 2.4a,b,*** |
| CHO GO | 139.9 ± 17.8 | 128.2 ± 5.2 | 24.8 ± 0.1 | 31.7 ± 1.7 |
Cells were grown at least 4 weeks in either standard pyridoxine concentration (0.3 μM) or with low pyridoxine concentration (< 0.3 μM) (see Experimental procedures). Adapted cells were incubated with 100 or 250 μM glycolate for 24 h. The concentrations of oxalate and glyoxylate released in the media were measured by IC and reverse phase HPLC, respectively. Results (n = 3–4, except CHO GO, n = 2) are expressed as means ± SD. The background oxalate (1.7 μM) and glyoxylate (2.3 μM) measured in CHO wt incubated with 250 μM glycolate was subtracted from the data. A significant difference in oxalate and glyoxylate production between standard and low concentrations of pyridoxine is indicated by (a) between cells expressing AGT variants by (b). Statistical analysis was done by Student’s t-test (raw p values: *p < 0.05; **p < 0.01; ***p < 0.001). Bold values indicate p < 0.05 after Bonferroni correction.
3.7. ROS production occurs in cells following glycolate metabolism
Both glyoxylate and oxalate have been reported to provoke oxidative stress in renal cells [44–47]. In an attempt to see if such was the case during the metabolism of glycolate to glyoxylate and oxalate in CHO cells, we investigated the production of ROS during the indirect glycolate toxicity assay by measuring the oxidation of DCFH in cells incubated with glycolate (Fig. 7). In the absence of GO, no change in cellular ROS was detected, but in both CHO GO and CHO GO AGT-MA cells, a significant increase in ROS was produced in response to glycolate metabolism.
Fig. 7.
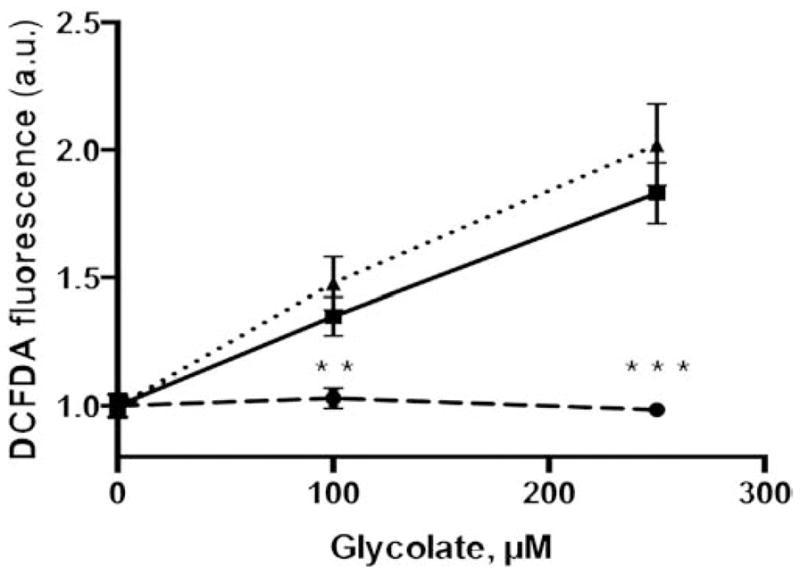
Reactive oxygen species (ROS) production. Intracellular ROS production was measured 4 h after incubation with glycolate (0–250 μM) in CHO wt (dashed line) and CHO GO (full line) CHO GO + AGT-MA (dotted line) after loading with DCF-DA. Results are expressed as mean ± SEM relative increases in specific fluorescence intensities (n = 2–4), statistical difference between CHO wt and CHO GO ± AGT-MA is indicated (**p < 0.01; ***p < 0.001).
4. Discussion
The development of a cell model that over-expresses GO and produces a cytotoxic response on exposure to glycolate has proven to be useful for assessing pharmacological approaches that limit mutant AGT mitochondrial mistargeting and for understanding the response of AGT mutants to pyridoxine [23,48]. In the present study we have characterized the metabolism of glycolate in this model to help understand the mechanism of the cytotoxic response and how it is altered by pyridoxine, normal AGT and some of its mutant forms.
In cells expressing GO, glyoxylate and thence oxalate were produced from the metabolism of glycolate, and the expression of functional AGT reduced the amount of both. As in HepG2 cells, both oxalate and glyoxylate produced in the cells were released in the culture media and could be reliably and accurately measured [36]. In CHO cells stably transfected with GO, oxalate was the major end product of the added glycolate with smaller amounts of glyoxylate detected. The fact that glyoxylate could be measured here probably reflects the abnormally high amounts produced since it would be quickly oxidized to oxalate by LDH. Recovery of glycolate, as either oxalate or glyoxylate, in the media of cells expressing only GO averaged 70%, which could be partly explained by a loss of glyoxylate through reaction with surrounding proteins, or trapping in the cells.
In cells stably transfected with GO and various forms of AGT, the production of oxalate and glyoxylate was compatible with the specific activities of AGT variants demonstrated with purified enzyme preparations as well as the AGT catalytic activities reported in human subjects. The indirect cell toxicity seen with glycolate was tempered by the metabolic efficiency of AGT variants and was consistent with both AGT activity patterns and metabolite production [4,23]. In the present model, the different transfected CHO cells lines may have different AGT to GO expression ratios despite having comparable GO and AGT expression [23,29], which has to be taken into account when direct comparisons between cell lines are made.
The minor allele of AGT has been shown to code for a slightly less stable and less active AGT enzyme than that of the major allele, with enzyme activity ranging from 45 to 100% of normal depending on the model (purified protein or expression in cells) and the activity in the liver reported around 90% [49]. In the present study, the concentrations of oxalate and glyoxylate were different in cells expressing AGT-mi and AGT-MA only when pyridoxine concentration was below 0.3 μM. Similar urinary oxalate excretions in individuals containing only the major allele or heterozygous for the minor allele have been reported, but the patients’ status regarding pyridoxine was not known [50]. The impact of the minor allele of AGT is expected to be minor at best but may only be of consequence for minor allele homozygotes, especially if the pyridoxine levels are low. Cells expressing AGT-170, however, produced significantly higher levels of oxalate and glyoxylate than normal AGT, consistent with its mistargeting to mitochondria in these cells [29] and the elevated oxalate production observed in individuals with PH who carry this allele [49].
Studies on normal and mutant forms of purified recombinant AGT have shown that PLP and PMP can increase AGT catalytic activity, stability and dimerization [4,21,22,25,26,51–53]. The decreased survival of cells expressing AGT-MA, AGT-mi and even AGT-170 seen at pyridoxine concentrations of 50 μM and above paralleled the paradoxical decrease in catalytic activity seen previously for AGT-MA and AGT-mi [23,48]. Recent work by Cellini and colleagues has shown that the excess PNP formed from pyridoxine at high concentrations inhibits AGT activity so that there is an optimal pyridoxine concentration range below and above which AGT activity is decreased [48]. This effect is specific to this vitamer as pyridoxamine and pyridoxal did not result in elevation of PNP. Whether this is relevant for treatment in PH patients is unclear but re-elevation of urinary oxalate has been reported in PH1 patients treated with higher doses of pyridoxine [15]. Pyridoxine is used as a treatment in a variety of inborn errors of metabolism and other diseases and plasma levels of PLP under B6 treatment have been reported to be between 200 and 900 nM [27,54–56]. Future clinical studies may be able to narrow down the therapeutic target for plasma B6 in PH1 patients. In our study, up to concentrations of 300 nM, pyridoxine increased AGT activity in cells by both viability assessment and measurement of the oxalate and glyoxylate produced. Among the different AGT variants studied, some were more responsive to pyridoxine than others, consistent with the known pyridoxine responsiveness of some mutants in patients and different responses in purified protein and transfected cells.
In patients with PH1, those expressing the p.[(Pro11Leu; Gly170Arg; Ile340Met)] mutation have the greatest pyridoxine responsiveness, sometimes normalizing urinary oxalate [13,15]. Studies with the purified protein have shown that the decreased stability of the mutant dimer could be normalized by PLP [22]. In CHO cells transfected with this mutant form of AGT, pyridoxine had been shown to increase catalytic activity, protein expression and peroxisomal targeting [23]. In the present study the survival of cells expressing AGT-170 was improved with pyridoxine up to 0.3 μM. This was associated with a significant decrease (≈40%) in oxalate and glyoxylate produced by the cells, which is consistent with what is expected to happen in hepatocytes of PH1 patients. Neither cell survival nor glycolate metabolism was completely normalized by pyridoxine in the present work. It is possible that the optimal concentration of pyridoxine necessary to achieve normalization of AGT efficiency falls between the levels assessed here and further work will be necessary to narrow the therapeutic window.
Some measure of pyridoxine responsiveness was observed for the AGT-244 mutant in the cytotoxicity assay. This is consistent with what has been observed in CHO cells and in a few PH1 patients carrying the p.[(Pro11Leu; Ile244Thr; Ile340Met)] mutation, who have been reported to respond to pyridoxine therapy [20,23]. Surprisingly, cells expressing AGT-152 did not respond to pyridoxine despite the fact that some PH1 patients expressing the p.[(Pro11Leu; Phe152Ile; Ile340Met)] allele have been found to be pyridoxine responsive. [16,23]. Considering that this cell line displayed a higher sensitivity to glycolate exposure, a lower range of glycolate concentrations may have been necessary to be used. Published work has shown that the AGT-152 variant is pyridoxine responsive in assays with purified protein, CHO cell expression and in PH1 patients bearing this mutation [21,23]. The minor allele of AGT (AGT-mi) has been shown to have a lower stability than AGT-MA, which was improved by PLP [22]. Likewise the catalytic activity of AGT-mi was increased by pyridoxine in CHO cells [23]. An increased cell survival with small increase in pyridoxine was shown in the present study but no significant decrease in oxalate or glyoxylate concentrations could be detected. However, since those were already low, it is possible that the sensitivity of our assays and small sample size were insufficient to detect it.
Most studies on oxidative stress and oxalate have demonstrated that calcium oxalate monohydrate crystals (COM) both generate and are triggered by oxidative stress and ROS production [57]. Studies have also shown that oxalate in itself and glyoxylate have the potential to cause ROS production in renal proximal tubule cells [44–47]. The fact that cell damage and H2O2 production have only been shown for concentrations of free oxalate ≥5 mM points to the role of COM [44,58]. In contrast, oxidative stress and ROS production in renal cells have been seen at lower concentrations (above 0.5 mM after 24 h) [47]. In CHO cells, a greater toxicity was seen using similar concentrations of glycolate, compared to adding glyoxylate and oxalate to the media. This suggests that production of glyoxylate and oxalate in the cells is more efficient in triggering cytotoxicity. Changes in intracellular concentrations of oxalate and glyoxylate would need to be assessed to determine their role more precisely and their potential for direct cell injury. In our study, both cells expressing GO and GO + AGT showed a similar DCF response signal following glycolate metabolism, which could be related to the significant hydrogen peroxide production during GO activity, although other reactive oxygen species triggered by glyoxylate or oxalate cannot be excluded. The inability of AGT to suppress ROS production in contrast to its protection against loss of viability suggests that ROS production is not in itself the major contributor to glycolate sensitivity in CHO GO cells. Other measures of oxidative stress and potential mitochondrial repercussions could however be studied in such a cell model, where direct production of oxalate and glyoxylate takes place in cells. The possible implications for PH in the liver, and other tissues, warrants further investigation.
In addition to detecting changes in the metabolic activity of AGT, this system could be used to detect a decreased activity (inhibition) of GO, which would be expected to be of equal benefit to patients with PH1 and indeed other forms of PH. Therapies targeting GO and GO inhibitors have been the object of several studies and would be logical candidates for this assay [59–61]. Inhibitors should attenuate the cytotoxic response of GO-expressing cells to glycolate. Adapting the present method for drug screening would allow candidate drugs to be tested for their potency. Such an assay could find a place alongside current models for drug screening in PH, such as yeast assays and mouse models [52,62, 63]. In addition to a qualitative assessment, this system could also allow a more quantitative description of the cellular mechanism of action (protein expression, catalytic activity, subcellular targeting) as has been done recently [30,48], as well as a direct assessment of oxalate and glyoxylate produced by the cells.
Acknowledgments
This work was supported by grants from the Oxalosis and Hyperoxaluria Foundation (to CJD), NIH grant DK54468 (to RPH), the Société française de Néphrologie (to SF) and the Urology Care Foundation (to SF). The authors thank Dr A. Mitchem, Dr E.L. Williams, L. Whitworth, Dr X. Li for technical assistance. The authors also thank Dr B. Cellini and Dr E. Oppici for their kind gift of pyridoxine free medium.
Abbreviations
- AGT
alanine:glyoxylate amino transferase
- COM
calcium monohydrate crystals
- GO
glycolate oxidase
- PH1
primary hyperoxaluria type 1
- PLP
pyridoxal-5′-phosphate
Footnotes
Conflict of interest
The authors declare that they have no conflict of interest with the content of this article.
Author contributions
SF designed, performed, analyzed the experiments and wrote the paper. JK, RH, GR, and CD provided technical assistance and contributed to the analysis of the data. CD conceived the study. All authors approved the final version of the manuscript.
Transparency document
The Transparency document associated with this article can be found, in the online version.
References
- 1.Danpure CJ, Jennings PR. Peroxisomal alanine:glyoxylate aminotransferase deficiency in primary hyperoxaluria type I. FEBS Lett. 1986;201:20–24. doi: 10.1016/0014-5793(86)80563-4. [DOI] [PubMed] [Google Scholar]
- 2.Williams EL, Acquaviva C, Amoroso A, Chevalier F, Coulter-Mackie M, Monico CG, Giachino D, Owen T, Robbiano A, Salido E, Waterham H, Rumsby G. Primary hyperoxaluria type 1: update and additional mutation analysis of the AGXT gene. Hum Mutat. 2009;30:910–917. doi: 10.1002/humu.21021. [DOI] [PubMed] [Google Scholar]
- 3.Hopp K, Cogal AG, Bergstralh EJ, Seide BM, Olson JB, Meek AM, Lieske JC, Milliner DS, Harris PC. Phenotype–genotype correlations and estimated carrier frequencies of primary hyperoxaluria. JASN. 2015 doi: 10.1681/ASN.2014070698. http://dx.doi.org/10.1681/ASN.2014070698. [DOI] [PMC free article] [PubMed]
- 4.Oppici E, Montioli R, Cellini B. Liver peroxisomal alanine:glyoxylate aminotransferase and the effects of mutations associated with primary hyperoxaluria type I: an overview. Biochim Biophys Acta. 2015 doi: 10.1016/j.bbapap.2014.12.029. http://dx.doi.org/10.1016/j.bbapap.2014.12.029. [DOI] [PubMed]
- 5.Gibbs DA, Watts RW. The action of pyridoxine in primary hyperoxaluria. Clin Sci. 1970;38:277–286. doi: 10.1042/cs0380277. [DOI] [PubMed] [Google Scholar]
- 6.Watts RW, Chalmers RA, Gibbs DA, Lawson AM, Purkiss P, Spellacy E. Studies on some possible biochemical treatments of primary hyperoxaluria. Q J Med. 1979;48:259–272. [PubMed] [Google Scholar]
- 7.Hoppe B, Langman CB. A United States survey on diagnosis, treatment, and outcome of primary hyperoxaluria. Pediatr Nephrol. 2003;18:986–991. doi: 10.1007/s00467-003-1234-x. [DOI] [PubMed] [Google Scholar]
- 8.Cochat P, Hulton SA, Acquaviva C, Danpure CJ, Daudon M, De Marchi M, Fargue S, Groothoff J, Harambat J, Hoppe B, Jamieson NV, Kemper MJ, Mandrile G, Marangella M, Picca S, Rumsby G, Salido E, Straub M, van Woerden CS. Primary hyperoxaluria type 1: indications for screening and guidance for diagnosis and treatment. Nephrol Dial Transplant. 2012;27:1729–1736. doi: 10.1093/ndt/gfs078. [DOI] [PubMed] [Google Scholar]
- 9.Jiang J, Salido EC, Guha C, Wang X, Moitra R, Liu L, Roy-Chowdhury J, Roy-Chowdhury N. Correction of hyperoxaluria by liver repopulation with hepatocytes in a mouse model of primary hyperoxaluria type-1. Transplantation. 2008;85:1253–1260. doi: 10.1097/TP.0b013e31816de49e. [DOI] [PubMed] [Google Scholar]
- 10.Guha C, Yamanouchi K, Jiang J, Wang X, Roy Chowdhury N, Santana A, Shapiro LJ, Salido E, Roy-Chowdhury J. Feasibility of hepatocyte transplantation-based therapies for primary hyperoxalurias. Am J Nephrol. 2005;25:161–170. doi: 10.1159/000085408. [DOI] [PubMed] [Google Scholar]
- 11.Hatch M, Gjymishka A, Salido EC, Allison MJ, Freel RW. Enteric oxalate elimination is induced and oxalate is normalized in a mouse model of primary hyperoxaluria following intestinal colonization with Oxalobacter. Am J Physiol Gastrointest Liver Physiol. 2011;300:G461–G469. doi: 10.1152/ajpgi.00434.2010. [DOI] [PMC free article] [PubMed] [Google Scholar]
- 12.Miyata N, Steffen J, Johnson ME, Fargue S, Danpure CJ, Koehler CM. Pharmacologic rescue of an enzyme-trafficking defect in primary hyperoxaluria 1. Proc Natl Acad Sci U S A. 2014;111:14406–14411. doi: 10.1073/pnas.1408401111. [DOI] [PMC free article] [PubMed] [Google Scholar]
- 13.Monico CG, Olson JB, Milliner DS. Implications of genotype and enzyme phenotype in pyridoxine response of patients with type I primary hyperoxaluria. Am J Nephrol. 2005;25:183–188. doi: 10.1159/000085411. [DOI] [PubMed] [Google Scholar]
- 14.Monico CG, Rossetti S, Olson JB, Milliner DS. Pyridoxine effect in type I primary hyperoxaluria is associated with the most common mutant allele. Kidney Int. 2005;67:1704–1709. doi: 10.1111/j.1523-1755.2005.00267.x. [DOI] [PubMed] [Google Scholar]
- 15.Hoyer-Kuhn H, Kohbrok S, Volland R, Franklin J, Hero B, Beck BB, Hoppe B. Vitamin B6 in primary hyperoxaluria I: first prospective trial after 40 years of practice. Clin J Am Soc Nephrol. 2014 doi: 10.2215/CJN.06820613. http://dx.doi.org/10.2215/CJN.06820613. [DOI] [PMC free article] [PubMed]
- 16.van Woerden CS, Groothoff JW, Wijburg FA, Annink C, Wanders RJ, Waterham HR. Clinical implications of mutation analysis in primary hyperoxaluria type 1. Kidney Int. 2004;66:746–752. doi: 10.1111/j.1523-1755.2004.00796.x. [DOI] [PubMed] [Google Scholar]
- 17.Williams E, Rumsby G. Selected exonic sequencing of the AGXT gene provides a genetic diagnosis in 50% of patients with primary hyperoxaluria type 1. Clin Chem. 2007;53:1216–1221. doi: 10.1373/clinchem.2006.084434. [DOI] [PubMed] [Google Scholar]
- 18.Coulter-Mackie MB, Lian Q, Applegarth DA, Toone J, Waters PJ, Vallance H. Mutation-based diagnostic testing for primary hyperoxaluria type 1: survey of results. Clin Biochem. 2008;41:598–602. doi: 10.1016/j.clinbiochem.2008.01.018. [DOI] [PubMed] [Google Scholar]
- 19.Mandrile G, van Woerden CS, Berchialla P, Beck B, Acquaviva Bourdain C, Hulton SA, Rumsby G. Outcome of primary hyperoxaluria type 1 correlates with AGXT mutation type: data from a large European study. Kidney Int. 2014 doi: 10.1038/ki.2014.222. [DOI] [PubMed] [Google Scholar]
- 20.van der Hoeven SM, van Woerden CS, Groothoff JW. Primary hyperoxaluria type 1, a too often missed diagnosis and potentially treatable cause of end-stage renal disease in adults: results of the Dutch cohort. Nephrol Dial Transplant. 2012;27:3855–3862. doi: 10.1093/ndt/gfs320. [DOI] [PubMed] [Google Scholar]
- 21.Cellini B, Montioli R, Paiardini A, Lorenzetto A, Voltattorni CB. Molecular insight into the synergism between the minor allele of human liver peroxisomal alanine: glyoxylate aminotransferase and the F152I mutation. J Biol Chem. 2009;284:8349–8358. doi: 10.1074/jbc.M808965200. [DOI] [PMC free article] [PubMed] [Google Scholar]
- 22.Cellini B, Lorenzetto A, Montioli R, Oppici E, Voltattorni CB. Human liver peroxisomal alanine:glyoxylate aminotransferase: different stability under chemical stress of the major allele, the minor allele, and its pathogenic G170R variant. Biochimie. 2010;92:1801–1811. doi: 10.1016/j.biochi.2010.08.005. [DOI] [PubMed] [Google Scholar]
- 23.Fargue S, Rumsby G, Danpure CJ. Multiple mechanisms of action of pyridoxine in primary hyperoxaluria type 1. Biochim Biophys Acta. 2013 doi: 10.1016/j.bbadis.2013.04.010. http://dx.doi.org/10.1016/j.bbadis.2013.04.010. [DOI] [PubMed]
- 24.Montioli R, Roncador A, Oppici E, Mandrile G, Giachino DF, Cellini B, Borri Voltattorni C. S81L and G170R mutations causing primary hyperoxaluria type I in homozygosis and heterozygosis: an example of positive interallelic complementation. Hum Mol Genet. 2014;23:5998–6007. doi: 10.1093/hmg/ddu329. [DOI] [PMC free article] [PubMed] [Google Scholar]
- 25.Cellini B, Montioli R, Voltattorni CB. Human liver peroxisomal alanine:glyoxylate aminotransferase: characterization of the two allelic forms and their pathogenic variants. Biochim Biophys Acta. 2011;1814:1577–1584. doi: 10.1016/j.bbapap.2010.12.005. [DOI] [PubMed] [Google Scholar]
- 26.Coulter-Mackie MB, Lian Q. Partial trypsin digestion as an indicator of mis-folding of mutant alanine:glyoxylate aminotransferase and chaperone effects of specific ligands. Study of a spectrum of missense mutants. Mol Genet Metab. 2008;94:368–374. doi: 10.1016/j.ymgme.2008.03.010. [DOI] [PubMed] [Google Scholar]
- 27.Clayton PT. B6-responsive disorders: a model of vitamin dependency. J Inherit Metab Dis. 2006;29:317–326. doi: 10.1007/s10545-005-0243-2. [DOI] [PubMed] [Google Scholar]
- 28.Behnam JT, Williams EL, Brink S, Rumsby G, Danpure CJ. Reconstruction of human hepatocyte glyoxylate metabolic pathways in stably transformed Chinese-hamster ovary cells. Biochem J. 2006;394:409–416. doi: 10.1042/BJ20051397. [DOI] [PMC free article] [PubMed] [Google Scholar]
- 29.Fargue S, Lewin J, Rumsby G, Danpure CJ. Four of the most common mutations in primary hyperoxaluria type 1 unmask the cryptic mitochondrial targeting sequence of alanine:glyoxylate aminotransferase encoded by the polymorphic minor allele. J Biol Chem. 2012 doi: 10.1074/jbc.M112.432617. http://dx.doi.org/10.1074/jbc.M112.432617. [DOI] [PMC free article] [PubMed]
- 30.Madoux F, Janovick JA, Smithson D, Fargue S, Danpure CJ, Scampavia L, Chen YT, Spicer TP, Conn PM. Development of a phenotypic high-content assay to identify pharmacoperone drugs for the treatment of primary hyperoxaluria type 1 by high-throughput screening. Assay Drug Dev Technol. 2015;13:16–24. doi: 10.1089/adt.2014.627. [DOI] [PubMed] [Google Scholar]
- 31.Knott TG, Birdsey GM, Sinclair KE, Gallagher IM, Purdue PE, Danpure CJ. The peroxisomal targeting sequence type 1 receptor, Pex5p, and the peroxisomal import efficiency of alanine:glyoxylate aminotransferase. Biochem J. 2000;352(Pt 2):409–418. [PMC free article] [PubMed] [Google Scholar]
- 32.Lumb MJ, Danpure CJ. Functional synergism between the most common polymorphism in human alanine:glyoxylate aminotransferase and four of the most common disease-causing mutations. J Biol Chem. 2000;275:36415–36422. doi: 10.1074/jbc.M006693200. [DOI] [PubMed] [Google Scholar]
- 33.Lumb MJ, Birdsey GM, Danpure CJ. Correction of an enzyme trafficking defect in hereditary kidney stone disease in vitro. Biochem J. 2003;374:79–87. doi: 10.1042/BJ20030371. [DOI] [PMC free article] [PubMed] [Google Scholar]
- 34.Rumsby G, Weir T, Samuell CT. A semiautomated alanine:glyoxylate aminotransferase assay for the tissue diagnosis of primary hyperoxaluria type 1. Ann Clin Biochem. 1997;34(Pt 4):400–404. doi: 10.1177/000456329703400411. [DOI] [PubMed] [Google Scholar]
- 35.Williams E, Cregeen D, Rumsby G. Identification and expression of a cDNA for human glycolate oxidase. Biochim Biophys Acta. 2000;1493:246–248. doi: 10.1016/s0167-4781(00)00161-5. [DOI] [PubMed] [Google Scholar]
- 36.Baker PR, Cramer SD, Kennedy M, Assimos DG, Holmes RP. Glycolate and glyoxylate metabolism in HepG2 cells. Am J Physiol Cell Physiol. 2004;287:C1359–C1365. doi: 10.1152/ajpcell.00238.2004. [DOI] [PubMed] [Google Scholar]
- 37.Cellini B, Montioli R, Paiardini A, Lorenzetto A, Maset F, Bellini T, Oppici E, Voltattorni CB. Molecular defects of the glycine 41 variants of alanine glyoxylate aminotransferase associated with primary hyperoxaluria type I. Proc Natl Acad Sci U S A. 2010;107:2896–2901. doi: 10.1073/pnas.0908565107. [DOI] [PMC free article] [PubMed] [Google Scholar]
- 38.Coulter-Mackie MB, Lian Q, Wong SG. Overexpression of human alanine: glyoxylate aminotransferase in Escherichia coli: renaturation from guanidine-HCl and affinity for pyridoxal phosphate co-factor. Protein Expr Purif. 2005;41:18–26. doi: 10.1016/j.pep.2004.11.004. [DOI] [PubMed] [Google Scholar]
- 39.Danpure CJ, Purdue PE, Fryer P, Griffiths S, Allsop J, Lumb MJ, Guttridge KM, Jennings PR, Scheinman JI, Mauer SM. Enzymological and mutational analysis of a complex primary hyperoxaluria type 1 phenotype involving alanine:glyoxylate aminotransferase peroxisome-to-mitochondrion mistargeting and intraperoxisomal aggregation. Am J Hum Genet. 1993;53:417–432. [PMC free article] [PubMed] [Google Scholar]
- 40.Danpure CJ. Primary hyperoxaluria type 1 and peroxisome-to-mitochondrion mistargeting of alanine:glyoxylate aminotransferase. Biochimie. 1993;75:309–315. doi: 10.1016/0300-9084(93)90091-6. [DOI] [PubMed] [Google Scholar]
- 41.Lumb MJ, Drake AF, Danpure CJ. Effect of N-terminal alpha-helix formation on the dimerization and intracellular targeting of alanine:glyoxylate aminotransferase. J Biol Chem. 1999;274:20587–20596. doi: 10.1074/jbc.274.29.20587. [DOI] [PubMed] [Google Scholar]
- 42.Santana A, Salido E, Torres A, Shapiro LJ. Primary hyperoxaluria type 1 in the Canary Islands: a conformational disease due to I244T mutation in the P11L-containing alanine:glyoxylate aminotransferase. Proc Natl Acad Sci U S A. 2003;100:7277–7282. doi: 10.1073/pnas.1131968100. [DOI] [PMC free article] [PubMed] [Google Scholar]
- 43.Williams EL. PhD thesis. University College London (University of London); 2003. Human liver glycolate oxidase : gene identification and protein studies. ([online] http://ethos.bl.uk/OrderDetails.do?did=90&uin=uk.bl.ethos.401945) [Google Scholar]
- 44.Guo C, Cenac TA, Li Y, McMartin KE. Calcium oxalate, and not other metabolites, is responsible for the renal toxicity of ethylene glycol. Toxicol Lett. 2007;173:8–16. doi: 10.1016/j.toxlet.2007.06.010. [DOI] [PubMed] [Google Scholar]
- 45.Poldelski V, Johnson A, Wright S, Rosa VD, Zager RA. Ethylene glycol-mediated tubular injury: identification of critical metabolites and injury pathways. Am J Kidney Dis. 2001;38:339–348. doi: 10.1053/ajkd.2001.26099. [DOI] [PubMed] [Google Scholar]
- 46.Farooq SM, Boppana NB, Asokan D, Sekaran SD, Shankar EM, Li C, Gopal K, Bakar SA, Karthik HS, Ebrahim AS. C-phycocyanin confers protection against oxalate-mediated oxidative stress and mitochondrial dysfunctions in MDCK cells. PLoS ONE. 2014;9:e93056. doi: 10.1371/journal.pone.0093056. [DOI] [PMC free article] [PubMed] [Google Scholar]
- 47.Thamilselvan V, Menon M, Thamilselvan S. Oxalate at physiological urine concentrations induces oxidative injury in renal epithelial cells: effect of α-tocopherol and ascorbic acid. BJU Int. 2014;114:140–150. doi: 10.1111/bju.12642. [DOI] [PubMed] [Google Scholar]
- 48.Oppici E, Fargue S, Reid ES, Mills PB, Clayton PT, Danpure CJ, Cellini B. Pyridoxamine and pyridoxal are more effective than pyridoxine in rescuing folding-defective variants of human alanine:glyoxylate aminotransferase causing primary hyperoxaluria type I. Hum Mol Genet. 2015 doi: 10.1093/hmg/ddv276. http://dx.doi.org/10.1093/hmg/ddv276. [DOI] [PubMed]
- 49.Purdue PE, Takada Y, Danpure CJ. Identification of mutations associated with peroxisome-to-mitochondrion mistargeting of alanine/glyoxylate aminotransferase in primary hyperoxaluria type 1. J Cell Biol. 1990;111:2341–2351. doi: 10.1083/jcb.111.6.2341. [DOI] [PMC free article] [PubMed] [Google Scholar]
- 50.Theka T, Rodgers AL, Webber D, O’Ryan C. Variability in kidney stone incidence between black and white South Africans: AGT Pro11Leu polymorphism is not a factor. J Endourol. 2014;28:577–581. doi: 10.1089/end.2013.0617. [DOI] [PubMed] [Google Scholar]
- 51.Cellini B, Bertoldi M, Montioli R, Paiardini A, Borri Voltattorni C. Human wild-type alanine:glyoxylate aminotransferase and its naturally occurring G82E variant: functional properties and physiological implications. Biochem J. 2007;408:39–50. doi: 10.1042/BJ20070637. [DOI] [PMC free article] [PubMed] [Google Scholar]
- 52.Hopper ED, Pittman AMC, Fitzgerald MC, Tucker CL. In vivo and in vitro examination of stability of primary hyperoxaluria-associated human alanine:glyoxylate aminotransferase. J Biol Chem. 2008;283:30493–30502. doi: 10.1074/jbc.M803525200. [DOI] [PMC free article] [PubMed] [Google Scholar]
- 53.Cellini B, Montioli R, Oppici E, Astegno A, Voltattorni CB. The chaperone role of the pyridoxal 5′-phosphate and its implications for rare diseases involving B6-dependent enzymes. Clin Biochem. 2014;47:158–165. doi: 10.1016/j.clinbiochem.2013.11.021. [DOI] [PubMed] [Google Scholar]
- 54.Footitt EJ, Clayton PT, Mills K, Heales SJ, Neergheen V, Oppenheim M, Mills PB. Measurement of plasma B(6) vitamer profiles in children with inborn errors of vitamin B(6) metabolism using an LC–MS/MS method. J Inherit Metab Dis. 2012 doi: 10.1007/s10545-012-9493-y. http://dx.doi.org/10.1007/s10545-012-9493-y. [DOI] [PubMed]
- 55.Midttun O, Hustad S, Solheim E, Schneede J, Ueland PM. Multianalyte quantification of vitamin B6 and B2 species in the nanomolar range in human plasma by liquid chromatography–tandem mass spectrometry. Clin Chem. 2005;51:1206–1216. doi: 10.1373/clinchem.2005.051169. [DOI] [PubMed] [Google Scholar]
- 56.Bor MV, Refsum H, Bisp MR, Bleie Ø, Schneede J, Nordrehaug JE, Ueland PM, Nygard OK, Nexø E. Plasma vitamin B6 vitamers before and after oral vitamin B6 treatment: a randomized placebo-controlled study. Clin Chem. 2003;49:155–161. doi: 10.1373/49.1.155. [DOI] [PubMed] [Google Scholar]
- 57.Khan SR. Reactive oxygen species, inflammation and calcium oxalate nephrolithiasis. Transl Androl Urol. 2014;3:256–276. doi: 10.3978/j.issn.2223-4683.2014.06.04. [DOI] [PMC free article] [PubMed] [Google Scholar]
- 58.Schepers MSJ, van Ballegooijen ES, Bangma CH, Verkoelen CF. Oxalate is toxic to renal tubular cells only at supraphysiologic concentrations. Kidney Int. 2005;68:1660–1669. doi: 10.1111/j.1523-1755.2005.00576.x. [DOI] [PubMed] [Google Scholar]
- 59.Murray MS, Holmes RP, Lowther WT. Active site and loop 4 movements within human glycolate oxidase: implications for substrate specificity and drug design. Biochemistry. 2008;47:2439–2449. doi: 10.1021/bi701710r. [DOI] [PMC free article] [PubMed] [Google Scholar]
- 60.Chen Z, Vignaud C, Jaafar A, Lévy B, Guéritte F, Guénard D, Lederer F, Mathews FS. High resolution crystal structure of rat long chain hydroxy acid oxidase in complex with the inhibitor 4-carboxy-5-[(4-chlorophenyl)sulfanyl]-1, 2, 3-thiadiazole. implications for inhibitor specificity and drug design. Biochimie. 2012;94:1172–1179. doi: 10.1016/j.biochi.2012.02.003. [DOI] [PubMed] [Google Scholar]
- 61.Li X, Knight J, Fargue S, Buchalski B, Guan Z, Inscho EW, Liebow A, Fitzgerald K, Querbes W, Todd Lowther W, Holmes RP. Metabolism of 13C5-hydroxyproline in mouse models of primary hyperoxaluria and its inhibition by RNAi therapeutics targeting liver glycolate oxidase and hydroxyproline dehydrogenase. Biochim Biophys Acta (BBA) - Mol Basis Dis. 2016;1862:233–239. doi: 10.1016/j.bbadis.2015.12.001. [DOI] [PMC free article] [PubMed] [Google Scholar]
- 62.Pittman AMC, Lage MD, Poltoratsky V, Vrana JD, Paiardini A, Roncador A, Cellini B, Hughes RM, Tucker CL. Rapid profiling of disease alleles using a tunable reporter of protein misfolding. Genetics. 2012;192:831–842. doi: 10.1534/genetics.112.143750. [DOI] [PMC free article] [PubMed] [Google Scholar]
- 63.Salido EC, Li XM, Lu Y, Wang X, Santana A, Roy-Chowdhury N, Torres A, Shapiro LJ, Roy-Chowdhury J. Alanine-glyoxylate aminotransferase-deficient mice, a model for primary hyperoxaluria that responds to adenoviral gene transfer. Proc Natl Acad Sci U S A. 2006;103:18249–18254. doi: 10.1073/pnas.0607218103. [DOI] [PMC free article] [PubMed] [Google Scholar]