Abstract
Understanding the language encrypted in the gene regulatory regions of the human genome is a challenging goal for the genomic era. Although customary extrapolations from steady-state mRNA levels have been effective, deciphering these regulatory codes will require additional empirical data sets that more closely reflect the dynamic progression of molecular events responsible for inducible transcription. We describe an approach using chromatin immunoprecipitation to profile the kinetic occupancy of the transcriptional coactivator and histone acetyltransferase p300 at numerous mitogen-induced genes in activated T cells. Comparison of these profiles reveals a class of promoters that share common patterns of inducible expression, p300 recruitment, dependence on selective p300 domains, and sensitivity to histone deacetylase inhibitors. Remarkably, this class also shares an evolutionarily conserved promoter composition and structure that accurately predicts additional human genes with similar functional attributes. This “reverse genomic” approach will have broad application for the genome-wide classification of promoter structure and function.
Transcriptional control of gene expression is a pivotal determinant of cell behavior (1–3). The molecular mechanisms of transcriptional regulation comprise an intricate hierarchy of factors and processes that have coevolved with metazoan complexity (1). Conceptually, this hierarchy has three distinct levels (4, 5). First, sequence-specific DNA-binding transcription factors bind to regulatory sequences linked to targeted genes. Once bound, these factors recruit members of a second hierarchy, including non-DNA-binding scaffolding proteins capable of modifying the generally repressive context of chromatin to allow competent assembly of the transcription apparatus. Components within this second level include Brg-1 and other members of the SWI/SNF family that remodel chromatin through direct ATP-dependent interaction. Another class of factors at this level includes those that alter chromatin structure through covalent modification of histones, such as the histone acetyltransferase p300 (6). These members act as signal-regulated scaffolds to bridge interactions between the sequence-specific DNA-binding proteins and the more ubiquitous general transcriptional components that constitute the third hierarchical level, including RNA polymerase II and its basal factors.
The coordination of these events is ultimately integrated at the level of the DNA sequences contained in the cis-elements and other regulatory regions of the targeted genes (2). A logical inference from this relationship is that genes, with similar cis-element composition and arrangement within their promoters and gene-regulatory regions, are likely to show similar modes of regulation (7). Thus, a common regulatory language must exist.
The gene-regulatory language of higher eukaryotes has evolved with a hierarchical complexity that has paralleled the nuclear transcriptional machinery (1, 2). The smallest unit of information or “word” within the gene-regulatory language is the single element or “consensus” sequence that is bound by its cognate sequence-specific DNA-binding transcription factor. In higher organisms, a single cis-element may act in coordination with nearby elements to form composite elements or “modules” that will recognize two or more different DNA-binding factors in a linked or cooperative fashion (2). This organization of “regulatory words” into “regulatory phrases” forms the foundation of the combinatorial promoter logic that characterizes most mammalian genomes (2, 8, 9).
Many components of the transcriptional machinery necessary for interpreting promoter logic have coevolved through selective expansion and diversification (1). The p300 histone acetyltransferase is a primary example of this coevolution. In metazoan cells, p300-like molecules have evolved to possess several overlapping and nonoverlapping binding sites capable of forming consecutive and/or simultaneous interactions with multiple promoter-bound transcription factors (10). As a result, p300 and the related cAMP-response-element-binding protein have emerged as versatile “molecular interpreters” that can parse and/or conjugate the regulatory “words,” “phrases,” and “sentences” of the genome. These relatively unique properties make p300 an ideal endogenous molecular probe for sensing promoter content and structure.
In this study, the chromatin immunoprecipitation (ChIP) assay is used to examine the kinetics of mitogen-inducible association of p300 with multiple genes in activated T cells. This approach reveals a class of promoters with common patterns of p300 recruitment, shared aspects of gene-regulatory control, and evolutionarily conserved features of promoter structure. Bioinformatic screening and molecular validation identifies additional human genes with similar predicted molecular behavior, promoter structure, and evolutionary conservation. This “reverse genomics” approach can be expanded by using platforms suitable for genome-wide surveys and will therefore become a very important empirical tool for functional genomic analysis.
Materials and Methods
RNase Protection Assay. Jurkat T cells were stimulated with 50 ng/ml phorbol myristate acetate (PMA) (Sigma) and 1 μM ionomycin (Calbiochem) in the absence or presence of anti-CD28 antibody. RNase protection assays were performed by using the BD RiboQuant RPA kit (BD Biosciences) according to the manufacturer's instructions.
Cell Culture and Transfection Assays. Transfections were performed by 96-well format electroporation with a BTX ECM830 Electro Square Porator (Genetronics, San Diego). Jurkat T cells (5 × 10⁶) were transfected with 5 μg of each reporter in 150 μl of media for 15 ms with a 325-V charge. Cells were then immediately transferred to 1 ml of RPMI medium 1640 and allowed to recover for 4–6 h before treatment with histone deacetylase inhibitors [5 mM sodium butryate, 20 ng/ml trichostatin A (TSA), or 1 μM suberoylanilide hydroxamic acid] for 2 h before activation by 50 ng/ml PMA and 1 μM ionomycin. All transfections were carried out in triplicate, and the data shown represent at least three independent experiments. The IL2, p21/WAF1/CDKN1A, and GADD153/DDIT3 luciferase promoter reporter plasmids have been described (11–13). The p16/CDKN2A promoter luciferase reporter plasmid was generated by PCR amplification of a 505-bp fragment of p16/CDKN2A with p16F 5′-CCAAACACCCCGATTCAATTTGGCA-3′ and p16RC 5′-CCGCTGCCTGCTCTACCCCTCTCC-3′ primers. The PCR fragment was cloned into pCR 2.1-TOPO vector by using the TOPO TA cloning kit (Invitrogen), and the sequence was verified. The fragment was then subcloned into the XhoI/HindIII sites of pGL3Basic (Promega). The GAL4/p300 fusion expression plasmids have been described (14).
ChIP Assay. Jurkat T cells were stimulated with 50 ng/ml PMA and 1 μM ionomycin for the indicated times, then fixed in 1% formaldehyde for 15 min on ice. The fixation was quenched with 0.125 M glycine for 15 min on ice, washed three times in PBS, and then resuspended in 1 ml of 50 mM Tris (pH 7.4) with 1% SDS. Cells were sonicated with three 15-s pulses with a Sonic Dismembrator (Fisher Scientific) set at 50% of the maximum output, disrupting 95% of the cells. Chromatin was immunoprecipitated from 500 μg of soluble chromatin from each time point by using affinity-purified anti-p300 polyclonal antibody (11). Immunoprecipitated protein–DNA complexes were washed seven times with radioimmunoprecipitation assay buffer (1% Nonidet P-40/0.5% deoxycholate in PBS), twice with high-salt radioimmunoprecipitation assay buffer (500 mM NaCl/1% Nonidet P-40/0.5% deoxycholate in PBS), and twice with TE (10 mM Tris, pH 8.0/1 mM EDTA). The crosslinks were reversed overnight at 65°C and deproteinated with 20 μg/ml proteinase K (Invitrogen) in the presence of 0.5% SDS. p300-associated DNA was detected by PCR amplification (Qiagen, Valencia, CA) with the PCR primers indicated (Table 1, which is published as supporting information on the PNAS web site) for 27–35 PCR cycles. PCR amplicons were size-separated on a 2% agarose gel and visualized with ethidium bromide.
Real-Time RT-PCR. Jurkat T cells were stimulated with 50 ng/ml PMA and 1 μM ionomycin for the indicated times alone or after 2 h of pretreatment with 5 mM NaBu or 20 ng/ml TSA. RNeasy midi columns (Qiagen) were used to isolate total RNA. RNA was random primed and cDNA synthesized at 42°C with SuperScript II RNA polymerase (Invitrogen). Target cDNA amplicons were amplified with the RT-PCR primer sequences described in Table 1. PCR reactions were quantitated by using the Quanti-Tect SYBR Green PCR kit (Qiagen) on an ABI 7900HT sequence-detection system (Applied Biosystems). Relative changes in gene expression were calculated by the ΔΔCt method (Applied Biosystems) from replicate determinations by using ACTB as a reference. Error was calculated from the square root of the sum of the variances of the Ct measurements from the untreated and treated samples of each gene and the actin control.
Promoter Analyses. All promoter sequences were identified as the nucleotides 900 bp 5′ and 100 bp 3′ relative to transcription start of the respective reference mRNAs given in Table 1. Promoter sequences were extracted from University of California Santa Cruz/National Center for Biotechnology Information assembly build 28 of the human genome with the Genome Analysis Tool “the promoter regions of RefSeq sequences” at http://genome.nci.nih.gov/tools/promoH.html. The identification of transcription factor-binding sites, frameworks, and genome searches for given models were done by using the gems launcher (Genomatix, Munich). Extracted promoter sequences were used as inputs into the Genomatix suite 1.2 frameworker module of (gems launcher 3.3) with a quorum constraint of 100% and distance constraints of minimum, 5 bp, and maximum, 300 bp. The longest matches identified with the gems 3.3 frameworker contained six binding sites. Once identified, the frameworks were used to search the human genome (embl release 71) with the gems 3.3 modelinspector 4.80 with an 80% threshold setting.
Cross-Species Promoter Alignments. The indicated gene promoter regions were identified and mapped to the human genome by using genomevista at http://pipeline.lbl.gov/cgi-bin/GenomeVista. Identity curves for the mapped promoter regions were generated by using the Vista genome browser 2.0 at http://pipeline.lbl.gov/servlet/vgb2 with a setting of minimum consensus width and a calculation window of 10 bp. The human genome (National Center for Biotechnology Information build 33, University of California Santa Cruz:hg15) alignments with mouse (Feb. 2003 LAGAN, http://lagan.stanford.edu/lagan_web/index.shtml) and rat (Jun. 2003 LAGAN) genomes are shown (Figs. 2B and 4). Percent GC content calculation was based on 10-bp bins. Further details regarding the promoter microarray can be found in Supporting Text, which is published as supporting information on the PNAS web site.
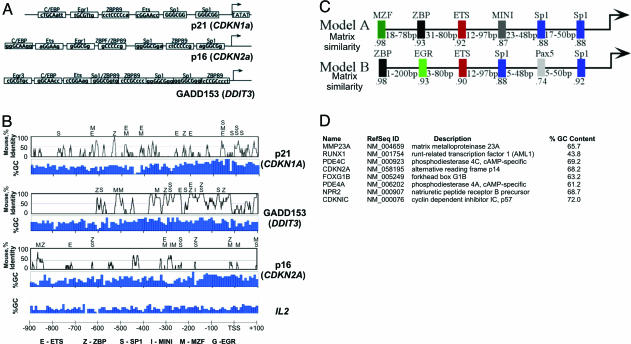
Fig. 2.
Comparison of proximal promoter structures. (A) Schematic comparison of proximal promoter regions of p21/WAF1/CDKN1A, GADD153/DDIT3, and p16/CDKN2A. Primary sequences or cis-elements are shown in Table 2. Transcription factor-binding sites found in the primary promoter sequence were identified by using matinspector 6.2.1.(B) Promoter region alignments between human and mouse are shown as VISTA identity curves. Consensus transcription factor-binding sites identified within conserved regions between the human and mouse promoter sequences are shown above the VISTA plots. The percent GC content is indicated below the VISTA plot. (C) Common transcription factor regulatory frameworks were identified within the proximal promoter regions of p21/WAF1/CDKN1A, GADD153/DDIT3 and p16/CDKN2A by using the Genomatix suite 1.2 frameworker module of gems 3.3.(D) List of genes containing framework model A. Framework model A was used to screen the human genome (embl release 71) with modelinspector 4.80 (gems 3.3) of the Genomatix suite and matched with the eight genes. Framework model B yielded no matches.
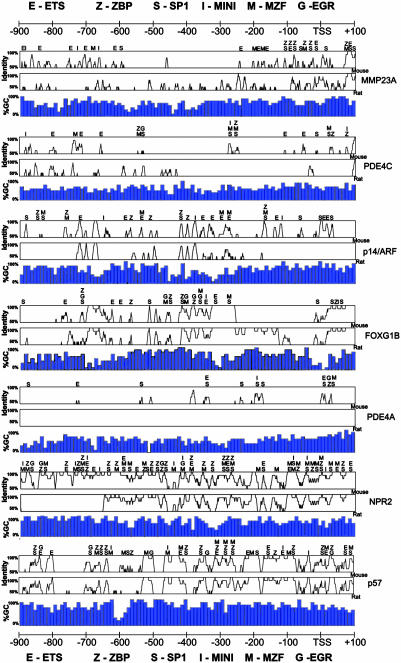
Fig. 4.
Bioinformatic analysis of predicted promoter regions. Promoter alignments between human and mouse (Top) and between human and rat (Middle) are shown as vista2.0 identity curves. Consensus transcription factor binding sites within conserved regions between the human and mouse promoter sequences were identified with matinspector 6.2.2 and are shown above VISTA plots. The percent GC content is indicated (Bottom).
Results
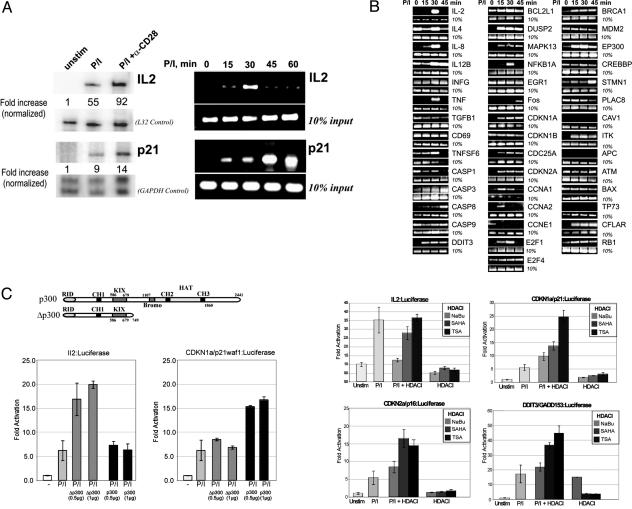
p300 is recruited to a diverse set of promoters (10), but it is not clear whether the mode of this recruitment is promoter-specific or universally shared by all genes. In T cells, the mRNA levels of the interleukin-2 (IL2) and p21/WAF1/CDKN1A genes are both readily elevated in mitogen-induced and CD28 receptor-costimulated T cells (Fig. 1A Left). However, although IL2 and p21/WAF1/CDKN1A are similarly induced in response to mitogen and CD28 receptor costimulation at the mRNA level, their kinetic profiles for the recruitment of p300 are very distinct, as measured by ChIP in mitogen-stimulated cells (Fig. 1 A Right). The disparity between the inducible steady-state mRNA levels and the p300 retention profiles of these genes prompted us to search for similar differences in p300 recruitment profiles at other genes known to be induced in mitogen-activated T cells (Fig. 6, which is published as supporting information on the PNAS web site) (15). A screen of 43 different promoters reveals significant variability in the kinetic profile of inducible p300 recruitment and retention at various genes when measured at 0, 15, 30, and 45 min after phorbol ester and ionomycin stimulation (Figs. 1B and 7, which is published as supporting information on the PNAS web site). The pattern of high induced and sustained association, as shown for p300 at the p21/WAF1/CDKN1A promoter in Fig. 1 A, is the most prominent and invariant among CFLAR (the inhibitor of caspase 8) and three genes with strikingly similar ontologies in cell-cycle control and differentiation: p21/WAF1/CDKN1A, p16/CDKN2A, and GADD153/DDIT (Figs. 1B and 7).
Fig. 1.
The recruitment profiles of p300 to the proximal promoters of IL2 and p21/WAF1/CDKN1A are kinetically distinct. (A) RNase protection analysis shows that T cell activation induced IL2 and p21/WAF1/CDKN1A transcript levels. Cells were stimulated for 4 h with PMA (P), ionomycin (I), and anti-CD28 antibody as indicated. Protected probes specific for IL2 and p21/WAF1/CDKN1A are shown with L32 and GAPDH as loading controls. (Left) Kinetic recruitment profiles of p300 at the IL2 and p21/WAF1/CDKN1A promoters. Jurkat cells were formalin-crosslinked at 15-min intervals after P + I stimulation. ChIP was performed at each time point by using anti-p300 antibody. (Right) Ten percent of the input chromatin is shown as a loading control. (B) ChIP screen of p300 recruitment profiles at specific promoters with 10% input control. (C Upper Left) Schematic of the domain structure of p300 and the Δp300 deletion mutant expression vectors. (C Lower Left) Transient cotransfection of IL2 and p21 luciferase promoter reporters with p300 and the Δp300 deletion mutant. (C Right) Histone deacetylase inhibitor (HDACI) sensitivity of IL2, p21/WAF1/CDKN1A, GADD153, and p16/CDKN2A promoter luciferase reporters. Cells were untreated, stimulated with PMA and ionomycin alone, or stimulated with PMA and ionomycin in the presence of sodium butyrate (NaBu), suberoylanilide hydroxyamic acid (SAHA), or TSA (Right).
To look for functional correlations that might explain the distinction between the patterns of transient versus sustained induction of p300 recruitment, we compared the domain requirements of the IL2 and p21/WAF1/CDKN1A promoters for p300-dependent coactivation by measuring their transcriptional induction after exogenous expression of either a full-length or C-terminal truncation of p300 in luciferase reporter assays (Fig. 1C). Although the IL2 promoter is readily induced (>2.5-fold) by overexpression of the C-terminal truncation of p300, the p21/WAF1/CDKN1A promoter is not (Fig. 1C Left). A major functional portion absent in the C-terminal truncation of p300 is the histone/protein acetyltransferase domain. Furthermore, p21/WAF1/CDKN1A expression has been shown to be induced in the presence of histone deacetylase inhibitors (16), whereas similar agents are known to repress the IL2 gene (17). Therefore, the influence of three different histone deacetylase inhibitors, sodium butyrate (NaBu), suberoylanilide hydroxamic acid, and TSA, on the transcriptional activity of IL2, p21/WAF1/CDKN1A, p16/CDKN2A, and GADD153/DDIT3 was compared (Fig. 1C Right). Although all three histone deacetylase inhibitors either had no effect or suppressed the mitogen-induced transcriptional activation of IL2, they each produced significant stimulation of the p21/WAF1/CDKN1A, p16/CDKN2A, and GADD153/DDIT3 promoters (Fig. 1C Right). These findings suggest that the pattern of p300 recruitment at genes induced during T cell activation may reflect their local requirement for protein acetylation.
Inducible recruitment of p300 occurs through direct protein–protein interactions with sequence-specific factors bound to cognate cis-elements residing in the gene-regulatory regions of target genes (10). To examine whether a correlation exists between the kinetic pattern of p300 recruitment and the primary sequence of targeted genes, the promoter regions of p21/WAF1/CDKN1A, p16/CDKN2A, and GADD153/DDIT3 were compared (Fig. 2A). All three promoters shared five to six binding motifs previously known to regulate p21/WAF1/CDKN1A and recruit p300 (see Fig. 2 A–C and Table 2, which is published as supporting information on the PNAS web site). These motifs include binding sites for Sp1, ZBP89, Ets, EGR1, and C/EBP (16, 18–22) (Table 2). In addition, all three promoters have similar GC contents, in contrast to IL2, and the majority (>58%) of the shared motifs are found in promoter regions evolutionarily conserved in the mouse (Fig. 2B).
Extended bioinformatic comparison of the promoter sequences of p21/WAF1/CDKN1A, p16/CDKN2A, and GADD153/DDIT3 reveals that these genes have in common two overlapping promoter structures or “frameworks” characterized by similar composition and arrangement of transcription factor-binding motifs (Fig. 2C) (23). Framework A (model A) contains a subset of the motifs shown in Fig. 2 A and B in addition to binding sites for myeloid zinc finger protein (MZF), a Kruppel family member expressed in marrow, brain, and thymus (24), and the muscle initiator sequence (MINI), a motif commonly found in muscle-specific genes (25) (Table 2). To determine whether or not framework A has broader implication in the regulation of other genes, the human genome was searched for additional promoters that contained framework A. Remarkably, this search identified eight additional genes (Fig. 2D). These genes included the matrix metalloproteinase MMP23, a second promoter of CDKN2A driving the transcript for p14ARF/INK4b, the fork-head transcription factor FOXG1B, p57/KIP2/CDKN1C, RUNX/AML1, the natriuretic peptide receptor B/guanylate cyclase B NPR2, and two phosphodiesterases, PDE4A and PDE4C.
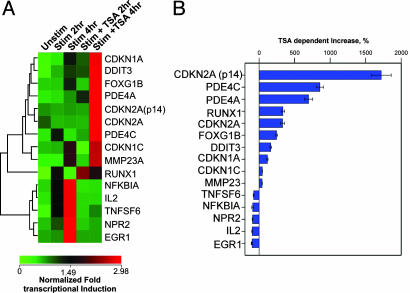
Functional comparison of the endogenous expression of this predicted class of genes reveals that not only are seven of the eight genes induced (3.5- to 92-fold) in mitogen-stimulated T cells (Fig. 3A), but the mitogen induction is potentiated also by the addition of the protein deacetylase inhibitor TSA in seven of the eight genes (40–1,700% increase) (Fig. 3 and Table 3, which is published as supporting information on the PNAS web site). Such properties provide clear statistical separation between this group and other genes that show p300 recruitment patterns distinct from of p21/WAF1/CDKN1A, p16/CDKN2A, and GADD153/DDIT3 (see Figs. 3A and 1B). Similarly, most of the binding motifs held in common between the genes are found in evolutionarily conserved promoter regions (Fig. 4). Finally, seven of these eight promoters have comparably high GC content (compare Figs. 2B and 4).
Fig. 3.
Analysis of framework model A predicted genes. Mitogen and mitogen/TSA sensitivity of predicted gene transcript levels. Two and 4 h after stimulation with P/I in the presence or absence of TSA, real-time RT-PCR was used to determine the relative fold induction change in transcript levels in the treated cells. (A) Comparison of framework model A gene mitogen and mitogen/TSA induction profiles by hierarchical clustering. (B) Comparison of the influence of TSA on the mitogen-induced transcript levels after 4 h of stimulation (see Table 3). ACTB was used for normalization.
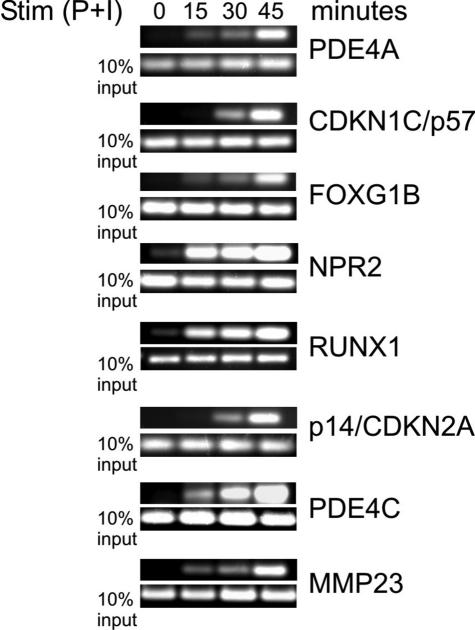
Biologically active genomic regions in control of important functions frequently contain sequences that are conserved across species (26). Accordingly, the search for evolutionarily conserved sequences has become a reliable strategy for uncovering genomic sequences with functional activity (26). The approach described in this study follows this logic in a reverse manner. Promoters are first grouped according to biological activity by measuring their pattern of p300 recruitment and sensitivity to histone deacetylase inhibitors. Next, the group is assessed for similarities in promoter sequence composition and structure. These similarities, further substantiated by their conservation across species, are then used to identify other genes predicted to show similar biological activity and sequence conservation. Convincing evidence in support of this approach is provided by the shared sensitivity of the predicted gene class to histone deacetylase inhibitors (Fig. 3). An equally important validation is a confirmation that this strategy can accurately predict the in vivo pattern of p300 association with genes included in this class. By ChIP, all eight members of this class demonstrate an induced and sustained association with p300 (Fig. 5). The high correlation between these functional parameters and the common features of promoter structure provides compelling molecular validation of the logic, empirical utility, and predictive power of this “reverse genomic” approach.
Fig. 5.
Functional validation of promoter class prediction. ChIP analysis of framework model A predicted genes.
Discussion
The 3 billion base pairs of the human genome is a generally static “flat file” encoding the complete working manual for determining cellular and organismal responses to thousands of extracellular stimuli and physiological events. Rapid and cohesive interpretation of this blueprint is the definitive determinant of cellular behavior. Collectively, the proteomic components of the nucleus function as the relational database that collates and interprets these genomic files with differentially assigned indices and search tables dependent on cell type and circumstance. Effective decoding of this gene-regulatory language will require aggressive integration of computational and bioinformatic approaches that incorporate relevant empirical molecular parameters as key biological references (27). In this work, we show that the kinetics of how transcriptional complexes form at targeted genes, as measured by ChIP, can yield valuable information reflected in the gene's promoter composition, structure, and mode of regulation.
The pattern of sustained inducible association with p300 and up-regulation by protein deacetylase inhibitors indicates that the class of genes (identified by framework A in this study) has specific requirements for the unaltered association of p300 histone/protein acetyltransferase activity. Most of these genes contain CpG islands where local methylation and histone acetylation has significant regulatory influence (Table 4, which is published as supporting information on the PNAS web site). Moreover, these genes play prominent roles in cell-cycle regulation, DNA repair, and cellular differentiation, and their altered expression is often linked to specific forms of cancer (Table 4 and ref. 28). Given these important functional relationships and the recognized role of p300 as a tumor suppressor, it is very likely that p300-associated promoter frameworks may act as selective genomic signatures that facilitate the grouped targeting of specific gene classes for epigenetic regulation (29).
Although this reverse genomic utilization of empirical and bioinformatics data has significant implication for developing more insightful approaches to interpreting gene regulatory structure (27), current methods of screening for protein-associated sequences by ChIP are both laborious and time-consuming. This simple approach is therefore not suitable as a general screening method. However, recent advances by several groups have demonstrated that the ChIP method can be effectively adapted to take advantage of the miniaturization and high-throughput capacity of microarray technology (referred to as “ChIP to Chip”) (30–33). To test the feasibility of combining our reverse genomic approach with this recent technology, most of the genes analyzed in this study were rescreened by “ChIP to Chip” (Figs. 8 and 9, which are published as supporting information on the PNAS web site). This method identified a promoter class with significant resemblance (P « 0.0001) to the gene class described in Fig. 2. Therefore, the application of this approach on a genome-wide scale is achievable.
The regulatory language of the genome is very likely to have the complexity and nuances of the spoken word. Rather than universal, the promoter structure or framework identified in this study is likely to be cell- and stimuli-specific. Moreover, this promoter framework cannot be assumed to comprehensively identify all genes with similar patterns of p300 recruitment. Although CFLAR showed a p300 recruitment pattern similar to that of the genes with the framework described in this article, its promoter sequence is highly AT-rich and shares no common framework with the other genes. Similarly, the other genes that showed more variable p300 recruitment patterns with some resemblance to p21/WAF1/CDKN1A, p16/CDKN2A, and GADD153/DDIT3 (including CFLAR, ITK, DUSP2, CDC25A, MAPK13, and BRCA1) shared no common promoter framework. The frameworks identified in the future are likely to have many of the idiomatic properties of conversational language with heavy influence from locale (cell context) and circumstance (stimulatory event). Advances in the detection and analysis of protein–DNA interactions, combined with greater bioinformatic capability and a wider application of these approaches to the analysis of multiple factors under diverse conditions, will help establish an operational strategy through which the regulatory linguistics of the genome will be revealed.
Acknowledgments
We thank D. Longo, T. Misteli, G. Hager, K. Becker, P. Schwartzberg, D. Clark, and H. Young for critical reading of the manuscript. This work was supported by National Institutes of Health Grant RO1 DK55732 (to J.L.M.).
This paper was submitted directly (Track II) to the PNAS office.
Abbreviations: PMA, phorbol myristate acetate; TSA, trichostatin A; ChIP, chromatin immunoprecipitation.
References
- 1.Levine, M. & Tjian, R. (2003) Nature 424, 147–151. [DOI] [PubMed] [Google Scholar]
- 2.Michelson, A. M. (2002) Proc. Natl. Acad. Sci. USA 99, 546–548. [DOI] [PMC free article] [PubMed] [Google Scholar]
- 3.Wyrick, J. J. & Young, R. A. (2002) Curr. Opin. Genet. Dev. 12, 130–136. [DOI] [PubMed] [Google Scholar]
- 4.Orphanides, G. & Reinberg, D. (2002) Cell 108, 439–451. [DOI] [PubMed] [Google Scholar]
- 5.Narlikar, G. J., Fan, H. Y. & Kingston, R. E. (2002) Cell 108, 475–487. [DOI] [PubMed] [Google Scholar]
- 6.Ogryzko, V. V., Schiltz, R. L., Russanova, V., Howard, B. H. & Nakatani, Y. (1996) Cell 87, 953–959. [DOI] [PubMed] [Google Scholar]
- 7.Segal, E., Shapira, M., Regev, A., Pe'er, D., Botstein, D., Koller, D. & Friedman, N. (2003) Nat. Genet. 34, 166–176. [DOI] [PubMed] [Google Scholar]
- 8.Halfon, M. S., Grad, Y., Church, G. M. & Michelson, A. M. (2002) Genome Res. 12, 1019–1028. [DOI] [PMC free article] [PubMed] [Google Scholar]
- 9.Smith, J. L., Collins, I., Chandramouli, G. V., Butscher, W. G., Zaitseva, E., Freebern, W. J., Haggerty, C. M., Doseeva, V. & Gardner, K. (2003) J. Biol. Chem. 278, 41034–41046. [DOI] [PubMed] [Google Scholar]
- 10.Goodman, R. H. & Smolik, S. (2000) Genes Dev. 14, 1553–1577. [PubMed] [Google Scholar]
- 11.Chaudhry, S., Freebern, W. J., Smith, J. L., Butscher, W. G., Haggerty, C. M. & Gardner, K. (2002) J. Immunol. 169, 6767–6778. [DOI] [PubMed] [Google Scholar]
- 12.Lee, S. J., Ha, M. J., Lee, J., Nguyen, P., Choi, Y. H., Pirnia, F., Kang, W. K., Wang, X. F., Kim, S. J. & Trepel, J. B. (1998) J. Biol. Chem. 273, 10618–10623. [DOI] [PubMed] [Google Scholar]
- 13.Luethy, J. D., Fargnoli, J., Park, J. S., Fornace, A. J., Jr., & Holbrook, N. J. (1990) J. Biol. Chem. 265, 16521–16526. [PubMed] [Google Scholar]
- 14.Yuan, W., Condorelli, G., Caruso, M., Felsani, A. & Giordano, A. (1996) J. Biol. Chem. 271, 9009–9013. [DOI] [PubMed] [Google Scholar]
- 15.Diehn, M., Alizadeh, A. A., Rando, O. J., Liu, C. L., Stankunas, K., Botstein, D., Crabtree, G. R. & Brown, P. O. (2002) Proc. Natl. Acad. Sci. USA 99, 11796–11801. [DOI] [PMC free article] [PubMed] [Google Scholar]
- 16.Bai, L. & Merchant, J. L. (2000) J. Biol. Chem. 275, 30725–30733. [DOI] [PubMed] [Google Scholar]
- 17.Takahashi, I., Miyaji, H., Yoshida, T., Sato, S. & Mizukami, T. (1996) J. Antibiot. (Tokyo) 49, 453–457. [DOI] [PubMed] [Google Scholar]
- 18.Mink, S., Haenig, B. & Klempnauer, K. H. (1997) Mol. Cell. Biol. 17, 6609–6617. [DOI] [PMC free article] [PubMed] [Google Scholar]
- 19.Kraus, W. L., Manning, E. T. & Kadonaga, J. T. (1999) Mol. Cell. Biol. 19, 8123–8135. [DOI] [PMC free article] [PubMed] [Google Scholar]
- 20.Yang, C., Shapiro, L. H., Rivera, M., Kumar, A. & Brindle, P. K. (1998) Mol. Cell. Biol. 18, 2218–2229. [DOI] [PMC free article] [PubMed] [Google Scholar]
- 21.Silverman, E. S., Du, J., Williams, A. J., Wadgaonkar, R., Drazen, J. M. & Collins, T. (1998) Biochem. J. 336, 183–189. [DOI] [PMC free article] [PubMed] [Google Scholar]
- 22.Cram, E. J., Ramos, R. A., Wang, E. C., Cha, H. H., Nishio, Y. & Firestone, G. L. (1998) J. Biol. Chem. 273, 2008–2014. [DOI] [PubMed] [Google Scholar]
- 23.Werner, T. (2000) Methods Mol. Biol. 132, 337–349. [DOI] [PubMed] [Google Scholar]
- 24.Gaboli, M., Kotsi, P. A., Gurrieri, C., Cattoretti, G., Ronchetti, S., Cordon-Cardo, C., Broxmeyer, H. E., Hromas, R. & Pandolfi, P. P. (2001) Genes Dev. 15, 1625–1630. [DOI] [PMC free article] [PubMed] [Google Scholar]
- 25.Wasserman, W. W. & Fickett, J. W. (1998) J. Mol. Biol. 278, 167–181. [DOI] [PubMed] [Google Scholar]
- 26.Pennacchio, L. A. & Rubin, E. M. (2001) Nat. Rev. Genet. 2, 100–109. [DOI] [PubMed] [Google Scholar]
- 27.Haggerty, T. J., Zeller, K. I., Osthus, R. C., Wonsey, D. R. & Dang, C. V. (2003) Proc. Natl. Acad. Sci. USA 100, 5313–5318. [DOI] [PMC free article] [PubMed] [Google Scholar]
- 28.Mendelsohn, J., Howley, P. M., Israel, M. A. & Liotta, L. A. (2001) The Molecular Basis of Cancer (Saunders, Philadelphia).
- 29.Gayther, S. A., Batley, S. J., Linger, L., Bannister, A., Thorpe, K., Chin, S. F., Daigo, Y., Russell, P., Wilson, A., Sowter, H. M., et al. (2000) Nat. Genet. 24, 300–303. [DOI] [PubMed] [Google Scholar]
- 30.Lieb, J. D., Liu, X., Botstein, D. & Brown, P. O. (2001) Nat. Genet. 28, 327–334. [DOI] [PubMed] [Google Scholar]
- 31.Weinmann, A. S., Yan, P. S., Oberley, M. J., Huang, T. H. & Farnham, P. J. (2002) Genes Dev. 16, 235–244. [DOI] [PMC free article] [PubMed] [Google Scholar]
- 32.Ren, B., Cam, H., Takahashi, Y., Volkert, T., Terragni, J., Young, R. A. & Dynlacht, B. D. (2002) Genes Dev. 16, 245–256. [DOI] [PMC free article] [PubMed] [Google Scholar]
- 33.Martone, R., Euskirchen, G., Bertone, P., Hartman, S., Royce, T. E., Luscombe, N. M., Rinn, J. L., Nelson, F. K., Miller, P., Gerstein, M., et al. (2003) Proc. Natl. Acad. Sci. USA 100, 12247–12252. [DOI] [PMC free article] [PubMed] [Google Scholar]


