

Abstract
Of the 10 leading causes of death in the US, 6 are related to diet. Unfortunately, methods for real-time assessment and proactive health management of diet do not currently exist. There are only minimally successful tools for historical analysis of diet and food consumption available. In this paper, we present an integrated database system that provides a unique perspective on how dietary assessment can be accomplished. We have designed three interconnected databases: an image database that contains data generated by food images, an experiments database that contains data related to nutritional studies and results from the image analysis, and finally an enhanced version of a nutritional database by including both nutritional and visual descriptions of each food. We believe that these databases provide tools to the healthcare community and can be used for data mining to extract diet patterns of individuals and/or entire social groups.
Index Terms: dietary assessment, mobile telephone, image analysis, database, geolocation
1. INTRODUCTION
There is a health crisis in the US related to diet, including obesity, cancer, diabetes, and heart disease, that is further exacerbated by our aging population and sedentary lifestyles. Of the 10 leading causes of death in the US, 6 are related to diet. Unfortunately, methods for real-time assessment and proactive health management of diet do not currently exist. There are only minimally successful tools for historical analysis of diet and food consumption available. Dietary assessment, the process of determining what someone eats during the course of a day, provides valuable insight for mounting intervention programs for the prevention of many chronic diseases.
Early adolescents, ages 11 to 14 years, in particular, are in that period of life when the novelty and curiosity of assisting in or self-reporting of food intake starts to wane and the assistance from parents is seen as an intrusion [1]. The use of modern technology, such as mobile telephone cameras or other handheld devices, may provide a way for engaging adolescents and children.
A step towards dietary assessment using electronic handheld devices is to make use of the integrated digital camera in a mobile telephone to take images of food to estimate the food and beverage intake. The importance of using an image food record approach versus classical food record approaches (handwritten records) has been highlighted in [2, 3]. Adolescents showed a strong preference for using methods that incorporate technology such as capturing images of food.
In [4] a development of a dietary assessment system was proposed. The goal is to develop a tool that will reduce user burden while providing accurate estimates of energy and nutrient intake. It consists of a mobile device food record (mdFR) system to automatically identify and quantify foods and beverages consumed using image analysis. Each food item in the image is segmented, identified, and its volume is estimated. Images captured “before” and “after” meals are used to estimate the food intake. From this information, the energy and nutrients consumed can be determined. Figure 1 shows an overview of their system, including image analysis and energy and nutrient estimation. The first step is to send the image acquired with the mobile telephone and metadata to the server for automatic food identification and volume estimation (steps 2 and 3) [5, 6, 7]. These results are sent back to the user where the user confirms and/or adjusts this information (step 4). In step 5, the server receives the confirmed information from the user and extracts the nutrient information using the USDA Food and Nutrient Database for Dietary Studies (FNDDS) database. FNDDS is a database containing foods eaten in the U.S., their nutrient values, and weights for different standardized food portions [8] (step 6). Finally these results can be sent to the research community for further analysis (step 7). The proposed system generates large amounts of raw and processed data that needs to be stored and indexed in a structured manner.
Fig. 1.
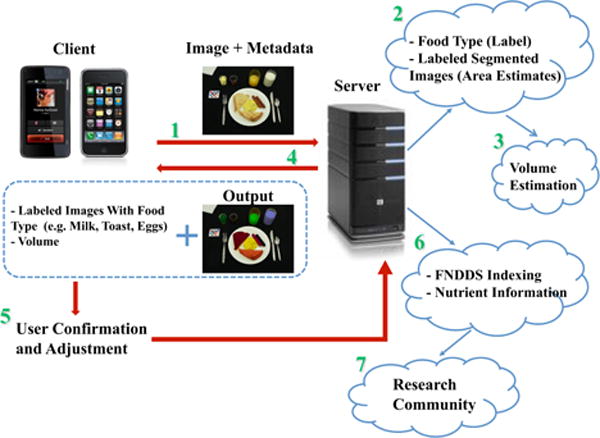
System overview for dietary assessment. Adapted from Zhu et. al. [5].
In this paper, we describe an integrated database system to address the needs of a mdFR. Three unique interconnected databases have been developed; an image database that contains data generated by the images in a mdFR, an experiments database that contains data related to user studies and results from the image analysis experiments, and an enhanced version of the FNDDS database, which includes both nutritional and visual descriptions of each food. Overall these databases are collections of the following types of data: Images of food acquired by users, the food’s nutritional information, a user’s information, meal occasion information, metadata from the images, image analysis results, and visual food descriptors. This collection of data provides information that far exceeds the information available in conventional nutritional databases such as the FNDDS. Typically nutritional databases contain only nutrition information of foods. In addition, we have created a web-based graphical user interface so nutritionists/dietitians/researchers can access the data available in all three databases. In [9], an online food-logging system is described that automatically distinguishes food images from other images, analyzes the food balance, and visualizes the log. Other internet-based tools and services to help monitor nutrition habits of users have emerged as possible substitutes for the conventional paper-and-pencil methods [10, 11]. There are also various food image databases available such as StockFood [12], Food Testing Image Database from Appealing Products, Inc. [13], and Food-Image.com [14]. While these applications are interesting, they usually have no connection to nutrition information databases and it is not clear how they can be used for dietary assessment.
Our contributions to the area of dietary assessment through the use of the database system described in this paper include:
A web-based interface for nutritionists, dietitians, and researchers for guidance and monitoring of patients.
An extension of the USDA Food and Nutrient Database for Dietary Studies (FNDDS) database to include image related data.
A platform to explore and discover embedded patterns in dietary habits.
2. DATABASE SYSTEM DESCRIPTION
We have designed and implemented three databases for storing the data generated, directly or indirectly (by image analysis), by users of a mobile device food record (mdFR) system. Figure 2 shows the information stored in each database subsystem.
Fig. 2.
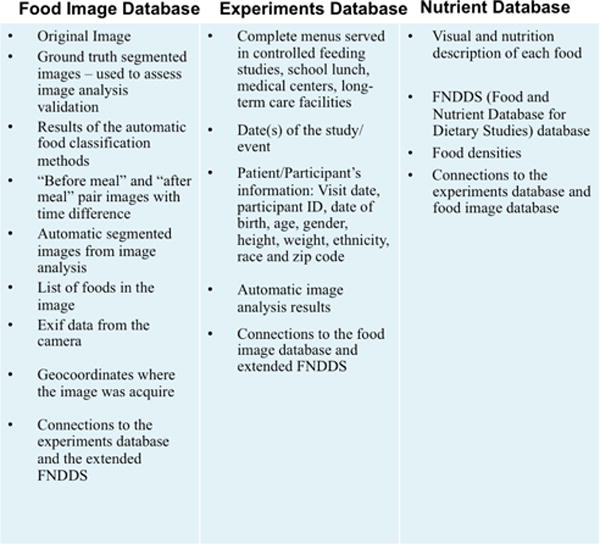
The main components and contents for each database.
2.1. The Food Image Database
This section describes the food image database, which contains data generated by the image during image capture. To date we have more than 8000 food images. When a user captures an image, this image is sent to the server where it is added to the image database and made available for image analysis. The results of the image are also stored in this database subsystem. The goal of the image analysis is to identify and quantify the food and beverage in the scene. The results of the automatic classification methods include segmentation masks and food identification labels for each food item. Ground truth information is also available for many of the nutrition studies we have done. By ground truth information, we mean an extensive image dataset with ground truth segmentation. The metadata associated with each image is also captured. This metadata includes the EXIF (Exchangeable image file format) data from the camera such as camera model, aperture, focal length, brightness, flash information, orientation, color space, white balance, mettering mode, timestamp [15]. In the mdFR system, EXIF data is used to evaluate the image analysis performance across different camera models, and other EXIF parameters. We also capture, if available, the GPS information including the geolocation coordinates where the image was acquired, and the GPS timestamp. This information is used in the discovery and analysis of dietary pattern, as described below.
Metadata can play an important role in the image analysis, it contains information that can be used to obtain patterns of dietary habits of the use. For example, from images that children acquired at school we can use the geolocation and the timestamp information to determine what food was served at school since many schools post their menus in advance and this information can be incorporated into our database. Currently, we are exploring Google Maps API Family to retrieve restaurant information (menus) from restaurants that are located close to where the image was acquired and use this information as “side information” in the image analysis. The timestamp data can be used to estimate the time elapsed between the beginning and end of a meal and has been used as a “reminder function” on the mobile telephone so that the user is prompted to acquire the “after” meal image after finishing his/her meal.
2.2. The Experiments Database
The Experiments database contains information related to each user study. We need to distinguish between two types of studies: Controlled studies and free-living studies. Controlled studies are unique because participants eat their meals under a controlled environment including food types, lighting conditions, dinnerware (plates, glasses and silverware), and others. During free-living studies participants carry on with their normal daily life and acquire the meal images as they would in a normal life scenario: eating on the go, meetings, fast-food dinners, at home watching TV, and many other situations. The type of information that we can obtain is different for each study type. As an example, in the controlled nutritional studies some of the information that we incorporate in the experiments database are the information of the menus served: foods, meal occasions, dates and times. In this database there is also the basic information that we collect from the participants: Visit date, participant ID, date of birth, age, gender, height, weight, ethnicity, race, and zip code.
In the experiments database the image analysis results are linked to the image database for each type of food. Figure 3 shows a screenshot from our database front-end web interface with a sample result used to evaluate the performance of the methods that were studied in the image analysis process, such as the types of segmentation techniques used, features extracted for a particular food item, or the classification method used.
Fig. 3.
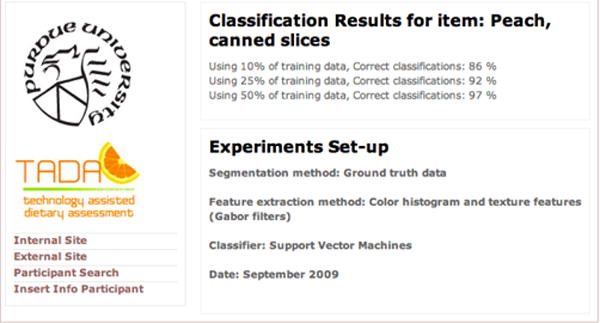
An example of image analysis results in terms of classification accuracy for a particular food item (Peach).
2.3. Extension of FNDDS
Our goal is to augment an existing critical food database with the types of information needed for dietary assessment from the analysis of food images and other metadata. Our proposed database is an extension of the USDA FNDDS [8]. The FNDDS is a public database of foods, their nutrient values, and weights for typical food portions. FNDDS has 11 different tables including primary descriptions for approximately 7,000 food items, weights in grams for various portions of each food (around 30,000 weights), complete nutrient profile (food energy and 60 nutrient/food components), description and measurement units for nutrients, descriptions for about 6,500 similar food items associated with specific main food items. Each food is described by an 8-digit unique food code. In order to estimate energy and nutrients of food and beverage from the food images the FNDDS is used. However, the FNDDS does not provide all the information needed to determine the nutrients from the analysis of a food image. An example of information missing in the FNDDS is density information. Once the volume estimate for a food item is estimated from image analysis, it must be converted to a mass for energy and nutrient estimation. In order to do so the densities of the food items must be known so that gram weight of food intake can be appropriately determined. Stella et. al. in [16] and Kelkar et. al. in [17] presented tools to estimate densities of foods listed in the FNDDS.
Our extension of the FNDDS includes food density information. How this information is being populated into the database is beyond the scope of this paper but it must be emphasized that this information is not currently available in the FNDDS but is critical for the estimate of nutrient information from the analysis of food images.
Besides the density information we feel it is important to also include “visual descriptions” of the food items. These features or descriptors describe how a food is characterized by an image of the food item. These features and measures describing elementary visual characteristics can be grouped together forming a collection of metadata that we call the Visual Characterization Metric (VCM). The VCM provides a unique way for food to be indexed in the food database and will also provide the research community the features needed to recognize food items from food images. The VCM is assigned to their respective foods, just as food codes are now assigned to foods within the FNDDS food database. The VCM consists of features that can be used to uniquely identify the food using image analysis methods. These include image, volume, and density characteristics such as color, shape, texture, 3D volume, reflectivity, spectral information, type index (solid/liquid), density type (based on the measurement used) and non-image based metadata (prepared/non-prepared food). For the final version of the VCM, a standard reference language must be developed to describe it. This will be accomplished using Description Definition Languages (DDL) defining the syntax rules to define/combine/modify/extend the descriptors similar to what is done in MPEG-7 [18], MPEG-21 [19], or Dublin Core [20]. Figure 4 shows an example of a visual description of a food and its associated VCM.
Fig. 4.
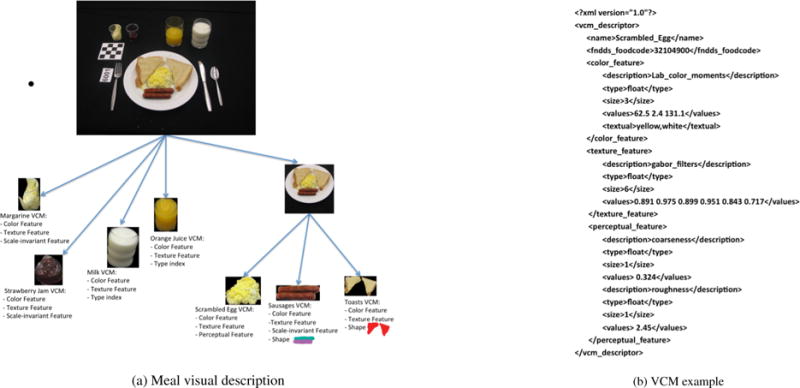
Illustration of the Visual Characterization Metric (VCM) (a) shows the structure for visual descriptions for each food item, (b) an example of a VCM.
3. APPLICATIONS
3.1. Databases as part of the mdFR
In the introductory section of this paper we described the basic data flow of the mdFR (see Figure 1) [4]. Extending this description of the mdFR we can use the database structure that we have described above. Every time the user sends images to the server for analysis, the databases create new entries and attributes for each new image, image metadata, and results generated from the automatic image analysis and volume estimation. A front-end web-server has been developed to allow for real time access to the image and related data stored in the databases. For example, a researcher could have real time access to the nutritional information of the foods and beverages in the image that the user recently captured.
The databases are the elements that coordinate the information exchanged between the client and the server, the image analysis and volume estimation process with the communications layer at the server, and finally the web-based graphical user interface front-end with the back-end database structure. Figure 5 illustrates the high-level interactions of the databases with the rest of the mdFR system.
Fig. 5.
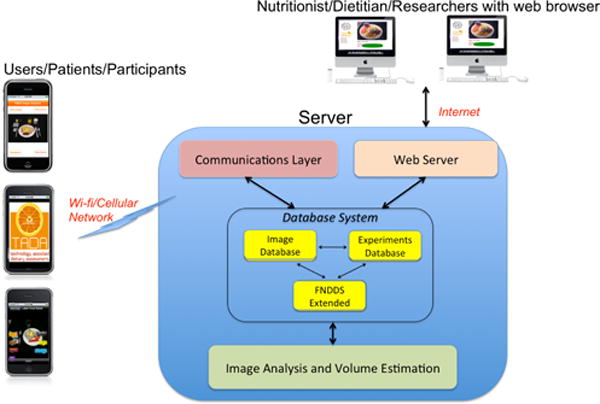
Databases interaction with the mdFR system.
The security and privacy of the data generated by the mdFR are critical. There is a growing concern on privacy issues, particularly with the possibility to capture the geolocation coordinates from the image. For this reason all users and participants in our studies are uniquely identified with a code - names, address, and other identifying information is not stored in our databases. All communications with the database server are fully encrypted (SSL - third party escrow certificate), and the images have a digital watermark embedded with copyright data.
3.2. Food image databases as a dietary assessment tool
Methods and tools to assess dietary intake are changing. It is our understanding that images will play an important role in dietary assessment, gradually becoming a focal point of this process. For this reason we have created a database system in such a way that the three databases are interconnected. Each can exploit all of the features and fields of the other two and enhance the quality of the information provided by each individual database. The central component that unites the databases is the food image, see Figure 6. To make all the information related to the image available to the nutritionist/dietitian/researcher in a meaningful manner we have constructed a web-based front-end.
Fig. 6.
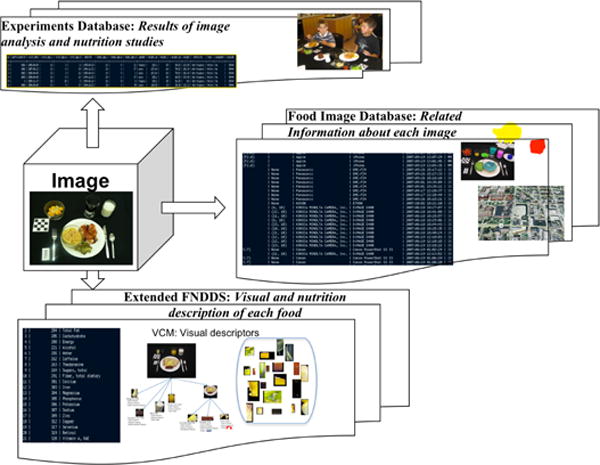
The image as the central component of the database system.
This web-based front-end includes a graphical user interface that provides a unique tool for nutritionists/dietitians/researchers to access information from all three databases. They can select any image on the database, and once a particular image is selected, the main information related to this image is displayed. Each set of information has a hyperlink associated that executes a particular query in the database and displays the results that could come from the image database, experiments database, and/or the extension of the FNDDS database. For example, if the nutritionist/dietitian/researcher clicks on the date that the image was acquired, a list of images taken on that same day will be displayed. Similarly, the nutritionist/dietitian/researcher can select one particular participant that he/she is interested in, examine the participant information and use the available links to view other participants with same characteristics, e.g., participants of age 15, participants with the same gender, and many combinations of these characteristics, for example, weight of participants living in the same geographical area and being 12 years old. Metadata related to the original image is also shown: EXIF data and geolocation coordinates are displayed with its embedded hyperlinks to view, for instance, all the images taken with the same camera, other images with the same focal length, or the geographic area where the image was acquired using any online commercial maps tool. Similar interactions would lead to the information available in FNDDS for further dietary analysis.
In summary, the image database, the experiments database, and the FNDDS front-end consist of multiple relations which are linked together conceptually via entity-relationship links. In addition, we have developed a series of multidatabase queries to access information and attributes in all three databases from a single request. It is our understanding that having information related to the images, linked to nutritional information of the foods appearing in the images, linked to the participant who acquired those images and who consumed those foods can facilitate the task of nutritionists/dietitians/researchers in understanding dietary behaviors. Note that all the relevant information stored in the databases is available under a user-friendly graphical user interface with embedded queries accessible via hyperlinks so that the researcher does not need to know any syntax and semantic knowledge of the query language. Basically, if the data are stored in the database, it is available through the website front-end in an intuitive manner.
4. DISCUSSION AND CONCLUSIONS
Dietary monitoring is the next frontier in advancing interactive science with the potential to improve the lives of millions. Maintaining good health and quality of life means being able to access and participate in the management of long-term health choices rather than the traditional approach of medicating acute conditions with powerful drugs. Diet is a crucial health decision that is made every day by everyone. Yet, most people are unaware of their actual dietary intake.
In this paper we described an integrated database system to address the needs of a mobile telephone food record (mdFR) used for dietary assessment. The overall goal of this approach is to use image analysis methods on food images to determine the nutrient values of foods a user is consuming and estimate the user’s dietary intake. Three unique interconnected databases have been developed; an image database that contains data generated by the images in a mdFR, an experiments database that contains data related to user studies and results from the image analysis experiments, and an enhanced version of the FNDDS database, which includes both nutritional and visual descriptions of each food. This system will greatly extend the types of analysis of diet that can be done on a larger population. The database system we described in this paper has been implemented using PostgreSQL, which is an open source object-relational database system and is currently being tested.
The use of the proposed databases is not only for data storage; these databases can also be tools for nutritionists/dietitians/researchers to provide a different “perspective” when compared to traditional nutritional databases since the related data of the food images, users, and “eating events” are available. Potential data mining [21, 22] functionality for finding, predicting and extracting patterns for dietary habits and assessment [23] is currently being investigated. This is one application domain that is and will be gaining considerable significance in the near future in the medical and healthcare fields [24, 25]. There has been an effort to explore nutritional databases in order to discover embedded patterns in dietary habits [26, 27].
Acknowledgments
This work was sponsored by grants from the National Institutes of Health under grants NIDDK 1R01DK073711-01A1 and NCI 1U01CA130784-01.
References
- 1.Livingstone M, Robson P, Wallace J. Issues in dietary intake assessment of children and adolescents. British Journal of Nutrition. 2004;92:S213–S222. doi: 10.1079/bjn20041169. [DOI] [PubMed] [Google Scholar]
- 2.Boushey C, Kerr D, Wright J, Lutes K, Ebert D, Delp E. Use of technology in children’s dietary assessment. European Journal of Clinical Nutrition. 2009:S50–S57. doi: 10.1038/ejcn.2008.65. [DOI] [PMC free article] [PubMed] [Google Scholar]
- 3.Six B, Schap T, Zhu F, Mariappan A, Bosch M, Delp E, Ebert D, Kerr D, Boushey C. Evidence-based development of a mobile telephone food record. Journal of American Dietetic Association. 2010 Jan;:74–79. doi: 10.1016/j.jada.2009.10.010. [DOI] [PMC free article] [PubMed] [Google Scholar]
- 4.Zhu F, Mariappan A, Kerr D, Boushey C, Lutes K, Ebert D, Delp E. Technology-assisted dietary assessment. Proceedings of the IS&T/SPIE Conference on Computational Imaging VI; San Jose, CA. January 2008; [DOI] [PMC free article] [PubMed] [Google Scholar]
- 5.Zhu F, Bosch M, Boushey C, Delp E. An image analysis system for dietary assessment and evaluation. Proceedings of the International Conference on Image Processing, ICIP; Hong-Kong, China. September 2010; [DOI] [PMC free article] [PubMed] [Google Scholar]
- 6.Zhu F, Bosch M, Woo I, Kim S, Boushey C, Ebert D, Delp E. The use of mobile devices in aiding dietary assessment and evaluation. IEEE Journal of Selected Topics in Signal Processing. 2010 Aug;4(4):756–766. doi: 10.1109/JSTSP.2010.2051471. [DOI] [PMC free article] [PubMed] [Google Scholar]
- 7.Woo I, Otsmo K, Kim S, Ebert DS, Delp EJ, Boushey CJ. Automatic portion estimation and visual refinement in mobile dietary assessment. Proceedings of the IS&T/SPIE Conference on Computational Imaging VIII; San Jose, CA. January 2010; [DOI] [PMC free article] [PubMed] [Google Scholar]
- 8.USDA food and nutrient database for dietary studies, 1.0. Beltsville, MD: Agricultural Research Service, Food Surveys Research Group; 2004. [Google Scholar]
- 9.Kitamura K, Yamasaki T, Aizawa K. Food log by analyzing food images. Proceedings of the 16th ACM International Conference on Multimedia; New York, NY, USA. 2008. pp. 999–1000. [Google Scholar]
- 10.Jarvinen P, Jarvinen T, Lahteenmaki L, Sodegard C. Hyperfit: Hybrid media in personal nutrition and exercise management. Proceedings of the Second International Conference on Pervasive Computing Technologies for Healthcare; Tampere, Finland. January 2008; pp. 222–226. [Google Scholar]
- 11.iPhone Calorie Counter. Demand Media, Inc; 2010. [Online]. Available: http://www.livestrong.com. [Google Scholar]
- 12.Stockfood - The Food Image Agency. Food pictures for professionals. [Online] Available: http://www.stockfood.com.
- 13.Food Testing Image Database. Appealing Products, Inc; [Online] Available: http://appealingproducts.com/photobank/fpdk/ [Google Scholar]
- 14.Food Photo Gallery by Food-Image.com. [Online]. Available: http://www.food-image.com.
- 15.Japan Electronic Industry Development Association (JEIDA) Design rule for camera file system, version 1.0. 1998 [Google Scholar]
- 16.Stella S, Kelkar S, Okos M. Predicting and 3-d laser scanning for determination of apparent density of porous food. IFT Annual Meeting and Food Expo. 2010 Jul; [Google Scholar]
- 17.Kelkar S, Stella S, Okos M. X-ray micro computed tomography (ct): A novel method to measure density of porous food. IFT Annual Meeting and Food Expo. 2010 Jul; [Google Scholar]
- 18.Manjunath B, Salembier P, Sikora T. Introduction to MPEG-7: Multimedia Content Description Interface. Wiley & Sons; 2002. [Google Scholar]
- 19.Bormans J, Gelissen J, Perkis A. Mpeg-21: The 21st century multimedia framework. IEEE Signal Processing Magazine. 2003;20:53–62. [Google Scholar]
- 20.International Organization for Standardization. Information and Documentation The Dublin Core metadata element set. Brittish Standard; 2009. [Google Scholar]
- 21.Fayyad U, Piatetsky-Shapiro G, Smyth P, Uthurusamy R. Advances in knowledge discovery and data mining. Menlo Park, USA: AAAI/MIT Press; 1996. [Google Scholar]
- 22.Frawley W, Piatetsky-Shapiro G, Matheus C. Knowledge discovery in databases: An overview. AI Magazine. 1992 Oct;13(3):57–70. [Google Scholar]
- 23.Agrawal R, Imielinski T, Swami A. Database mining: A performance perspective. IEEE Transactions on Knowledge and Data Engineering. 1993 Dec;5(6):914–925. [Google Scholar]
- 24.Prather J, Lobach D, Goodwin L, Hales J, Hage M, Hammond W. Medical data mining: knowledge discovery in a clinical data warehouse. Proceedings of the American Medical Informatics Association (AMIA) Annual Fall Symposium; Nashville, USA. October 1997; [PMC free article] [PubMed] [Google Scholar]
- 25.Cios K, Moore G. Uniqueness of medical data mining. Artificial Intelligence in Medicine. 2002 Sep;26(1):1–24. doi: 10.1016/s0933-3657(02)00049-0. [DOI] [PubMed] [Google Scholar]
- 26.Li C. Towards the healthy nutritional dietary patterns. Proceedings of the Fourth International Conference on Digital Information Management; Ann Arbor, USA. November 2009. [Google Scholar]
- 27.Khan M, Muyeba M, Coenen F. On extraction of nutritional patterns using fuzzy association rule mining. Proceedings of International Conference on Health Informatics. 2008:34–42. [Google Scholar]