

Abstract
While the potential for small amounts of motion in functional magnetic resonance imaging (fMRI) scans to bias the results of functional neuroimaging studies is well appreciated, the impact of in‐scanner motion on morphological analysis of structural MRI is relatively under‐studied. Even among “good quality” structural scans, there may be systematic effects of motion on measures of brain morphometry. In the present study, the subjects' tendency to move during fMRI scans, acquired in the same scanning sessions as their structural scans, yielded a reliable, continuous estimate of in‐scanner motion. Using this approach within a sample of 127 children, adolescents, and young adults, significant relationships were found between this measure and estimates of cortical gray matter volume and mean curvature, as well as trend‐level relationships with cortical thickness. Specifically, cortical volume and thickness decreased with greater motion, and mean curvature increased. These effects of subtle motion were anatomically heterogeneous, were present across different automated imaging pipelines, showed convergent validity with effects of frank motion assessed in a separate sample of 274 scans, and could be demonstrated in both pediatric and adult populations. Thus, using different motion assays in two large non‐overlapping sets of structural MRI scans, convergent evidence showed that in‐scanner motion—even at levels which do not manifest in visible motion artifact—can lead to systematic and regionally specific biases in anatomical estimation. These findings have special relevance to structural neuroimaging in developmental and clinical datasets, and inform ongoing efforts to optimize neuroanatomical analysis of existing and future structural MRI datasets in non‐sedated humans. Hum Brain Mapp 37:2385–2397, 2016. © 2016 Wiley Periodicals, Inc.
Keywords: functional neuroimaging, magnetic resonance imaging, motion, bias, cortical thickness, cortical surface area, cortical curvature
INTRODUCTION
Substantial subject movement during brain magnetic resonance imaging (MRI) acquisition decreases scan quality, leading to blurring of gray matter/white matter boundaries and difficulty in identifying crisp borders of brain structures of interest. This issue is especially relevant for pediatric neuroimaging studies given the inverse relationship between in‐scanner motion and age [Satterthwaite et al., 2012]. Conventionally, scans demonstrating obvious motion artifacts are not included in quantitative morphology studies. However, scans that show a small amount of motion artifact but can still be processed by automated image analysis software are often included. If this “micro‐motion” is different between compared groups of interest (e.g., young vs. old, male vs. female, and patient vs. control) it may confound neuroimaging findings attributed to age, sex, or clinical status. Thus, it is important to ascertain the effects of micro‐motion on commonly quantified imaging metrics such as gray and white matter volumes, cortical thickness, and cortical surface area. Particularly relevant is discerning the direction (i.e., increased or decreased) and regional specificity of micro‐motion induced change.
The issue of subject motion has received recent focus for functional neuroimaging methods more extensively than for structural MRI (sMRI). In contrast to sMRI, the focus in functional MRI (fMRI) is mostly on motion that occurs in between acquired image volumes [Friston et al., 1996; Hajnal et al., 1994]. Subjects with high amounts of motion are generally excluded from statistical analyses. In addition, almost all fMRI analyses include a realignment step to correct for small movements taking place in the 1–3 seconds between acquisitions [Cox and Jesmanowicz, 1999; Freire et al., 2002; Friston et al., 1995; Jenkinson and Smith, 2001; Oakes et al., 2005], and the parameters from this realignment step are also commonly included as nuisance regressors in the experimental model [Johnstone et al., 2006]. In particular for resting state fMRI studies of functional connectivity, differential motion can result in spatially heterogeneous differences between groups of subjects that persist even after the above motion correction procedures [Power et al., 2012; Satterthwaite et al., 2012; Van Dijk et al., 2012], although these biases may be reduced or even eliminated by the use of innovative MR sequences [Kundu et al., 2013, 2014] or post‐processing pipelines [Jo et al., 2013; Patel et al., 2014].
Within‐volume motion is a particular problem for high‐resolution structural scans, which may require minutes rather than seconds to collect whole brain images. The physics of distortions caused by motion within the acquisition of a single image have been well documented [Morelli et al., 2011; Wood and Henkelman, 1985]. Motion can result in blurring and/or ghosting artifacts, a series of displaced image repetitions usually in the phase‐encoded direction, depending on the location of the motion in K‐space. These types of artifacts have been demonstrated to impair the diagnostic quality of clinically acquired MRI [Dantendorfer et al., 1997; Morelli et al., 2011; Wood and Henkelman, 1985]. In addition, simulated motion has been predicted to affect automated measures of brain atrophy [Camara‐Rey et al., 2006; Preboske et al., 2006]. Previously, we showed that estimates of gray matter volume are reduced in categorically low quality scans [Blumenthal et al., 2002]. This motion‐related bias in gray matter estimation was recently replicated by a study using surface‐based morphometry to analyze cortical volume (CV) in scans from participants performing an in‐scanner motion task [Reuter et al., 2015].
The present study seeks to refine our understanding of motion‐related biases in morphometric analyses of neuroimaging data by extending previous work in several ways. First, to model the effects of naturalistic rather than consciously produced motion, we use motion estimated from fMRI scans acquired serially with structural scans to estimate subjects' extent of motion during scanning sessions. This methodology could readily be used as a post hoc quality control measure in many previously published and ongoing studies. Second, to better specify the mechanism for motion effects on cortical volume estimation, we quantified relationships between motion and distinct sub‐components of cortical volume—cortical thickness and surface area—in addition to cortical curvature [Desikan et al., 2006; Fischl et al., 2004b], which may reflect differential cortical expansion during development [Ronan and Fletcher, 2014]. Third, we assess the stability of motion‐related biases in anatomical estimation across two distinct image‐processing platforms and developmental windows. Fourth, we assess the convergent validity of two different assays of motion effect, (i) variation in the fMRI proxy described above amongst scans without visible motion artifact, and (ii) an independent contrast between two groups with qualitatively different motion ratings based on visual inspection of raw scans. Fifth, given the observation that motion induces regionally heterogeneous biases in anatomical estimation, we provide a cortex‐wide map of the relationship between local brain displacement and overall motion. Finally, we harness the wide age‐range of our sample to place observed motion effects on anatomy in the context of age‐related anatomical variation. This comparison is critical given the special importance of motion effects for developmental neuroimaging studies seeking to map maturational changes in brain anatomy.
METHODS
Participants
All scans included in this study were gathered as part of the National Institute of Mental Health Intramural Research Program Study of Pediatric Brain Development {Giedd:2015kp}. Analyses relating interindividual differences in micro‐motion to anatomy conducted in a sample of 127 unrelated typically developing individuals with raw scans that did not have any visible signs of motion artifact (age 6–33 years, 64 female subjects). A subanalysis of these data was also performed excluding pediatric subjects (n = 51, age 18–33, 23 female subjects). In an independent analysis, anatomical comparisons of groups with categorically distinct quality ratings (based on visual inspection of raw scans) were conducted in a sample of 274 scans of unrelated individuals aged 5–34 years (Table 1).
Table 1.
Demographic information
| High quality sMRI with fMRI in same scanning session | Categorically lower quality sMRI scans, and matching high quality sample | |||
|---|---|---|---|---|
| Tier 1 | Tier 2 | P value | ||
| N | 127 | 136 | 136 | |
| Age (years) |
Mean = 16.8 SD = 6.9 Range = 6–34 |
Mean = 10.7 sd = 5.6 range = 5–30 |
Mean = 10.7 sd = 5.6 range = 5–30 |
∼1 |
| Gender | 63 Female | 64 female | 64 female | ∼1 |
Image Acquisition
All MRI scans were acquired using a 1.5 T General Electric Signa MRI at the NIH Clinical Center (Bethesda, MD). Structural scanning consisted of a T1‐weighted spoiled gradient echo sequence: echo time (TE) 5 ms; relaxation time (TR) 24 ms; flip angle 45°; matrix 256 × 256 × 124; FOV 24 cm. During the same scanning session, two 3‐minute echoplanar imaging (EPI) scans were acquired with participants lying quietly with eyes closed: TR 2.3 s; TE 40 ms; voxel 3.75 × 3.75 × 5 mm; matrix size 64 × 64; FOV 240 × 240 mm; 27 interleaved slices. The order of acquisition was the same for all participants in the study, with the acquisition of the structural scan always preceding the acquisition of the EPI scans. The EPI scans took place approximately 5–10 minutes following the structural scans. In addition to being counseled extensively on the importance of remaining still in the scanner, all of the subjects were partially restrained with the use of foam pads to the left and to the right of the head.
Morphological Analysis
Each scan was processed using two well validated, commonly used automated routines for MRI analysis: the Montreal Neurological Institute's CIVET pipeline (version 1.1.10) and FreeSurfer (version 5.1). For the CIVET analysis, images were registered into a standardized stereotaxic space by means of a linear transformation and corrected for intensity non‐uniformities [Collins et al., 1994; Sled et al., 1998]. A neural net classifier segmented the spatially transformed and corrected volumes into white matter, GM, cerebrospinal fluid, and background [Tohka et al., 2004]. Inner and outer cortical surfaces were modeled using triangular meshes generated by a constrained Laplacian algorithm (CLASP) [Kim et al., 2005]. In order to estimate cortical structure in native space, we applied an inverse transformation matrix to the cortical surfaces [Im et al., 2006]. Automated parcellation of the cortical surface was performed to extract lobar estimates [Im et al., 2008] of gray matter volume, cortical thickness and surface area.
In the FreeSurfer analysis, raw images were corrected for intensity nonuniformities [Sled et al., 1998] and skull‐stripped to remove non‐brain tissue using a watershed/surface deformation procedure [Ségonne et al., 2004].White matter and subcortical gray matter were segmented [Fischl et al., 2002, 2004a] and the gray/white and gray/CSF surfaces were modeled using a procedure that includes automated topology correction [Fischl et al., 2001; Ségonne et al., 2007] and surface deformation following intensity gradients to define sharp boundaries between tissue classes [Dale et al., 1999; Fischl et al., 1999]. Automated parcellation of the cortical surface into 33 gyral regions per hemisphere were combined to yield lobar estimates of gray matter volume, mean cortical thickness, surface area, and mean/Gaussian curvature [Desikan et al., 2006; Fischl et al., 2004b] as detailed in Supporting Information Table 2.
None of our image processing steps involved manual intervention. This decision was made to ensure technical reproducibility of our study as criteria for training, implementation and monitoring of manual interventions can vary between and within laboratories.
Quantifying Subject Motion
The EPI scans were used to classify subjects according to how much they tended to move during the scanning session. AFNI [Cox, 1996] and FSL [Jenkinson and Smith, 2001; Jenkinson et al., 2002] were used for image processing. The first four EPI volumes were discarded, and the scans were skull‐stripped and motion corrected with a series of rigid body transforms, using the mean across the time series as the reference volume. As a summary measure of motion we used the “framewise displacement” (FD) based on the six parameters from this motion correction procedure [Power et al., 2012]:
where Δd ix = d (i − 1)x − d ix. Rotational displacements were converted from degrees to millimeters by calculating displacement on the surface of a sphere of radius 50 mm.
This procedure yielded a single continuous estimate of “micro‐motion” for each participant in Tier 1.
We also performed a voxel‐specific estimate of displacement. The series of affine transformations from the motion correction was applied to each voxel separately, and the average displacement was calculated as the average frame‐to‐frame Euclidean distance travelled by each voxel. These values were transformed into MNI stereotactic standard space via a two‐step process: from each functional scan to that subject's structural scan using 6 degrees of freedom transformation, and from each structural scan to MNI space using 12 degrees of freedom transformation [Jenkinson and Smith, 2001; Jenkinson et al., 2002]. These subject maps were averaged to yield a population map, which was filtered to include only voxels within gray matter regions in FSL's Harvard–Oxford cortical probabilistic atlas, using a 25% threshold. Finally, for visualization the voxel values were projected on the CIVET triangular mesh using nearest‐neighbor interpolation.
Statistical Analysis
All structural scans in the NIH study of normal development are rated on an ordinal 1–4 scale by an expert rater [Blumenthal et al., 2002]. Our analysis of the effect of small amounts of in‐scanner motion consisted only of subjects with 1st tier structural scans who also received fMRI during the same scanning session (for demographic information see Table 1). For each brain region and morphological property, a linear model was fit using the continuous estimates of micro‐motion derived from the fMRI scans as the independent variable and age and gender as covariates [R Core Team, 2012]. In other words, we tested the hypothesis that inter‐subject estimates of regional morphological properties, for example, frontal lobe gray matter volume, are affected by intersubject variability in in‐scanner motion.
In an additional analysis, we explored the effect of grossly observable motion artifact (henceforth “frank motion”), using a sample of 136 subjects with categorically lower quality (2nd tier) structural scans (see Table 1 for demographic information). These 2nd tier scans were age‐ and gender‐matched to another sample of subjects with 1st tier scans, and paired t‐tests were used to compare the output of the morphological analysis. Statistical tests were corrected for multiple comparisons using FDR‐adjusted P values [Benjamini et al., 2006].
Figure 1 provides examples of 1st (both low and high average motion estimates) and 2nd tier scans, along with examples of the cortical surfaces generated for these scans.
Figure 1.
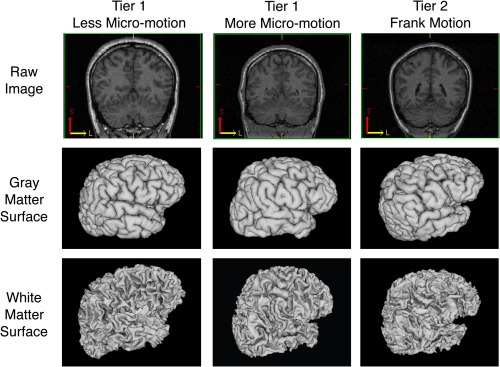
Example of 1st tier scans and 2nd tier scans (less micro‐motion, more micro‐motion and frank motion) along with their cortical surface models as generated by CIVET. [Color figure can be viewed in the online issue, which is available at http://wileyonlinelibrary.com.]
This study used the high‐performance computational capabilities of the NIH Biowulf Linux cluster (http://biowulf.nih.gov).
RESULTS
Micro‐Motion Within Tier 1 Scans
During the same scanning session, motion during one resting‐state EPI scan was highly correlated with motion in a second EPI scan (Pearson's r = 0.66, P < 1.0e‐15), suggesting that this is a reliable estimate of motion during the scanning session (Fig. 2A). The inverse relationship between age and fMRI motion did not reach statistical significance in this data (r = −0.06, P = 0.5), although larger studies have previously demonstrated that such a relationship does exist on average [Satterthwaite et al., 2012]. There was a positive effect for gender such that male subjects on average moved more than female subjects (male mean motion = 0.09 mm, sd = 0.05, n = 64; female mean motion = 0.07 mm, sd = 0.04, n = 63; t = −2.27, P = 0.02). There was no evidence for an interaction between age and gender.
Figure 2.

This figure illustrates the consistency of motion across fMRI scans within the same scanning session, and the association of motion with age and gender. Motion was estimated as the average frame‐to‐frame displacement, calculated using a series of 6‐degrees‐of‐freedom linear transformations. Following (Power et al., 2012), we used the formula, FDi = |Δd ix| + |Δd iy| + |Δd iz| + |Δα i| + |Δβ i| + |Δγ i|, where Δd ix = d (i − 1)x − d ix. Rotational displacements were converted from degrees to millimeters by calculating displacement on the surface of a sphere of radius 50 mm. (A) The average frame‐to‐frame displacement for two fMRI scans within the same scanning session. (B, C) The frame‐to‐frame displacement of the two scans were averaged to show the relationship with age and gender. N = 436 fMRI scans, 218 scanning sessions, 200 individual subjects (107 female), 127 families; mean age = 15.9 years, sd = 6.2, range = 5–34.
Micro‐Motion and Lobar Anatomy
There were significant relationships between micro‐motion and lobar estimates of gray matter volume for both CIVET and FreeSurfer within the frontal and temporal lobe, and for CIVET in the occipital lobe (P < 0.05; see Table 2). For both pipelines, micro‐motion was inversely correlated with volume, such that increased motion resulted in evidently smaller cortical regions. The inverse relationship between subject motion and parietal lobe volume did not reach statistical significance in either pipeline.
Table 2.
Effect of micro‐motion on estimates of cortical gray matter volume, surface area, cortical thickness and surface area (CIVET pipeline and FreeSurfer pipeline)
| Anatomical metric | CIVET processing pipeline | FreeSurfer processing pipeline | ||||
|---|---|---|---|---|---|---|
| Change per 0.1 mm framewise motion (95% CI) | t statistic | P (FDR‐corrected) | Change per 0.1 mm framewise motion (95% CI) | t statistic | P (FDR‐corrected) | |
| Total volumes | ||||||
| Whole brain | −41.4 cm3 (−83.4, 0.5) | −1.94 | 0.055 | −40.7 cm3 (−78.7, −27.2) | −2.1 | 0.038 |
| Gray matter | −34.6 cm3 (−60.5, −8.8) | −2.63 | 0.0096 | −24.0 cm3 (−44.8, −3.3) | −2.27 | 0.024 |
| White matter | −7.6 cm3 (27.6, 12.3) | −0.75 | 0.45 | −15.2 cm3 (−34.4, 4.0) | −1.54 | 0.12 |
| CSF | 0.8 cm3 (−8.0, 9.5) | 0.17 | 0.86 | −1.5 cm3 (−3.9, 1.0) | −1.15 | 0.25 |
| Lobar volume | ||||||
| Frontal | −11.1 cm3 (−19.6, −2.7) | −2.60 | 0.032 | −10.1 cm3 (−17.7, −2.6) | −2.64 | 0.038 |
| Parietal | −2.9 cm3 (−7.3, 1.6) | −1.29 | 0.201 | −5.5 cm3 (−10.8, −0.1) | −2.02 | 0.06 |
| Temporal | −7.9 cm3 (−14.4, −1.4) | −2.39 | 0.032 | −5.0 cm3 (−9.4, −0.7) | −2.29 | 0.048 |
| Occipital | −3.7cm3 (−6.9, −0.5) | −2.29 | 0.032 | −1.6 cm3 (−4.0, 0.7) | −1.35 | 0.18 |
| Lobar surface area | ||||||
| Frontal | −21.7 cm2 (−40.1, −3.3) | −2.31 | 0.091 | −26.8 cm2 (−50.2, −3.5) | −2.25 | 0.09 |
| Parietal | −5.5 cm2 (−17.4, 6.4) | −0.90 | 0.370 | −17.5 cm2 (−35.0,0.1) | −1.95 | 0.09 |
| Temporal | −8.6 cm2 (−19.2, 2.0) | −1.58 | 0.231 | −11.3 cm2 (−23.2, 0.6) | −1.87 | 0.09 |
| Occipital | −5.8 cm2 (−14.7, 3.0) | −1.29 | 0.267 | −4.7 cm2 (−13.6, 4.2) | −1.04 | 0.30 |
| Lobar cortical thickness | ||||||
| Frontal | −0.069 mm (−0.13, −0.005) | −2.10 | 0.053 | −0.017 mm (−0.0580, 0.0241) | −0.81 | 0.84 |
| Parietal | −0.031 mm (−0.087, 0.026) | −1.07 | 0.288 | 0.002 mm (−0.0418, 0.0448) | 0.07 | 0.94 |
| Temporal | −0.070 mm (−0.13, −0.011) | −2.31 | 0.053 | −0.038 mm (−0.0810, 0.0050) | −1.73 | 0.34 |
| Occipital | −0.065 mm (−0.13, −0.004) | −2.08 | 0.053 | −0.009 mm (−0.0456, 0.0282) | −0.46 | 0.86 |
| Lobar mean curvature | ||||||
| Frontal | 0.0026 mm−1 (0.0007, 0.0046) | 2.68 | 0.034 | |||
| Parietal | 0.0012 mm−1 (−0.0012, 0.0036) | 1.02 | 0.62 | |||
| Temporal | 0.0006 mm−1 (−0.0022, 0.0033) | 0.39 | 0.70 | |||
| Occipital | 0.0010 mm−1 (−0.0025, 0.0046) | 0.57 | 0.70 | |||
| Lobar Gaussian curvature | ||||||
| Frontal | −0.0088 mm−2 (−0.0316, 0.014) | −0.76 | 0.60 | |||
| Parietal | 0.0019 mm−2 (−0.0366, 0.0405) | 0.10 | 0.92 | |||
| Temporal | 0.0406 mm−2 (−0.0153, 0.0964) | 1.42 | 0.60 | |||
| Occipital | −0.0108 mm−2 (−0.0334, 0.0119) | −0.93 | 0.60 | |||
Statistical association with micro‐motion for CIVET and FreeSurfer output. Linear models were fit in R with age and gender as covariates. N = 127 subjects (63 females); mean age = 16.8 (sd = 6.9, range = 6–34); average framewise motion = 0.08 mm (sd = 0.04, range = 0.03–0.27); one scan per family.
For CIVET, there was some evidence that the inverse relationship between micro‐motion and gray matter volume was due to an association with estimates of cortical thickness but not estimates of cortical surface area. In particular, there was a trend toward an inverse relationship between micro‐motion and estimates of cortical thickness in the frontal lobe, occipital lobe and temporal lobe (FDR‐corrected P = 0.053; see Table 2), the same regions with significant relationships with motion and volume.
Micro‐motion also showed a negative relationship with estimates of lobar cortical thickness in FreeSurfer, but these associations did not approach statistical significance. Analysis of lobar curvature estimates in FreeSurfer revealed a statistically significant positive association between micro‐motion and mean curvature of the frontal lobe (FDR‐corrected P = 0.03; see Table 2). In contrast, relationships between micro‐motion and Gaussian curvature in FreeSurfer were not significant.
We next reanalyzed the lobar measures including only the 58 adult subjects greater than 18 years old. This was to assess whether our initial findings could have been driven by children, who previous evidence suggests both move more then and are morphologically different from adults. A we had statistically controlled for linear effects of age in analyses combing all ages, it is possible that residual nonlinear effects could have driven some of our results. However, our adult‐only analyses replicated findings of possible motion bias discovered in the larger sample (Table 3).
Table 3.
Effect of micro‐motion on estimates of cortical gray matter volume, surface area, cortical thickness and surface curvature (CIVET pipeline and FreeSurfer pipeline) for adult sample only
| Anatomical metric | CIVET processing pipeline | FreeSurfer processing pipeline | ||||
|---|---|---|---|---|---|---|
| Change per 0.1 mm framewise motion (95% CI) | t statistic | P (FDR‐corrected) | Change per 0.1 mm framewise motion (95% CI) | t statistic | P (FDR‐corrected) | |
| Total brain volume | ||||||
| Gray matter | −47.1 cm3 (−92.7, −1.5) | −2.02 | 0.049 | −42.8 cm3 (−76.6, −9.0) | −2.48 | 0.016 |
| White matter | −22.3 cm3 (−54.7, 10.1) | −1.35 | 0.184 | −33.5 cm3 (−67.3, 0.3) | −1.95 | 0.057 |
| CSF | −6.8 cm3 (−23.2, 9.6) | −0.82 | 0.429 | −2.08 cm3 (−6.8, 2.7) | −0.86 | 0.39 |
| Lobar volume | ||||||
| Frontal | −17.0 cm3 (−31.0, −3.1) | −2.39 | 0.027 | −13.3 cm3 (−24.4, −2.3) | −2.38 | 0.042 |
| Parietal | −3.0 cm3 (−10.7, 4.8) | −0.75 | 0.458 | −3.9 cm3 (−12.7, 4.9) | −0.86 | 0.10 |
| Temporal | −14.5 cm3 (−26.0, −3099) | −2.49 | 0.027 | −8.4 cm3 (−14.9, −1.9) | −2.53 | 0.042 |
| Occipital | −7.0 cm3 (−12.4, −1.6) | −2.55 | 0.027 | −3.6 cm3 (−7.2, 0.1) | −1.92 | 0.08 |
| Lobar surface area | ||||||
| Frontal | −37.2 cm2 (−68.1, −6.4) | −2.36 | 0.056 | −42.4 cm2 (−79.3, −5.5) | −2.26 | 0.11 |
| Parietal | −5.6 cm2 (−28.1, 16.8) | −0.49 | 0.626 | −15.8 cm2 (−45.3, 13.8) | −1.05 | 0.30 |
| Temporal | −21.1 cm2 (−39.3, −2.8) | −2.26 | 0.056 | −16.9 cm2 (−35.5, −1.7) | −1.78 | 0.16 |
| Occipital | −9.7 cm2 (−22.5, 3.1) | −1.49 | 0.190 | −9.4 cm2 (−23.4, 4.6) | −1.32 | 0.26 |
| Lobar cortical thickness | ||||||
| Frontal | −0.077 mm (−.187, 0.033) | −1.37 | 0.237 | −0.011 mm (−0.081, 0.059) | −0.30 | 0.93 |
| Parietal | −0.0568 mm (−0.154, 0.041) | −1.14 | 0.258 | 0.003 mm (−0.0071, 0.079) | 0.09 | 0.93 |
| Temporal | −0.111 mm (−0.215, −0.007) | −2.09 | 0.082 | −0.084 mm (−0.154, 0.013) | −2.33 | 0.09 |
| Occipital | −0.113 mm (−0.24, −0.0257) | −2.43 | 0.074 | −0.027 mm (−0.081, 0.027) | −0.99 | 0.66 |
| Lobar mean curvature | ||||||
| Frontal | 0.0041 mm−1 (0.0010, 0.0072) | 2.61 | 0.02 | |||
| Parietal | 0.0037 mm−1 (0.0007, 0.0066) | 2.42 | 0.03 | |||
| Temporal | 0.0049 mm−1 (0.0017, 0.0080) | 3.06 | 0.01 | |||
| Occipital | 0.0040 mm−1 (−0.0007, 0.0089) | 1.64 | 0.11 | |||
| Lobar Gaussian curvature | ||||||
| Frontal | 0.097 mm−2 (−0.067, 0.26) | 1.16 | 0.33 | |||
| Parietal | 0.014 mm−2 (−0.005, 0.033) | 1.47 | 0.29 | |||
| Temporal | 0.019 mm−2 (0.002, 0.036) | 2.16 | 0.14 | |||
| Occipital | −0.011 mm−2 (−0.043, 0.022) | −0.64 | 0.52 | |||
Statistical association with micro‐motion for CIVET and FreeSurfer output, for subjects 18 years or over only. Linear models were fit in R with age and gender as covariates. N = 58 subjects (27 females); mean age = 23.4 (sd = 3.8, range = 18–34); average framewise motion = 0.08 mm (sd = 0.04, range = 0.02–0.27); one scan per family
Micro‐Motion and Lobar Anatomy in the Context of Age
It is notable that the effects of age were robust to co‐varying for the effect of micro‐motion on estimates of morphological properties. Indeed, compared with the impact of micro‐motion on morphological properties, the impact of age was substantially larger in terms of both statistical significance and effect size. For example, in terms of the estimated effect of a standard deviation change in age or a standard deviation change in micro‐motion, the estimated effect of age on morphology was on average approximately three times that of the effect size of micro‐motion (sample mean age = 16.8 years, sd = 6.9 years; mean micro‐motion = 0.08 mm, sd = 0.04 mm; for details see Table 4).
Table 4.
Comparison of effect sizes (standardized regression coefficients, β) for age and for micro‐motion on estimates of cortical gray matter volume, surface area, cortical thickness and surface curvature (CIVET pipeline and FreeSurfer pipeline)
| Anatomical metric | Civet processing pipeline | FreeSurfer processing pipeline | |||
|---|---|---|---|---|---|
| β age | β motion | β age | β motion | ||
| Lobar volume | |||||
| Frontal | −0.55 | −0.18 | −0.54 | −0.18 | |
| Parietal | −0.57 | −0.08 | −0.61 | −0.10 | |
| Temporal | −0.40 | −0.17 | −0.30 | −0.18 | |
| Occipital | −0.42 | −0.16 | −0.41 | −0.10 | |
| Lobar surface area | |||||
| Frontal | −0.39 | −0.18 | −0.12 | −0.19 | |
| Parietal | −0.40 | −0.06 | −0.23 | −0.14 | |
| Temporal | −0.33 | −0.12 | −0.09 | −0.16 | |
| Occipital | −0.27 | −0.10 | −0.16 | −0.09 | |
| Lobar cortical thickness | |||||
| Frontal | −0.59 | −0.15 | −0.64 | −0.03 | |
| Parietal | −0.64 | −0.07 | −0.68 | 0.04 | |
| Temporal | −0.50 | −0.18 | −0.28 | −0.14 | |
| Occipital | −0.43 | −0.16 | −0.57 | −0.01 | |
| Lobar mean curvature | |||||
| Frontal | −0.27 | 0.24 | |||
| Parietal | −0.38 | 0.11 | |||
| Temporal | −0.59 | 0.05 | |||
| Occipital | −0.34 | 0.05 | |||
| Lobar Gaussian curvature | |||||
| Frontal | 0.12 | 0.07 | |||
| Parietal | −0.17 | 0.01 | |||
| Temporal | −0.25 | 0.13 | |||
| Occipital | −0.22 | −0.08 | |||
Standardized regression coefficients, β, are normalized by the standard deviation of the independent and dependent variables, to facilitate comparison between effect sizes. Each coefficient reflects the number of standard deviations the dependent variable is estimated to change per standard deviation of the independent variable. All models were fit in R. N = 127 subjects (63 females); mean age = 16.8 (sd = 6.9, range = 6–34); average framewise motion = 0.08 mm (sd = 0.04, range = 0.03–0.27); one scan per family.
Micro‐Motion and Vertex‐Based Properties
At the vertex level across approximately 80,000 vertices output by the CIVET pipeline and the approximately 330,000 vertices output by the FreeSurfer pipeline, the strongest relationship between cortical thickness and micro‐motion occurred in medial frontal, lateral occipital, anterior temporal, orbitofrontal, and dorsolateral prefrontal regions of cortex (Fig. 3). In contrast, there was not a significant relationship observed between estimates of cortical surface area and micro‐motion.
Figure 3.
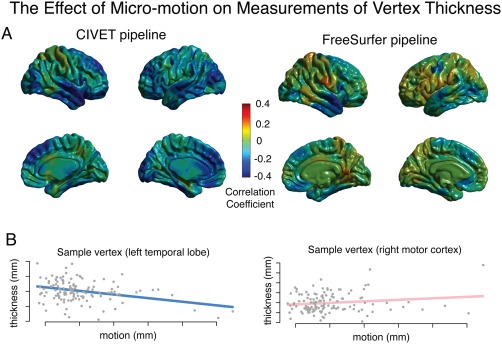
The relationship between micro‐motion and cortical thickness. Subject motion was estimated using the average frame‐to‐frame displacement from an fMRI scan acquired in the same scanning session as the structural scan (Power et al., 2012). (A) Cortical thickness was estimated at vertices across the brain using the CIVET pipeline (left) and the FreeSurfer pipeline (right). The correlation coefficient between motion and thickness was calculated for the residuals of a linear model that included age and gender as covariates. No vertices remained statistically significant after FDR‐correction for multiple comparisons. N = 127 subjects (63 females); mean age = 16.8 (sd = 6.9, range = 6–34); one scan per family. (B) Sample vertices from within the left temporal lobe and the right motor cortex (CIVET pipeline) illustrate the relationship between micro‐motion and cortical thickness.
Frank Motion and Cortical Anatomy
The effect of micro‐motion within high quality scans converged overall with the categorical result of comparing lower and higher quality scans, although these frank motion effects were more strongly significant. Across the approximately 80,000 CIVET vertices and the approximately 330,000 FreeSurfer vertices, the most affected brain regions included medial frontal, lateral occipital/inferior parietal, anterior temporal, orbital/inferior frontal, and dorsolateral prefrontal regions of cortex (Fig. 4). In all of these areas, lower quality scans were associated with thinner cortical surfaces. The exception to the convergence between the processing pipelines was in the area of calcarine fissure for the FreeSurfer pipeline only, where scans with frank motion were estimated by the pipeline as having increased cortical thickness. This points' to the possibility of some pipeline by scan quality interaction effects in terms of the bias inflicted by frank motion if not micro‐motion. Lobar averages of morphological properties calculated with the CIVET pipeline and the FreeSurfer pipeline similarly converged overall with the continuous effects described above, although effect sizes were larger for frank motion (Table 5).
Figure 4.
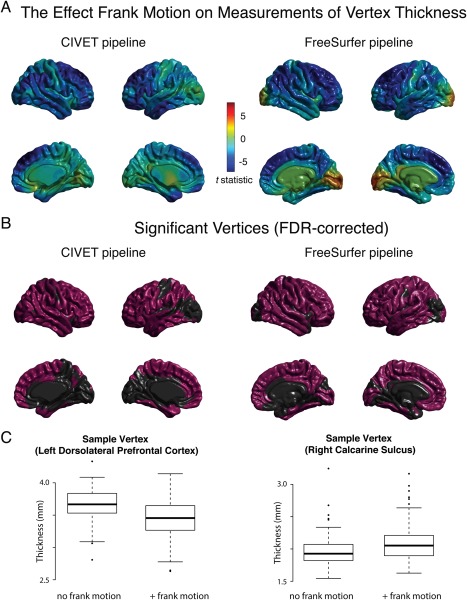
The relationship between frank motion and cortical thickness. ( A) 136 scans visually ranked as Tier 1 (frank motion absent) were gender‐ and age‐matched with 136 scans ranked as Tier 2 (frank motion present) (average age difference between matched scans = ∼1 week). Paired t‐tests were calculated between matched samples, comparing cortical thickness estimated at vertices across the brain the CIVET pipeline (left) and FreeSurfer pipeline (right). (B) Anatomical regions whose relationship with scan quality was statistically significant after FDR‐correction for multiple comparisons. (C) Sample vertices from within the left dorsolateral frontal cortex (CIVET pipeline) and right calcarine sulcus (FreeSurfer pipeline) illustrate the relationship between frank motion and cortical thickness.
Table 5.
Frank motion and measures of lobar anatomy from CIVET and FreeSurfer: Scan Quality Tier 1 (absence of frank motion) vs Scan Quality Tier 2 (presence of frank motion)
| Anatomical metric | CIVET pipeline | FreeSurfer pipeline | ||||
|---|---|---|---|---|---|---|
| Mean difference (95% CI) | t statistic | P value (FDR‐adjusted) | Mean difference (95% CI) | t statistic | P value (FDR‐adjusted) | |
| Total brain volume | ||||||
| Gray matter | −23.7 cm3 (−40.3, −7.1) | −2.82 | 0.005 | −29.2 cm3 (−43.4, −14.9) | −4.03 | 9.3E−05 |
| White matter | 23.2 cm3 (11.5, 34.9) | 3.92 | 0.0001 | 0.5 cm3 (−10.8, 11.8) | 0.09 | 0.92 |
| CSF | 10.7 cm3 (5.1, 16.4) | 3.73 | 0.0002 | −0.6 cm3 (−1.8, 0.7) | −0.87 | 0.38 |
| Lobar volume | ||||||
| Frontal | −8.7 cm3 (−13.9, −3.6) | −3.35 | 0.004 | −12.3 cm3 (−17.4, −7.3) | −4.81 | 1.7E−05 |
| Parietal | −2.2 cm3 (−5.2, 0.8) | −1.43 | 0.15 | −5.8 cm3 (−9.5, −2.0) | −3.01 | 0.004 |
| Temporal | −5.3 cm3 (−9.5, −1.1) | −2.52 | 0.03 | −6.4 cm3 (−9.5, −3.3) | −4.09 | 2.0E−4 |
| Occipital | −1.6 cm3 (−3.7, 0.6) | −1.45 | 0.15 | −0.4 cm3 (−1.9, 1.0) | −0.61 | 0.54 |
| Lobar surface area | ||||||
| Frontal | −5.9 cm2 (−1.74, 5.6) | −1.02 | 0.59 | −11.1 cm2 (−25.8, 3.5) | −1.50 | 0.18 |
| Parietal | 1.8 cm2 (−7.0, 10.7) | 0.41 | 0.68 | −3.0 cm2 (−15.4, 9.4) | −0.47 | 0.64 |
| Temporal | −3.4 cm2 (−10.6, 3.7) | −0.95 | 0.59 | −7.9 cm2 (−1.7, 0.8) | −1.80 | 0.14 |
| Occipital | −2.1 cm2 (−7.4, 3.3) | −0.77 | 0.59 | −7.6 cm2 (−14.0, −1.3) | −2.37 | 0.08 |
| Lobar thickness | ||||||
| Frontal | −0.13 mm (−0.18, −0.09) | −6.30 | 1.58E−08 | −0.13 mm (−0.16, −0.10) | −7.93 | 3.3E−12 |
| Parietal | −0.09 mm (−0.13, −0.05) | −4.46 | 2.31E−05 | −0.09 mm (−0.13, −0.06) | −5.94 | 4.8E−08 |
| Temporal | −0.1 mm (−0.14, −0.06) | −4.69 | 1.35E−05 | −0.10 mm (−0.14, −0.07) | −5.5 | 2.3E−07 |
| Occipital | −0.06 mm (−0.10, −0.02) | −2.77 | 0.006 | 0.03 mm (−0.01, 0.06) | 1.67 | 0.10 |
| Lobar mean curvature | ||||||
| Frontal | 0.0079 mm−1 (0.0054, 0.0103) | 6.26 | 2.0E−08 | |||
| Parietal | 0.0079 mm−1 (0.0051, 0.0107) | 5.60 | 2.5E−07 | |||
| Temporal | 0.0069 mm−1 (0.0042, 0.0096) | 5.07 | 1.7E−06 | |||
| Occipital | 0.0054 mm−1 (0.0026, 0.0081) | 3.81 | 2.0E−04 | |||
| Lobar Gaussian curvature | ||||||
| Frontal | 0.0306 mm−2 0.0036, 0.0577) | 2.24 | 0.054 | |||
| Parietal | 0.0420 mm−2 (0.0226, 0.0614) | 4.29 | 1.0E−04 | |||
| Temporal | 0.0759 mm−2 (−0.0093, 0.1610) | 1.76 | 0.080 | |||
| Occipital | 0.0374 mm−2 (−0.0009, 0.0756) | 1.93 | 0.073 | |||
Statistical association with categorical, visually‐ranked scan quality (absence of frank motion [Tier 1] vs presence of frank motion [Tier 2]), for CIVET output and for FreeSurfer output. 136 scans visually ranked as quality 2 out of 4 were gender‐ and age‐matched with 136 scans ranked as quality 1 (average age difference between matched scans =∼1 week). Paired t tests were calculated between matched samples. See Supporting Information Table 1 for non‐paired P values calculated from the same sample
Heterogeneity of Motion Across the Cortex
One possible reason for anatomical heterogeneity in motion‐related artifact is that in‐scanner motion itself is not uniform about the brain. Displacement of an object in three‐dimensional (3D) space can be described as a set of three translations and three rotations. Although translations affect all voxels equally, the impact of a rotation depends on the distance from the voxel to the axis of rotation. Due to cushioning on either side of the head during scanning sessions, pitch rotations (nodding) are more common than yaw or roll rotations. As shown by the voxel‐wise estimates of framewise displacement, this results in greater average motion in anterior portions of the brain (Fig. 5). In fact, there is a partial but incomplete overlap between areas of the brain that move the most, and areas of the brain that appear to be most susceptible to motion‐related artifact (Figs. 3 and 4).
Figure 5.
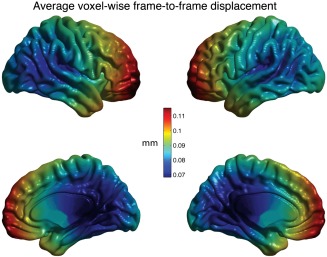
Micro‐motion on a voxel‐by‐voxel basis. The affine transformation from volumetric motion correction were applied to each voxel separately to estimate the frame‐to‐frame displacement for each voxel. For each voxel this value was averaged across the scan, to yield subject‐level maps. These maps were transformed into MNI standard space and averaged across subjects. For illustrative purposes, voxel values were projected onto the CIVET triangular mesh using nearest‐neighbor interpolation.
DISCUSSION
Our findings clarify motion effects on morphometric analyses of brain sMRI data in several important ways. We demonstrate that in‐scanner “micro‐motion,” measured using serially acquired fMRI scans, is associated with reduced sMRI estimates of gray matter volume. Further, we demonstrate that in‐scanner micro‐motion may also bias estimates of cortical thickness and the curvature of the cortical surface. We demonstrate consistency in these motion effects across image‐processing pipelines, developmental windows, and motion assays. Finally, we demonstrate that there is partial though incomplete overlap between the areas of the brain that undergo greater displacement due to rotational head movements and the areas of the brain that appear to be more susceptible to motion‐induced artifact, particularly frontal and temporal areas with a relative sparing of the parietal lobe. Taken together, these results add weight to the mounting notion that in‐scanner motion is not just a source of error in sMRI analysis but can bias results in an anatomically heterogeneous and “biologically plausible” fashion.
The motion‐related biases we report have a number of consequences for structural neuroimaging research, especially studies concerned with age, sex, and clinical effects. In many experimental contexts it is probable that children move more than adults, boys move more than girls, and patients move more than healthy individuals. Although the effect sizes found in the present study are smaller than those reported by many clinical and developmental studies, it is possible that some reportedly morphological differences could actually be due to motion‐related confounds, and conversely that genuine biological differences could be masked by artifacts. Notably, the effects of age do appear to outweigh those of subtle in‐scanner motion, suggesting that previous reports of the developmental trajectories of morphological properties during childhood and adolescence are unlikely to be due entirely to spurious motion effects [Raznahan et al., 2011]. However, the precise impact of motion on previous reported studies is difficult to assess. For example, if in‐scanner motion, cortical thickness, and surface area all vary with age—with developmentally varying contributions of thickness and surface area to changes in volume [Raznahan et al., 2011]—then the effect of motion on estimates of cortical volume is likely to represent a complex interaction of all of these factors. Of note a recent article suggests that motion artifact in structural scans of younger children does have the potential to alter estimated developmental trajectories of cortical thickness [Ducharme et al., 2015].
Our findings combine with prior reports [Reuter et al., 2015] to suggest that motion‐related biases are likely to be largely stable across machines and image‐processing pipelines. Other factors do have the potential to interact with subject motion to adversely affect estimates of anatomical metrics, include noise of the electronics of the MRI system, subject's physiological noise, partial volume effects, imaging gradient non‐linearities, and spatial magnetic inhomogeneities. Variations in the placement of a subject's head in reference to the isocenter, together with gradient non‐linearities, reduce the reliability of anatomical metrics [Jovicich et al., 2006]. Although rigorous image quality control is critical for all structural brain imaging studies, motion‐related bias does appear to be robust to standard quality control procedures [Reuter et al., 2015]. It would be valuable to quantify potential mitigating and exacerbating influences in future work.
Our results identify several similarities between the effects of micro‐motion and frank motion on automated measures of brain anatomy (e.g., spatial and directional overlap of effects on cortical thickness in medial/superior prefrontal and lateral temporal cortices), but also some differences (e.g., effects of frank motion, but not micro‐motion on cortical thickness at the temporo‐occipital junction). Also, with respect to micro‐motion, there is an imperfect correspondence between the spatial distribution of mean local displacement at the group level, and the surface distribution of correlations between inter‐individual differences in local displacement and inter‐individual differences in local cortical thickness. These observations highlight the need for further studies to clarify how different species of in‐scanner motion impact image processing. An integral part of this effort will be comparing and contrasting different candidate assays [Magnotta et al., 2006; Mortamet et al., 2009] for each dimension of motion which emerges as having a distinct impact on image processing.
Looking forward, there are a number of approaches that could be taken to assess and to address motion‐related artifacts in sMRI studies. First, our use of fMRI motion proxy lends itself easily to the reanalysis of previously acquired datasets to test for potential motion‐related bias, without the need for intervention at the level of image acquisition. But even though fMRI motion is likely to be highly predictive of sMRI motion, its use as a proxy has limitations as any dataset will include outliers for whom this proxy measure is inaccurate. Moreover, it is intuitive that the consistency in motion between portions of a scan may decrease with time. In the present study for example, because the EPI scans were on average closer together in time than the EPI scans were to the structural scan, it is possible that the consistency of motion between the structural scans and the EPI scans was less than consistency of motion between the two EPI acquisitions.
A number of research groups have developed innovative scanning and image processing techniques that have the potential to limit, and in the future possibly even eliminate, motion‐related artifacts in sMRI. Most simply, shorter imaging sequences make it easier for subjects to remain still throughout a scan. Some retrospective correction procedures also use “navigator” sequences that acquire additional data during scans to extract information about subject motion [Ehman and Felmlee, 1989; Korin et al., 1990]. Alternately, “autofocusing” methods use a trial‐and‐error approach during k‐space reconstruction to account for possible motion displacement [Atkinson et al., 1997, 1999; Manduca et al., 2000; McGee et al., 2000]. External sensors have the potential to provide information about in‐scanner motion independent of the MR imaging process [Zaitsev et al., 2006; Ooi et al., 2009; Qin et al., 2009]. Prospective motion correction procedures modify the pulse sequence during image acquisition in response to subject‐motion [Kuperman et al., 2011; Norris, 2001; van der Kouwe et al., 2006; Weih et al., 2004; Welch et al., 2002; White et al., 2010]. But despite these encouraging technological developments, it is not yet possible to eliminate motion artifact, and the vast majority of studies do not employ these corrective procedures. At the extreme, the benefits of scanning under sedation likely outweigh the risks/costs in some experimental contexts.
In summary, this work supports the conclusion that in‐scanner motion is a source of bias in sMRI studies. Although it is unlikely that alterations in estimates of brain anatomy previously attributed to age or gender are due entirely to motion artifact, this possible source of bias in between‐group studies of brain anatomy should be given consideration in future studies analogously to efforts to reduce motion artifact in fMRI studies. A range of currently implemented image processing pipelines and quality control procedures appear to be insufficient to entirely mitigate these effects, although new methodologies offer hope for future improvements. In the meantime, using fMRI motion as a proxy measure for in‐scanner motion enables a reasonable, preliminary quantification of the potential for motion‐related bias.
Supporting information
Supporting Information Table 1
Supporting Information Table 2
REFERENCES
- Atkinson D, Hill DL, Stoyle PN, Summers PE, Keevil SF (1997): Automatic correction of motion artifacts in magnetic resonance images using an entropy focus criterion. IEEE Trans Med Imaging 16:903–910. [DOI] [PubMed] [Google Scholar]
- Atkinson D, Hill DL, Stoyle PN, Summers PE, Clare S, Bowtell R, Keevil SF (1999): Automatic compensation of motion artifacts in MRI. Magn Reson Med 41:163–170. [DOI] [PubMed] [Google Scholar]
- Benjamini Y, Krieger AM, Yekutieli D (2006): Adaptive linear step‐up procedures that control the false discovery rate. Biometrika 93:491–507. [Google Scholar]
- Blumenthal JD, Zijdenbos A, Molloy E, Giedd JN (2002): Motion artifact in magnetic resonance imaging: Implications for automated analysis. NeuroImage 16:89–92. [DOI] [PubMed] [Google Scholar]
- Camara‐Rey O, Sneller BI, Ridgway GR, Garde E, Fox NC, Hill DLG (2006): Simulation of acquisition artefacts in MR scans: Effects on automatic measures of brain atrophy. Med Image Comput Comput Assist Interv 9:272–280. [DOI] [PubMed] [Google Scholar]
- Collins DL, Neelin P, Peters TM, Evans AC (1994): Automatic 3D intersubject registration of MR volumetric data in standardized Talairach space. J Comput Assist Tomogr 18:192–205. [PubMed] [Google Scholar]
- Cox RW (1996): AFNI: Software for analysis and visualization of functional magnetic resonance neuroimages. Comput Biomed Res 29:162–173. [DOI] [PubMed] [Google Scholar]
- Cox RW, Jesmanowicz A (1999): Real‐time 3D image registration for functional MRI. Magn Reson Med 42:1014–1018. [DOI] [PubMed] [Google Scholar]
- Dale AM, Fischl B, Sereno MI (1999): Cortical surface‐based analysis. I. Segmentation and surface reconstruction. NeuroImage 9:179–194. [DOI] [PubMed] [Google Scholar]
- Dantendorfer K, Amering M, Bankier A, Helbich T, Prayer D, Youssefzadeh S, Alexandrowicz R, Imhof H, Katschnig H (1997): A study of the effects of patient anxiety, perceptions and equipment on motion artifacts in magnetic resonance imaging. Magn Reson Imaging 15:301–306. [DOI] [PubMed] [Google Scholar]
- Desikan RS, Ségonne F, Fischl B, Quinn BT, Dickerson BC, Blacker D, Buckner RL, Dale AM, Maguire RP, Hyman BT, Albert MS, Killiany RJ (2006): An automated labeling system for subdividing the human cerebral cortex on MRI scans into gyral based regions of interest. NeuroImage 31:968–980. [DOI] [PubMed] [Google Scholar]
- Ducharme S, Albaugh MD, Nguyen T‐V, Hudziak JJ, Mateos‐Pérez JM, Labbe A, Evans AC, Karama S, Brain Development Cooperative Group (2015): Trajectories of cortical thickness maturation in normal brain development ‐ The importance of quality control procedures. NeuroImage 125:267–279. [DOI] [PMC free article] [PubMed] [Google Scholar]
- Ehman RL, Felmlee JP (1989): Adaptive technique for high‐definition MR imaging of moving structures. Radiology 173:255–263. [DOI] [PubMed] [Google Scholar]
- Fischl B, Liu A, Dale AM (2001): Automated manifold surgery: Constructing geometrically accurate and topologically correct models of the human cerebral cortex. IEEE Trans Med Imaging 20:70–80. [DOI] [PubMed] [Google Scholar]
- Fischl B, Sereno MI, Dale AM (1999): Cortical surface‐based analysis. II: Inflation, flattening, and a surface‐based coordinate system. NeuroImage 9:195–207. [DOI] [PubMed] [Google Scholar]
- Fischl B, Salat DH, Busa E, Albert M, Dieterich M, Haselgrove C, van der Kouwe A, Killiany R, Kennedy D, Klaveness S, Montillo A, Makris N, Rosen B, Dale AM (2002): Whole brain segmentation: Automated labeling of neuroanatomical structures in the human brain. Neuron 33:341–355. [DOI] [PubMed] [Google Scholar]
- Fischl B, Salat DH, van der Kouwe AJW, Makris N, Ségonne F, Quinn BT, Dale AM (2004a): Sequence‐independent segmentation of magnetic resonance images. NeuroImage 23:S69–S84. [DOI] [PubMed] [Google Scholar]
- Fischl B, van der Kouwe A, Destrieux C, Halgren E, Ségonne F, Salat DH, Busa E, Seidman LJ, Goldstein J, Kennedy D, Caviness V, Makris N, Rosen B, Dale AM (2004b): Automatically parcellating the human cerebral cortex. Cereb Cortex 14:11–22. [DOI] [PubMed] [Google Scholar]
- Freire L, Roche A, Mangin JF (2002): What is the best similarity measure for motion correction in fMRI time series? IEEE Trans Med Imaging 21:470–484. [DOI] [PubMed] [Google Scholar]
- Friston K, Ashburner J, Frith C, Poline J, Heather J, Frackowiak R (1995): Spatial registration and normalization of images. Hum Brain Mapp 3:165–189. [Google Scholar]
- Friston KJ, Williams S, Howard R, Frackowiak RS, Turner R (1996): Movement‐related effects in fMRI time‐series. Magn Reson Med 35:346–355. [DOI] [PubMed] [Google Scholar]
- Hajnal JV, Myers R, Oatridge A, Schwieso JE, Young IR, Bydder GM (1994): Artifacts due to stimulus correlated motion in functional imaging of the brain. Magn Reson Med 31:283–291. [DOI] [PubMed] [Google Scholar]
- Im K, Lee J‐M, Lee J, Shin Y‐W, Kim I‐Y, Kwon JS, Kim SI (2006): Gender difference analysis of cortical thickness in healthy young adults with surface‐based methods. NeuroImage 31:31–38. [DOI] [PubMed] [Google Scholar]
- Im K, Lee J‐M, Lyttelton O, Kim SH, Evans AC, Kim SI (2008): Brain size and cortical structure in the adult human brain. Cereb Cortex 18:2181–2191. [DOI] [PubMed] [Google Scholar]
- Jenkinson M, Smith S (2001): A global optimisation method for robust affine registration of brain images. Med Image Anal 5:143–156. [DOI] [PubMed] [Google Scholar]
- Jenkinson M, Bannister P, Brady M, Smith S (2002): Improved optimization for the robust and accurate linear registration and motion correction of brain images. NeuroImage 17:825–841. [DOI] [PubMed] [Google Scholar]
- Jo HJ, Gotts SJ, Reynolds RC, Bandettini PA, Martin A, Cox RW, Saad ZS (2013): Effective preprocessing procedures virtually eliminate distance‐dependent motion artifacts in resting state FMRI. J Appl Math 2013:935154. [DOI] [PMC free article] [PubMed] [Google Scholar]
- Johnstone T, Ores Walsh KS, Greischar LL, Alexander AL, Fox AS, Davidson RJ, Oakes TR (2006): Motion correction and the use of motion covariates in multiple‐subject fMRI analysis. Hum Brain Mapp 27:779–788. [DOI] [PMC free article] [PubMed] [Google Scholar]
- Jovicich J, Czanner S, Greve D, Haley E, van der Kouwe A, Gollub R, Kennedy D, Schmitt F, Brown G, Macfall J, Fischl B, Dale A (2006): Reliability in multi‐site structural MRI studies: Effects of gradient non‐linearity correction on phantom and human data. NeuroImage 30:436–443. [DOI] [PubMed] [Google Scholar]
- Kim JS, Singh V, Lee JK, Lerch J, Ad‐Dab'bagh Y, MacDonald D, Lee J‐M, Kim SI, Evans AC (2005): Automated 3‐D extraction and evaluation of the inner and outer cortical surfaces using a Laplacian map and partial volume effect classification. NeuroImage 27:210–221. [DOI] [PubMed] [Google Scholar]
- Korin HW, Felmlee JP, Ehman RL, Riederer SJ (1990): Adaptive technique for three‐dimensional MR imaging of moving structures. Radiology 177:217–221. [DOI] [PubMed] [Google Scholar]
- Kundu P, Brenowitz ND, Voon V, Worbe Y, Vértes PE, Inati SJ, Saad ZS, Bandettini PA, Bullmore ET (2013): Integrated strategy for improving functional connectivity mapping using multiecho fMRI. Proc Natl Acad Sci USA 110:16187–16192. [DOI] [PMC free article] [PubMed] [Google Scholar]
- Kundu P, Santin MD, Bandettini PA, Bullmore ET, Petiet A (2014): Differentiating BOLD and non‐BOLD signals in fMRI time series from anesthetized rats using multi‐echo EPI at 11.7 T. NeuroImage 102(Pt 2):861–874. [DOI] [PubMed] [Google Scholar]
- Kuperman JM, Brown TT, Ahmadi ME, Erhart MJ, White NS, Roddey JC, Shankaranarayanan A, Han ET, Rettmann D, Dale AM (2011): Prospective motion correction improves diagnostic utility of pediatric MRI scans. Pediatr Radiol 41:1578–1582. [DOI] [PMC free article] [PubMed] [Google Scholar]
- Magnotta VA, Friedman L, FIRST BIRN (2006): Measurement of signal‐to‐noise and contrast‐to‐noise in the fBIRN multicenter imaging study. J Digit Imaging 19:140–147. [DOI] [PMC free article] [PubMed] [Google Scholar]
- Manduca A, McGee KP, Welch EB, Felmlee JP, Grimm RC, Ehman RL (2000): Autocorrection in MR imaging: Adaptive motion correction without navigator echoes. Radiology 215:904–909. [DOI] [PubMed] [Google Scholar]
- McGee KP, Manduca A, Felmlee JP, Riederer SJ, Ehman RL (2000): Image metric‐based correction (autocorrection) of motion effects: Analysis of image metrics. J Magn Reson Imaging 11:174–181. [DOI] [PubMed] [Google Scholar]
- Morelli JN, Runge VM, Ai F, Attenberger U, Vu L, Schmeets SH, Nitz WR, Kirsch JE (2011): An image‐based approach to understanding the physics of MR artifacts. Radiographics 31:849–866. [DOI] [PubMed] [Google Scholar]
- Mortamet B, Bernstein MA, Jack CR, Gunter JL, Ward C, Britson PJ, Meuli R, Thiran J‐P Krueger G, Alzheimer's Disease Neuroimaging Initiative (2009): Automatic quality assessment in structural brain magnetic resonance imaging. Magn Reson Med 62:365–372. [DOI] [PMC free article] [PubMed] [Google Scholar]
- Norris D (2001): Online motion correction for diffusion‐weighted imaging using navigator echoes: Application to RARE imaging without sensitivity loss. Magn Reson Med 45:729–733. [DOI] [PubMed] [Google Scholar]
- Oakes TR, Johnstone T, Ores Walsh KS, Greischar LL, Alexander AL, Fox AS, Davidson RJ (2005): Comparison of fMRI motion correction software tools. NeuroImage 28:529–543. [DOI] [PubMed] [Google Scholar]
- Ooi MB, Krueger S, Thomas WJ, Swaminathan SV, Brown TR (2009): Prospective real‐time correction for arbitrary head motion using active markers. Magn Reson Med 62:943–954. [DOI] [PMC free article] [PubMed] [Google Scholar]
- Patel AX, Kundu P, Rubinov M, Jones PS, Vértes PE, Ersche KD, Suckling J, Bullmore ET (2014): A wavelet method for modeling and despiking motion artifacts from resting‐state fMRI time series. NeuroImage 95:287–304. [DOI] [PMC free article] [PubMed] [Google Scholar]
- Power JD, Barnes KA, Snyder AZ, Schlaggar BL, Petersen SE (2012): Spurious but systematic correlations in functional connectivity MRI networks arise from subject motion. NeuroImage 59:2142–2154. [DOI] [PMC free article] [PubMed] [Google Scholar]
- Preboske GM, Gunter JL, Ward CP, Jack CR (2006): Common MRI acquisition non‐idealities significantly impact the output of the boundary shift integral method of measuring brain atrophy on serial MRI. NeuroImage 30:1196–1202. [DOI] [PMC free article] [PubMed] [Google Scholar]
- Qin L, van Gelderen P, Derbyshire J (2009) Prospective head‐movement correction for high‐resolution MRI using an in‐bore optical tracking system. Magn Reson Med 62:924–934. [DOI] [PMC free article] [PubMed] [Google Scholar]
- R Core Team (2012): R: A Language and Environment for Statistical Computing. Vienna: R Foundation for Statistical Computing. [Google Scholar]
- Raznahan A, Shaw P, Lalonde F, Stockman M, Wallace GL, Greenstein D, Clasen L, Gogtay N, Giedd JN (2011): How does your cortex grow? J Neurosci 31:7174–7177. [DOI] [PMC free article] [PubMed] [Google Scholar]
- Reuter M, Tisdall MD, Qureshi A, Buckner RL, van der Kouwe AJW, Fischl B (2015): Head motion during MRI acquisition reduces gray matter volume and thickness estimates. NeuroImage 107:107–115. [DOI] [PMC free article] [PubMed] [Google Scholar]
- Ronan L, Fletcher PC (2014): From genes to folds: A review of cortical gyrification theory. Brain Struct Funct 220:2475–2483. [DOI] [PMC free article] [PubMed] [Google Scholar]
- Satterthwaite TD, Wolf DH, Loughead J, Ruparel K, Elliott MA, Hakonarson H, Gur RC, Gur RE (2012): Impact of in‐scanner head motion on multiple measures of functional connectivity: Relevance for studies of neurodevelopment in youth. NeuroImage 60:623–632. [DOI] [PMC free article] [PubMed] [Google Scholar]
- Ségonne F, Dale AM, Busa E, Glessner M, Salat D, Hahn HK, Fischl B (2004): A hybrid approach to the skull stripping problem in MRI. NeuroImage 22:1060–1075. [DOI] [PubMed] [Google Scholar]
- Ségonne F, Pacheco J, Fischl B (2007): Geometrically accurate topology‐correction of cortical surfaces using nonseparating loops. IEEE Trans Med Imaging 26:518–529. [DOI] [PubMed] [Google Scholar]
- Sled JG, Zijdenbos AP, Evans AC (1998): A nonparametric method for automatic correction of intensity nonuniformity in MRI data. IEEE Trans Med Imaging 17:87–97. [DOI] [PubMed] [Google Scholar]
- Tohka J, Zijdenbos A, Evans A (2004): Fast and robust parameter estimation for statistical partial volume models in brain MRI. NeuroImage 23:84–97. [DOI] [PubMed] [Google Scholar]
- van der Kouwe AJW, Benner T, Dale AM (2006): Real‐time rigid body motion correction and shimming using cloverleaf navigators. Magn Reson Med 56:1019–1032. [DOI] [PubMed] [Google Scholar]
- Van Dijk KRA, Sabuncu MR, Buckner RL (2012): The influence of head motion on intrinsic functional connectivity MRI. NeuroImage 59:431–438. [DOI] [PMC free article] [PubMed] [Google Scholar]
- Weih KS, Driesel W, Mengershausen von M, Norris DG (2004): Online motion correction for diffusion‐weighted segmented‐EPI and FLASH imaging. Magma 16:277–283. [DOI] [PubMed] [Google Scholar]
- Welch EB, Manduca A, Grimm RC, Ward HA, Jack CR (2002): Spherical navigator echoes for full 3D rigid body motion measurement in MRI. Magn Reson Med 47:32–41. [DOI] [PubMed] [Google Scholar]
- White N, Roddey C, Shankaranarayanan A, Han E, Rettmann D, Santos J, Kuperman J, Dale A (2010): PROMO: Real‐time prospective motion correction in MRI using image‐based tracking. Magn Reson Med 63:91–105. [DOI] [PMC free article] [PubMed] [Google Scholar]
- Wood ML, Henkelman RM (1985): MR image artifacts from periodic motion. Med Phys 12:143–151. [DOI] [PubMed] [Google Scholar]
- Zaitsev M, Dold C, Sakas G, Hennig J, Speck O (2006): Magnetic resonance imaging of freely moving objects: Prospective real‐time motion correction using an external optical motion tracking system. NeuroImage 31:1038–1050. [DOI] [PubMed] [Google Scholar]
Associated Data
This section collects any data citations, data availability statements, or supplementary materials included in this article.
Supplementary Materials
Supporting Information Table 1
Supporting Information Table 2