

Abstract
Purpose
Autophagy is a critical process, compromised in neurodegenerative disease, by which terminally differentiated cells like neurons manage cytoskeletal and organelle turnover. How autophagy relates to associated neurodegenerative pathologies remain unclear. We examined autophagy in optic neuropathy by investigating cytoskeletal degradation, mitochondria, and autophagic vesicles in the DBA2/J mouse model of glaucoma exhibiting differing levels of axon transport functionality.
Methods
DBA/2J and DBA/2Jwt-gpnmb control mice 11 to 14 months of age were injected with cholera toxin-B (CTB) to assay anterograde axonal transport. Axonal mitochondria and autophagic vesicles were analyzed with respect to transport integrity in proximal and distal optic nerve using serial block face scanning electron microscopy (3D EM).
Results
Several indices varied significantly between the DBA/2J and DBA/2Jwt-gpnmb mice, including mitochondrial volume, average number of autophagic vesicles per axon, and mitochondrial cristae. However, there were no differences in mitochondrial cristae for axons with functional versus dysfunctional CTB transport, suggesting that mitochondrial dysfunction precedes overt transport blockade. Anterograde transport failure was accompanied by a dissociation of the relationship between mitochondrial and axon volumes. Autophagic vesicle profiles were significantly increased in optic nerve with transport deficit, consistent with greater autophagic activity. Mitochondria within autophagosomes, indicative of mitophagy, were observed in both proximal and distal axons.
Conclusions
Loss of anterograde transport in DBA/2J optic nerve is concomitant with diminished mitochondrial volume, increased cytoskeletal breakdown and autophagic activity, and accumulation of autophagic profiles, including signs of mitophagy, in proximal optic nerve. Axons with transport deficit are metabolically underserved, though not necessarily from mitophagy.
Keywords: autophagy, mitophagy, optic neuropathy, anterograde transport, cholera toxin-B
Previous work has shown that on a cellular level, autophagy has a major role to play in the optic neuropathy and subsequent degeneration of RGCs in glaucoma based on an increased presence of autophagosomes in the RGCs of hypertensive glaucoma models.1–4 Autophagy is a physiological, intracellular recycling process that degrades organelles and other cellular components to produce new materials for continued growth and survival. While a basal rate of autophagy is normally present in all cells, an increase in the process occurs in times of stress. The term autophagy flux refers to the dynamic process of autophagosome formation, transportation and eventual fusion with a lysosome for hydrolytic degradation.5 This process is thought to be dysfunctional in neurodegenerative diseases, exemplified by the importance of autophagy in the removal of amyloid plaques and neurofibrillary tangles in Alzheimer's disease.6 In the case of the DBA/2J model of glaucoma, we have recently shown that a particular form of autophagy known as mitophagy may be impaired, leading to the accumulation of smaller, less healthy mitochondria despite significant increases in autophagosome number.4 In order to gain better insight into the process of autophagosome formation and mitochondrial dynamics in the context of axon transport, this study used serial blockface scanning electron microscopic (3D EM) to develop a three-dimensional (3D) rendering of optic nerve in order to locate and quantify vesicles of the autophagy pathway and to quantify the morphology and distribution of mitochondria.
In addition to assessing autophagosomes and mitochondrial morphology, our 3D EM images allowed us to examine both the proximal and distal optic nerves of DBA/2J and DBA/2Jwt-gpnmb mice for insight into how the optic nerve degenerates. Two common degenerative responses to axon injury are Wallerian degeneration7 and dying back.8,9 Wallerian degeneration is a rapid response to severe acute injury where the axon distal to the lesion undergoes an organized, synchronous breakdown of cellular components. Dying back is associated with a more chronic exposure to stress. In this process, the distal synapse of the axon is first to show pathology with degeneration then progressing back to the cell body.10 Differences within cytoskeletal organization, autophagic vesicle profiles, and mitochondrial characteristics in proximal and distal optic nerves could distinguish between the two degenerative processes and provide useful information regarding the mechanisms underlying axon loss in glaucoma. While our findings indicate an increase in autophagic vesicles in the DBA/2J optic nerve, the lack of mitochondria within autophagosomes and the decreased mitochondrial cristae index corroborate a failure of mitophagy in glaucomatous optic nerve,4 as well as point to an additional failing of anterograde transport11 of autophagic vesicle profiles that could contribute to distal axonopathy.
Methods
Animals
DBA/2J (D2) and DBA/2Jwt-gpmnb (D2-Gpnmb+) mice (Jackson Labs, Bar Harbor, ME, USA) were purchased and housed at Northeast Ohio Medical University (Rootstown, OH, USA). All procedures were approved by the Institutional Animal Care Committee and performed in accordance with the ARVO Statement for the Use of Animals in Ophthalmic and Vision Research.
Anterograde Tracing
Mice were anesthetized with isoflurane (2.5%), then curved forceps were used to stabilize the proptosed eye while 1.5 μL of cholera toxin-B conjugated to AlexaFluor-488 (CTB-488; Life Technologies, Carlsbad, CA, USA) was injected into the posterior chamber just caudal to the ora serrata using a 33-G needle attached to a 5-μL Hamilton syringe (Reno, NV, USA). Three days later, mice were euthanized with an overdose of Beuthanasia-D (300 mg/kg sodium pentobarbital; Schering-Plough Animal Health, Union, NJ, USA) then transcardially perfused with 4% paraformaldehyde in 0.1 M sodium cacodylate buffer with 0.05% CaCl2. After perfusion, retinas were dissected, flat-mounted, and examined under an AxioZoom stereomicroscope (Zeiss, Oberkochen, Germany) for confirmation of CTB injections. Brains were dissected from the skull, cortex was removed, and the subcortex was imaged to evaluate anterograde labeling of the superior colliculus by CTB-488. Of the optic nerves used in the study, the corresponding colliculi were either fully labeled by CTB-488 (CTB+), or greater than 90% free of CTB-488 label (CTB−), corresponding to functional anterograde transport and severely compromised transport, respectively. Figure 1A shows an example of CTB+ and CTB− labeling in the superior colliculus. For the CTB− lobe of the colliculus, we show the corresponding retina (Fig. 1B) to demonstrate that the injection was effective, but the collicular lobe is blank due to anterograde transport deficit. All of the brains from DBA/2Jwt-gpmnb (D2-Gpnmb+) mice were fully labeled by CTB-488; the DBA/2J brains had CTB-488 labeling that varied between 90% and 100% (considered intact) and 0% to 10% (considered transport deficient) CTB-488 label.
Figure 1.

Anterograde tracing of visual projection from retina to superior colliculus. (A) Photomicrograph of the superior colliculus (SC) from a DBA/2J mouse showing CTB labeling in the right colliculus but not the left (arrow). The left colliculus receives the majority of its input from the right retina, shown in (B). Scale bar: 500 μm. (B) Photomicrograph of the right retina that corresponds to the left lobe of the superior colliculus in (A). The retina received a successful CTB injection as shown by CTB uptake by RGCs and astrocytes; the lack of CTB labeling in the superior colliculus is a result of anterograde transport deficit at some point along the visual projection. Scale bar: 50 μm. (C) Top row: a series of electron micrographs 2 μm apart with select axons and mitochondria traced; bottom row: reconstructions of annotated axons (beige) and associated mitochondria (colored) in top row. LGN, lateral geniculate nucleus (removed during dissection); PT, pretectum; *indicates damage due to injection (occurs infrequently).
Electron Microscopy
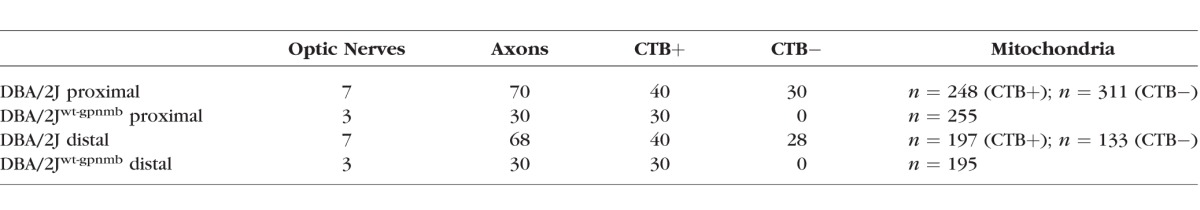
Optic nerves from DBA/2J (D2) and DBA/2Jwt-gpmnb (D2-Gpnmb+) mice were divided in half, with the portion closest to the eye referred to as proximal optic nerve, while the portion closest to the chiasm referred to as distal optic nerve. Ages and numbers of D2 mice used: 9 (n = 2), 11 (n = 3), and 14 months (n = 2); D2-Gpnmb+ mice were 11-months old (n = 3). Details about the mice used can be found in Table 1. Optic nerves were postfixed in 2% glutaraldehyde in 0.1M sodium cacodylate buffer with 0.05% CaCl2 for 48 hours and stained using previously described methods for 3D serial block-face scanning electron microscopy.12 The nerves were stained with the following solutions alternated with water or 0.1 M sodium cacodylate washes: 0.1% tannic acid for 1 hour followed by ferricyanide-reduced 2% osmium tetroxide (OsO4) for 1 hour, 1% thiocarbohydrazide (TCH) solution at 60°C for 20 minutes followed by 2% OsO4 solution for 30 minutes, then in 1% uranyl acetate solution overnight at 4°C, and lastly, in 20 mM lead aspartate solution at 60°C for 30 minutes. After dehydration in graded ethanols followed by 100% acetone, nerves were embedded in 1:1 mixtures of acetone and EPON overnight at room temperature, then in fresh EPON (100%) in a mold for 48 hours at 60°C under vacuum. Blocks were trimmed in a Leica ultramicrotome (Buffalo Grove, IL, USA) and the block was placed inside the column of a Zeiss Sigma VP scanning electron microscope, equipped with a Gatan3 View microtome. Serial sections were cut at a thickness of 80 nm. The magnification was then set at ×4000, and the electron beam set at 2.0 kV using an aperture of 30 μm. The block face was then imaged at a resolution of 7 nm/pixel using a dwell time of 1.0 μs/pixel, producing an image volume of 8000 μm3. These imaging conditions were chosen to maximize axon sample length while still discerning individual mitochondria. Images were registered, corrected for aspect ratio, and derivative stacks were generated using ImageJ software (http://imagej.nih.gov/ij/; provided in the public domain by the National Institutes of Health, Bethesda, MD, USA)/FIJI software (http://fiji.sc/Fiji, in the public domain).13 Where necessary, compensation for slice thickness disparity was made using the method of Fiala and Harris.14
Table 1.
Details of Analyzed Samples
Morphologic Analysis
Five micron lengths of 10 randomly chosen axons within each distal or proximal optic nerve sample were traced and analyzed using Reconstruct software.15 Figure 1C shows a series of electron micrographs with the location of reconstructed axons (bottom row, beige) and mitochondria (various colors). One D2 sample exhibited such massive degeneration that we were unable to reconstruct 10 continuous axons; this sample was excluded from quantitative analysis. Within the selected axons, mitochondria, and autophagic vesicles were also quantified and analyzed. Measures taken included: mitochondria length, diameter, nearest neighbor distance, distance from the axolemma, axon length, axon diameter. From these measures we calculated mitochondrial volume, axon volume, percent of axon volume taken up by mitochondria, and mitochondria roundness. Distances and distributions were measured directly in Reconstruct or calculated using 3D distance formula. Axonal diameters were calculated from length and volume data assuming axons, nodal, and paranodal axoplasm were cylinders, and mitochondria were cylinders with a hemisphere at either end (cigar-shaped). Mitochondrial cristae index was assigned based on the appearance of the cristae and the outer mitochondrial membrane using a scale first described in Coughlin et al.4 with 1 exhibiting the poorest morphology, a mitochondrion with separation of inner and outer membranes and absent cristae; a score of 2 was assigned to mitochondria with severely fragmented or swollen cristae and warped membranes, a score of 3 to mitochondria with fragmented or swollen cristae that are irregularly packed, a score of 4 to mitochondria with the occasional swollen cristae with only slight irregularity, while a score of 5 described an intact mitochondrion with sharply defined, numerous, and/or regular cristae.
Autophagic Vesicle Analysis
Membrane vesicles in axons were quantified and classified. These were organelles that could be distinguished from mitochondria and endoplasmic reticulum (ER) because they lacked cristae or they were not continuous with the ER syncytium. The majority appeared as vesicles with single or double membranes.
Statistics
Statistics, including linear regression, were calculated using GraphPad Prism 6.05 (GraphPad Software, La Jolla, CA, USA). Within optic nerve proximal and distal comparisons were made using paired, nonparametric 2-tailed t-tests (Wilcoxon matched-pairs rank sum tests). Between group comparisons were made using unpaired, 2-tailed t-tests. In cases where data sets did not have a Gaussian distribution, the nonparametric Mann-Whitney U test was used. For 2-tailed t-tests in which the SDs were unequal, we used Welch's correction.
Results
Using serial block face scanning electron microscopy, we sought to determine how mitochondria and autophagic vesicles are altered by, or contribute to, glaucoma-related pathology such as the loss of anterograde transport. We undertook a similar analysis using standard, two-dimensional transmission electron microscopy,4 though without regard to proximal or distal location or axon transport integrity. Having observed how single transmission electron microscope (TEM) sections of organelles within axons can be misinterpreted, we turned to 3D EM in this study. We first compared D2 and D2-Gpnmb+ distal and proximal axon data, followed by an analysis of optic nerve axons from D2 mice with or without functional anterograde axon transport
D2 Versus D2-Gpnmb+ SEM Analysis
D2 mitochondria are significantly shorter than D2-Gpnmb+ in both distal and proximal optic nerve (t-test, P < 0.01, Fig. 2A). In addition, mitochondria in D2 distal ON are shorter than D2 proximal ON (paired t-test, P < 0.05). Because there are no statistical differences in mitochondrial diameter across strain and ON section (data not shown), it follows from the length differences that D2 mitochondrial volume is overall significantly smaller than D2-Gpnmb+; comparisons of D2 versus D2-Gpnmb+ proximal are significant (t-test, P < 0.05), as are D2 versus D2-Gpnmb+ distal (t-test, P < 0.05; Fig. 2B). The D2 versus D2-Gpnmb+ mitochondrial volume findings corroborate our TEM study,4 suggesting a balance toward fission producing smaller, more motile mitochondria. Interestingly, both proximal D2 and D2-Gpnmb+ mitochondria tend to have smaller volumes than distal, but not in a statistically significant way. This suggests that whatever impact of the disease on mitochondrial volume, it is maintained along the axon. Distal mitochondria might be expected to be most impacted by transport deficit since they are farthest from the RGC soma.
Figure 2.

Mitochondrial morphology measures for proximal and distal optic nerve (ON) from DBA/2J (D2) and DBA/2J-Gpnmb+ (D2G) mice. (A) Mitochondrial length is significantly higher in D2G proximal compared with D2 proximal (t-test, P < 0.01), and in D2G distal compared with D2 distal ON (t-test, P < 0.01). D2 distal ON mitochondrial length is also significantly shorter than D2 proximal (t-test, P < 0.05). (B) Mitochondrial volume is significantly smaller in proximal D2 compared with D2G ON (t-test, P < 0.05) and distal D2 compared with D2G ON (t-test, P < 0.05). (C) Mitochondrial roundness is length/diameter, so a perfectly spherical mitochondrion would have a roundness equal to 1. Mitochondria in distal D2 ON were significantly more round (closer to 1) than either proximal D2 (t-test, P < 0.001) or distal D2G (t-test, P < 0.01) mitochondria. (D) Mitochondrial cristae index, assigned as described in the Methods, was significantly lower in the proximal and distal D2 ON than D2G (χ2 test for proximal D2 versus D2G (#): χ2 48.61, df 4, P < 0.0001; and for distal D2 versus D2G (^): χ2 37.93, df 4, P < 0.0001). Error bars are SEM.
Mitochondrial roundness (length/diameter) is significantly lower for D2 distal versus proximal (paired t-test, P < 0.001), and D2 versus D2-Gpnmb+ distal (t-test, P < 0.01; Fig. 2C). D2 mitochondria are significantly less intact than D2-Gpnmb+ mitochondria, in both proximal and distal ON (χ2 test for proximal D2 versus D2G: χ2 48.61, df 4, P < 0.0001; and for distal D2 versus D2G: χ2 37.93, df 4, P < 0.0001, respectively; Fig. 2D) as measured by a 5-point cristae index (5 represents the most intact, compact and regularly spaced cristae). The mitochondrial cristae index does not vary between distal and proximal ON within strain, indicating that distal ON mitochondria are not less intact than proximal mitochondria. Mitochondrial density was similar across strain and ON region (proximal D2: 0.28 ± 0.12; proximal D2-Gpnmb+: 0.267 ± 0.103; distal D2: 0.246 ± 0.091; distal D2-Gpnmb+: 0.271 ± 0.119).
Nearest neighbor distance is the measured distance between mitochondria (Fig. 3A), and it differed in a significant way when comparing proximal to distal mitochondria within strain (paired t-test, P < 0.01 for D2 and D2-Gpnmb+ ON). Distal mitochondria averaged 2.17 ± 0.15 μm apart in D2 ON, and 2.15 ± 0.24 μm apart in D2-Gpnmb+ ON. The similarity of the proximal and distal distances suggests that the spacing of mitochondria to manage energy requirements is not altered by D2 ON pathology. The distance of the mitochondria from the axolemma was significantly increased in D2 proximal and distal ON as compared to D2-Gpnmb+ (t-test, P < 0.001 for proximal and distal comparisons; Fig. 3B). Mitochondrial volume by axon volume is significantly greater for D2-Gpnmb+ proximal versus distal ON (paired t-test, P < 0.01), suggesting that there is more energy capacity in D2-Gpnmb+ proximal ON (Fig. 3C). This observation is important because D2 proximal optic nerve has significantly decreased percentage of axon devoted to mitochondria than the control D2G-Gpnmb+ proximal ON (t-test, P < 0.05), supporting the notion that D2 proximal optic nerve is underserved by its mitochondria.
Figure 3.
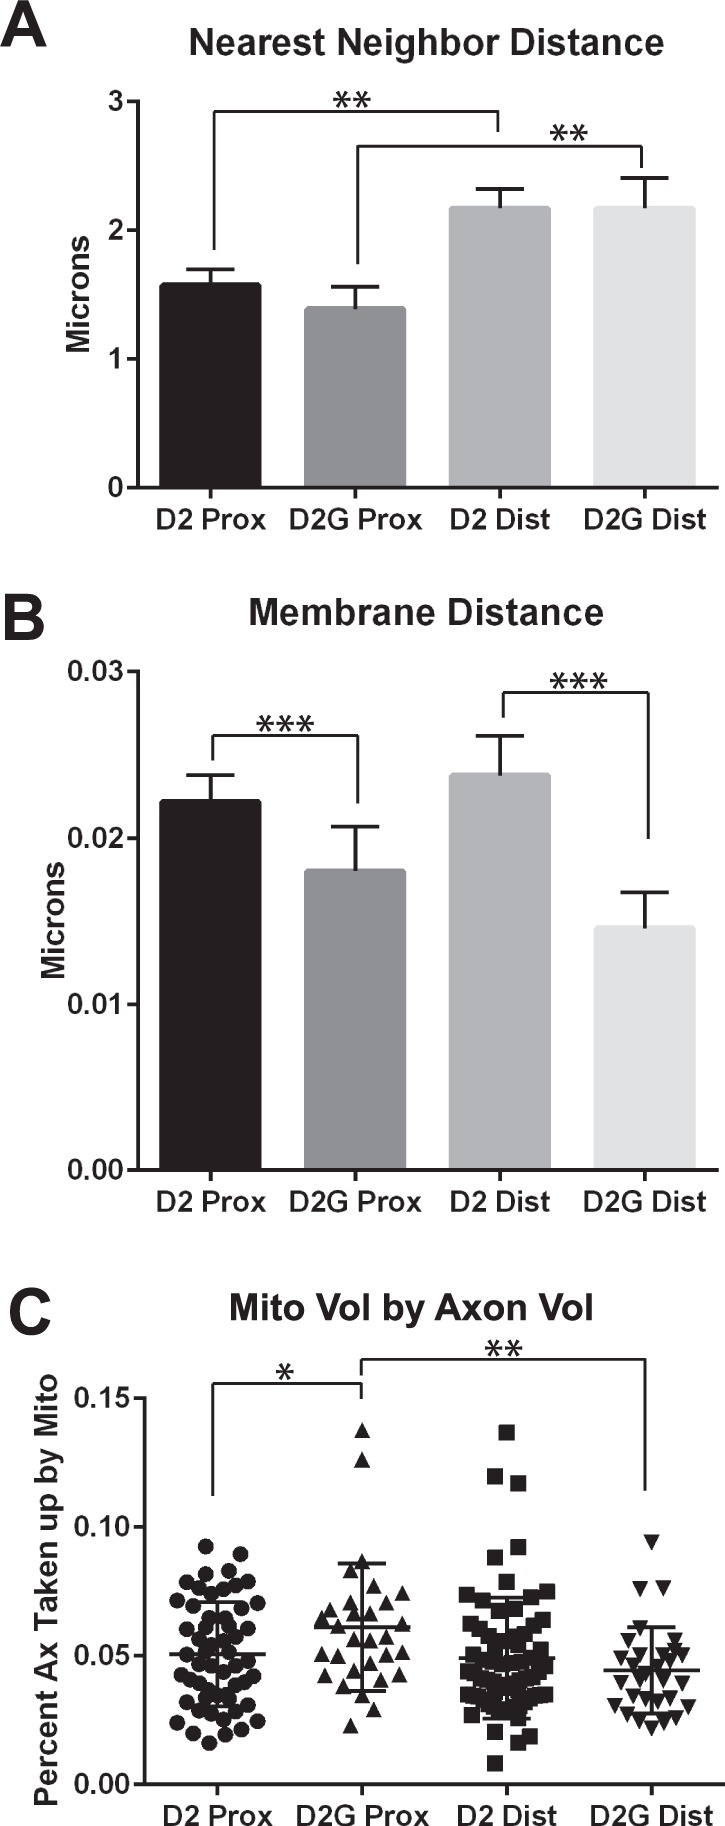
Mitochondria and axon relationships for proximal and distal ON for D2 and D2G mice. (A) Nearest neighbor distance (the distance between a mitochondrion and its nearest neighbor mitochondrion) was significantly larger in the distal D2 and D2G ON as compared with the proximal D2 and D2G (t-test, P < 0.05). (B) Membrane distance, the closest distance between the mitochondrion and the axolemma, was significantly greater in the D2 proximal and distal compared with the D2G proximal and distal ON (t-test, P < 0.001). (C) Mitochondrial volume by axon volume is depicted as the percentage of the axon taken up by the mitochondria. The proximal D2G mitochondrial volume by axon volume was significantly higher than the proximal D2 (t-test, P < 0.05) and distal D2G (t-test, P < 0.01) mitochondrial volume by axon volume. Error bars are SEM.
Impact of Transport Deficit on Axon Organelles
Mice received an intraocular injection of cholera toxin-B conjugated to AlexaFluor-488 (CTB-488), a tracer that is taken up by RGCs through binding to the GM1 receptor16 and is actively transported17,18 to the RGC synapse in the superior colliculus.11,19 Retinas from all mice in this study showed successful CTB injections based on uptake of CTB by the RGCs. All D2-Gpnmb+ mice had 100% CTB coverage in the superior colliculus; D2 colliculi showed between 100% and 0% anterograde transport of CTB (example in Fig. 1). Cholera toxin-B–488 tracing allowed us to compare mitochondria and autophagic vesicles in axons that were able to anterogradely transport tracer (CTB+) or not (CTB−). All of the following data compares CTB+ and CTB− ONs from D2 mice only.
Mitochondrial length is significantly greater (paired t-test, P < 0.05; Fig. 4A), while mitochondrial diameter in significantly smaller (Fig. 4B), in CTB− proximal than distal ON (t-test for proximal ON, P < 0.05; paired t-test for CTB− ON, P < 0.001). The overall effect is significantly smaller mitochondrial volume in the proximal ON from axons with transport deficit (t-test for proximal ON, P < 0.001; paired t-test for CTB− ON, P < 0.001; Fig. 4C). These same small mitochondria in the CTB− proximal ON have mitochondrial roundness measures that are the greatest distance from 1 (sphere), so are the least round. These mitochondria are significantly different from CTB+ proximal (paired t-test, P < 0.01); CTB+ distal (t-test, P < 0.001); and CTB− distal (t-test, P < 0.001), see Figure 4D. Surprisingly, there was no statistical difference across transport group or ON section for mitochondrial cristae index (CTB+ proximal: 3.00 ± 0.052; CTB− proximal: 2.969 ± 0.059; CTB+ distal: 2.988 ± 0.062; CTB− distal: 3.168 ± 0.088). There was also no statistical difference in mitochondrial density within the axons evaluated (CTB+ proximal: 0.234 ± 0.022; CTB− proximal: 0.306 ± 0.03; CTB+ distal: 0.251 ± 0.029; CTB− distal: 0.248 ± 0.021).
Figure 4.

Mitochondrial morphology measures for D2 ON with (CTB+) or without (CTB−) axon transport. (A) Mitochondrial length is significantly greater in proximal CTB− as compared with distal CTB− ON (t-test, P < 0.05). (B) Mitochondrial diameter is significantly lower in proximal CTB− as compared with proximal CTB+ (t-test, P < 0.001) and distal CTB− (t-test, P < 0.001) ON. (C) Mitochondrial volume is significantly smaller in proximal CTB− compared with proximal CTB+ (t-test, P < 0.001) and distal CTB− (t-test, P < 0.001) ON. (D) Mitochondria in the proximal CTB− ON have a significantly higher roundness (length/diameter) score than proximal CTB+ (t-test, P < 0.01), distal CTB+ (t-test, P < 0.001), and distal CTB− (t-test, P < 0.001). Error bars are SEM.
Axon length and volume for those measured in the CTB− proximal ON were significantly lower than the CTB+ proximal ON (t-test, P < 0.01 and P < 0.05, respectively; Figs. 5A, 5B). We evaluated the cytoskeleton within optic nerve axons using a 5-point scale. Regularly spaced neurofilaments and microtubules with good contrast with background were a 4 on the scale, while completely disrupted, flocculent cytoskeleton was ranked a 0 on the scale. Cholera toxin-B− axons have greater cytoskeletal breakdown than CTB+ axons, though most of the axons in the CTB− nerves still appeared relatively normal (combined scores of 3 and 4 exceed 80% of the CTB− axons and 95% of the CTB+ axons). Only distal ON axons with anterograde transport deficit yielded high numbers of flocculent axons (t-test, P < 0.05; Fig. 5C). Overall, more D2 axons have cytoskeletal breakdown than D2-Gpnmb+ axons, but the average cytoskeleton health scores were not statistically different within the D2 or D2-Gpnmb+, comparing proximal and distal ON (data not shown). Nearest neighbor distance is significantly higher in CTB+ distal ON than CTB+ proximal (paired t-test, P < 0.05); this mirrors the D2 and D2-Gpnmb+ alone data (Fig. 3A). However, nearest neighbor distance for the CTB− axons does not differ between proximal and distal, suggesting that this relationship breaks down with transport failure (Fig. 5D).
Figure 5.

Axon metrics for D2 ON with (CTB+) or without (CTB−) axon transport. (A) Axon length is significantly lower in proximal CTB− as compared with proximal CTB+ (t-test, P < 0.01). (B) Axon volume is significantly lower in proximal CTB− as compared with proximal CTB+ (t-test, P < 0.05). (C) The distal cytoskeleton in CTB− ON has significantly more numbers of flocculent (0) axons than CTB+ ON. See Methods for description of cytoskeletal groups. (D) The nearest neighbor distance (NND) for mitochondria in the distal CTB+ ON is significantly higher than that of proximal CTB+ ON (t-test, P < 0.05). Error bars are SEM.
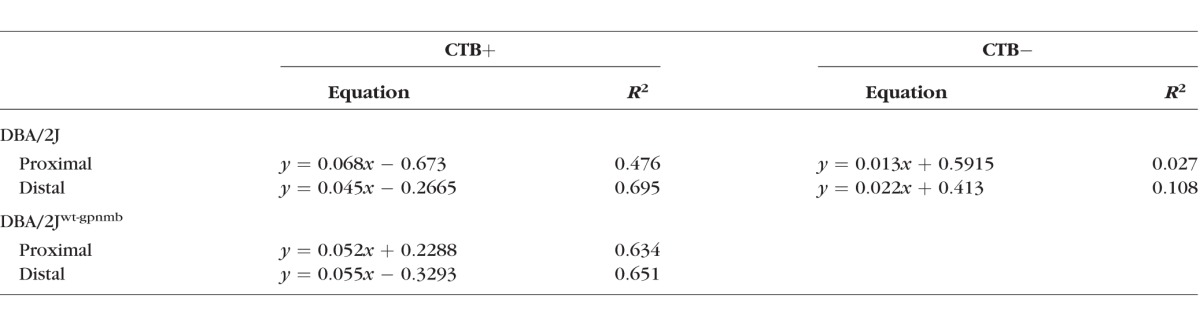
In line with evidence that more, larger mitochondria are necessary to support larger axons,20 a scatterplot of mitochondrial volume against axon volume for control D2-Gpnmb+ ON shows a strong positive correlation (Fig. 6A; Table 2). The correlations shift slightly for the D2-Gpnmb+ distal ON, suggesting that slightly less mitochondrial volume is required to support the equivalent axon volume in distal ON. Reconstructions of proximal and distal D2-Gpnmb+ ON were matched for axon volume to show the relative number, size, and distribution of mitochondria (Fig. 6A). The relationship between mitochondrial and axon volume is destroyed by axon transport deficit for proximal optic nerve (Fig. 6B); comparison of regression line slopes for CTB+ and CTB− proximal D2 optic nerve found them to be significantly different (F = 17.854, df = 51, P < 0.0001). Figure 6B compares proximal CTB+ and CTB− D2 ON; the CTB+ ON has a strong, positive correlation coefficient, similar to that of proximal D2-Gpnmb+ CTB+ ON (R2 = 0.476 and 0.634, respectively), while the CTB− mitochondrial to axon volume slope is not different from zero (R2 = 0.027). The axon reconstructions, matched for axon volume, show fewer mitochondria in the proximal D2 CTB− axon. For distal D2 ON (Fig. 6C), the CTB+ correlation coefficient is R2 = 0.695, which is also similar to the D2-Gpnmb+ distal ON (R2 = 0.651), while the CTB− relationship between mitochondrial and axon volume has no correlation (R2 = 0.013). The comparison of regression line slopes for CTB+ and CTB− distal optic nerve found them to not differ (F = 2.72, df = 63, P = 0.103). The axon reconstructions, chosen for the similar axon volumes, demonstrate how the CTB− axons have lost mitochondrial volume. See Table 2 for linear regression equations.
Figure 6.

Relationship of mitochondrial volume to axon volume. (A) Scatterplot of mitochondrial volume against axon volume for D2G proximal and distal ON (all are CTB+) shows a good correlation of mitochondria and axon volume for proximal (R2 = 0.634), and distal (R2 = 0.651) ON. The axon reconstructions to the right of the graph compare axon volume in proximal and distal D2-Gpnmb+ ON to demonstrate the maintenance of mitochondrial volume in axons with similar volume (μm3). (B) Scatterplot of mitochondrial volume against axon volume for D2 proximal ON for CTB+ and CTB− axons shows a correlation of mitochondria and axon volume for ON with good axon transport (CTB+; R2 = 0.476), but not for ON with axon transport deficit (CTB−; R2 = 0.027). The slopes are significantly different by linear regression (F = 17.854, df = 51, P < 0.0001). Axon reconstructions for proximal D2 ON show the decrease in mitochondrial volume in axons of similar volume with transport deficit (CTB−). (C) Scatterplot of mitochondrial volume against axon volume for D2 distal ON for CTB+ and CTB− axons shows a good correlation of mitochondria and axon volume for ON with good axon transport (CTB+; R2 = 0.695), but not for ON with axon transport deficit (CTB−; R2 = 0.108). The slopes are not statistically different by linear regression (F = 2.72, df = 63, P = 0.103). Axon reconstructions for distal D2 ON show the decrease in mitochondrial volume in axons of similar volume with anterograde transport deficit (CTB−).
Table 2.
Linear Regression Values for Mitochondrial Volume by Axon Volume
Autophagic Profiles
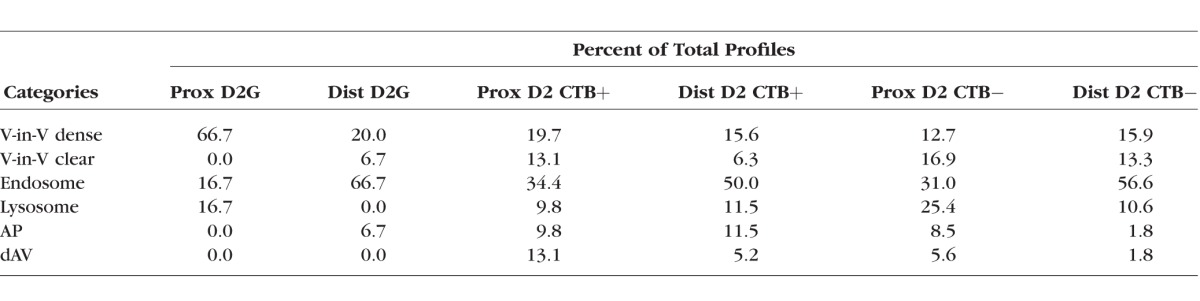
Autophagic vesicle numbers increase with glaucoma pathology, with D2 numbers significantly higher than D2-Gpnmb+ for both distal and proximal ON (t-test, P < 0.05 for proximal, and P < 0.001 for distal; Fig. 7A). The D2 ON increases in autophagic vesicles are observed primarily in the axons within optic nerves exhibiting anterograde transport deficit (Fig. 7B), suggesting increased autophagic activity with loss of anterograde transport (paired t-test for proximal ON, P < 0.001; distal ON, P < 0.01). We categorized the autophagic vesicles into six groups based on morphology, and some of these groups correspond to known autophagy profiles (Fig. 8A). To facilitate comparisons across groups, average numbers of autophagic profiles were normalized to the total volume of axons analyzed. In axons from CTB+ optic nerves, comparing proximal and distal autophagic vesicles showed higher numbers of all autophagic profiles in distal CTB+ ON (Figs. 8B–G). In the case of endosomes, there were significantly more in distal CTB+ ON than proximal CTB+ (Wilcoxon rank sum test, P < 0.01). There were also significantly more lysosomes in distal over proximal CTB+ ON (Wilcoxon rank sum test, P < 0.05). Loss of anterograde transport (CTB− ON) altered the average number of most profiles in both proximal and distal ON. Statistically significant increases in CTB− ON over CTB+ included the vesicle-in-vesicle clear (ViV-clear) profiles (Mann-Whitney U test, P < 0.05), endosomes (Mann-Whitney U test, P < 0.05), and lysosomes (Mann-Whitney U test, P < 0.001; Figs. 8C–E). In distal ON, loss of transport led to a trend toward higher numbers of ViV-dense and clear profiles, lysosomes, and endosomes, though these were not statistically significant changes. ViV-dense profiles, with single membranes and electron dense vesicular inclusions, may be late autophagosomes. Endosomes were vesicles without obvious inclusions. These were observed most frequently in distal ON, regardless of transport status (Fig. 8D). Transport loss significantly decreased the average number of autophagosomes (APs) in distal CTB− ON axons (Mann-Whitney U, P < 0.05). The average number of degradative autophagic vacuoles (dAV; also known as autolysosomes) were not different across proximal or distal axons, regardless of transport status. Table 3 shows the percentage of the total profiles observed in each category in the D2 and D2-Gpnmb+ (D2G) proximal and distal ONs. Interestingly, endosomes made up roughly 30% of all profiles in proximal ON, and approximately 50% of all profiles in distal ON, independent of transport status. The percentage of AP and dAV profiles decreased with transport loss in both proximal and distal axons. We do not directly compare autophagic vesicle percentages in D2 against D2-Gpnmb+ because so few autophagic vesicles were observed in D2-Gpnmb+ ON (Fig. 7A; Table 3).
Figure 7.
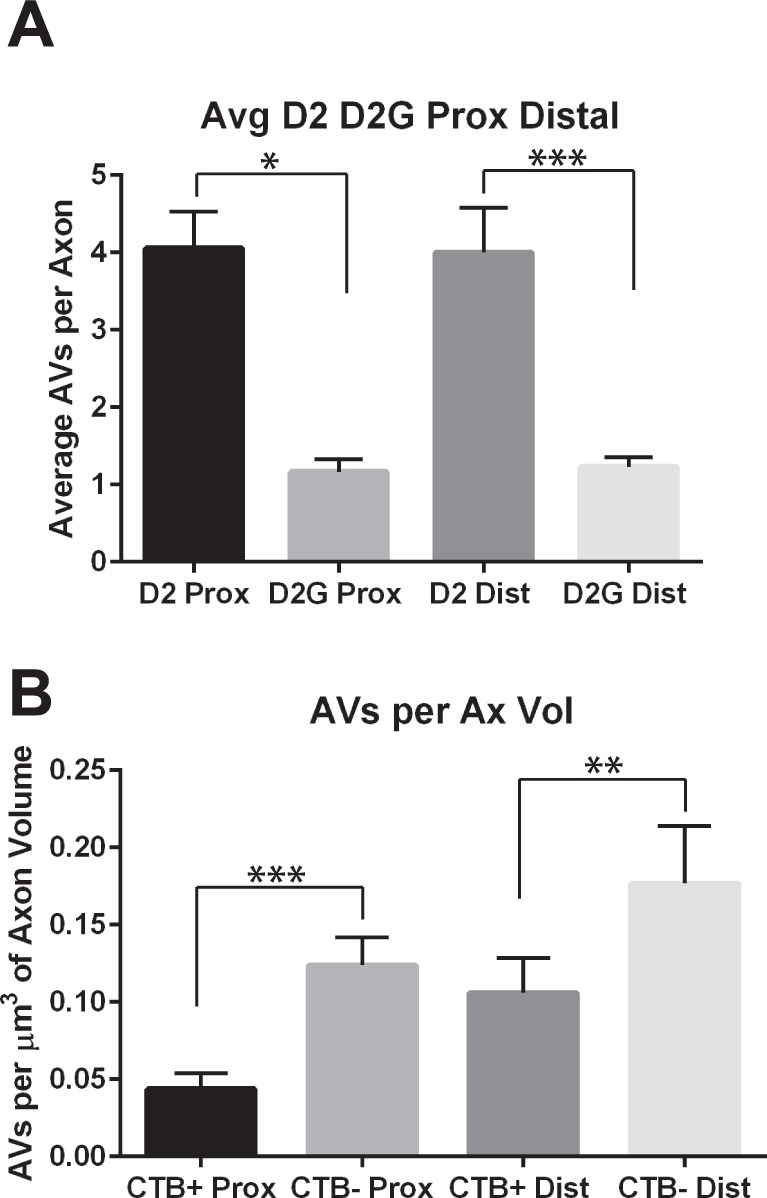
Quantification of autophagic vesicles (AVs) in D2 and D2G ON. (A) Average number of autophagic vesicles in proximal and distal D2 and D2G ON. Proximal D2 ON has significantly more autophagic vesicles than D2G (t-test, P < 0.05), and distal D2 ON has significantly more autophagic vesicles than distal D2G ON (t-test, P < 0.001). (B) Autophagic vesicles per volume of axon in D2 ON with (CTB+) and without (CTB−) anterograde axon transport. Data were normalized to axon volume to correct for the varying number of axons analyzed. Proximal CTB− ON had significantly greater numbers of autophagic vesicles per micrometers cubed axon as compared with proximal CTB+ (t-test, P < 0.001). Distal CTB− ON had significantly greater numbers of autophagic vesicles per micrometers cubed axon compared with distal CTB+ (t-test, P < 0.01). Error bars are SEM.
Figure 8.

Quantification of autophagic vesicle profiles in D2 ON. (A) Scanning EM micrographs showing the various autophagic vesicle profiles observed in the optic nerves of D2 and D2-Gpnmb+ mice. All vesicles and organelles that were not mitochondria or ER were placed in one of these six categories based on their morphology. The vesicle-in-vesicle (dense; ViV-dense) profiles were vesicles that had electron dense vesicles contained within. The vesicle-in-vesicle (clear; ViV-clear) profiles contained vesicles that were not electron dense. Endosomes were vesicles without inclusions. Lysosomes were single-membrane, electron-dense vesicles. Autophagosomes (AP) were double-membraned vesicles containing identifiable organelles. Degradative autophagic vacuoles (dAV), also known as autolysosomes, were single membrane vesicles containing debris not identifiable as an organelle but often were electron dense. (B) Average number of vesicle-in-vesicle (dense) profiles by axon volume in CTB+ and CTB− proximal and distal ON. The number at the base of each bar is the total number of profiles observed. There were no statistically significant differences across the groups. Given the possible double membrane and inner electron dense material, these profiles may be late autophagosomes. (C) Average number of vesicle-in-vesicle (clear) profiles in CTB+ and CTB− proximal and distal ON. ViV-clear profiles were significantly greater in proximal CTB− than CTB+ ON (Mann-Whitney U test, P < 0.05). Given the possible double membrane and clear vesicle inclusion, these profiles may be early autophagosomes, newly formed from the phagophore. (D) Average number of endosome profiles in CTB+ and CTB− proximal and distal ON. Endosomes were significantly increased in proximal CTB− compared with proximal CTB+ ON (Mann-Whitney U test, P < 0.05), in distal CTB+ compared with proximal CTB+ (Wilcoxon rank sum test, P < 0.01), in distal CTB− compared with proximal CTB+ (Mann-Whitney U test, P < 0.05), and in distal CTB− compared with proximal CTB− (Wilcoxon rank sum test, P < 0.01). (E) Average number of lysosome profiles in CTB+ and CTB− proximal and distal ON. Lysosomes were significantly increased in proximal CTB− compared with proximal CTB+ ON (Mann-Whitney U test, P < 0.001), and in distal CTB+ compared with proximal CTB+ ON (Wilcoxon rank sum test, P < 0.05). (F) Average number of autophagosome profiles (AP) in CTB+ and CTB− proximal and distal ON. Autophagosomes were significantly increased in distal CTB+ compared with distal CTB− ON (Mann-Whitney U test, P < 0.001). (G) Average number of degradative autophagic vacuole (dAV) profiles in CTB+ and CTB− proximal and distal ON. There were no statistically significant differences across the groups. Error bars are SEM.
Table 3.
Autophagic Vesicle Profiles Observed in Optic Nerve
Autophagosomes containing mitochondria were observed (Fig. 9A) in D2 ON, indicating that mitophagy does occur in the myelinated portion of the optic nerve. Despite the rarity of this subset of autophagosomes, profiles containing mitochondria were observed in proximal and distal CTB+ ON and in proximal CTB− ON. No autophagosomes in distal CTB− ON contained mitochondria. These data are not inconsistent with the hypothesis that a decrease in mitophagy occurs in the D2 ON.
Figure 9.

Analysis of mitophagy and phagophore incidence in D2 ON. (A) Examples of mitochondria enclosed within autophagosomes are depicted with their respective optic nerve locations. Numbers of autophagosomes containing a mitochondrion in the proximal and distal CTB+ and CTB- D2 ON are shown in the table. The low incidence of mitophagic profiles observed precluded statistical analysis. (B) Phagophores observed in the proximal and distal D2 ON. The phagophores in the center panel (arrowheads) are associated with endoplasmic reticulum (small arrows).
Phagophores are the isolation membranes that engulf organelles to be recycled in the autophagy pathway. We observed phagophores in the process of engulfing vesicles in both proximal and distal D2 ON (Fig. 9B).
Discussion
The contribution of autophagy to glaucoma has been explored by various groups who have found that chronic ocular hypertension leads to signs of autophagy increase, including accumulation of autophagic vacuoles in retinal ganglion cells1 and the ON.3 Autophagy is a protective mechanism because treatments that can prevent ON degeneration are reversed by autophagy inhibitors and improved with autophagy inducers.3 In a past study, we found increased markers of autophagy, including increased autophagosomes and LC3-II to LC3-I ratio, in the glaucomatous D2 ON.4 The present study differs in that we have been able to undertake a detailed analysis of autophagy and mitophagy, including quantifying individual classes of autophagic vesicles, using 3D-EM in axons from visual projections we know to lack anterograde transport as a component of glaucoma pathology. In addition, we have compared proximal and distal axons from those same control and glaucoma animals, allowing us to gain insight into the progression of pathology along the optic nerve.
The analyses of mitochondria and autophagy in this study yielded important distinctions; many of the mitochondrial-related measures were found to differ significantly across strain, including mitochondrial volume, cristae index, and membrane distance. There was one measurement, nearest neighbor distance (a measure of mitochondrial proximity to other mitochondria), that was significantly different for proximal and distal optic nerve for both D2 and D2-Gpnmb+ mice. This suggests it is a general property of mitochondrial distribution in the optic nerve. Other indices, by varying with transport status, were more closely associated with anterograde transport, including axon volume and the density of autophagic vesicles in axons.
In our previous publication, we observed significantly less intact mitochondria in the D2 than the D2-Gpnmb+ ON. That observation, in addition to increased autophagosome numbers, led us to suggest that mitophagy may be dysfunctional in the D2 ON.4 In this investigation, D2 mitochondria are again significantly less intact than those from D2-Gpnmb+ ON. However, when separated into groups by anterograde transport status, there were no differences in mitochondrial cristae index. That indicates anterograde transport deficit is independent of mitochondrial cristae index, at least by how we have defined it here. We observed no changes in mitochondria density in proximal and distal ON, within or across D2 and D2-Gpnmb+ groups. This contrasts with our TEM findings which showed that D2 ON had significantly more mitochondria than D2-Gpnmb+.4 One possibility to account for the difference is that we analyzed all ON axons in the TEM investigation while, due to the volume of analysis, we examined only the mitochondria in a small subset of axons per ON segment in this study. We did observe that the mitochondrial volume by axon volume was significantly lower in proximal D2 ON compared to D2-Gpnmb+. Mitochondrial volume by axon volume is arguably a better measure of energy capacity than mitochondrial number since it corrects for axon size. Within the D2 ON, when examining proximal and distal ON with or without transport, loss of transport abolished the established relationship between mitochondrial and axon volume,20 indicating that all CTB− axons are underserved by their mitochondria. Both proximal and distal ON lose axon volume with transport deficit, but the scatterplot data indicate the mitochondrial volume decreases occur in advance of the axon shrinkage. Mitochondrial volume can be a proxy for mitochondrial function and energy capacity, so these data associate anterograde transport deficit with impending energy failure. Whether mitochondria failure causes the axon transport deficit remains to be determined, though the byproducts of poorly functioning mitochondria (reactive oxygen species [ROS]) negatively impact transport. Others have shown ROS halt the axon transport of mitochondria prior to halting that of Golgi-derived vesicles, and anterograde transport is affected before retrograde.21 In addition, there was no change in mitochondrial shape factor with transport deficit, suggesting that mitochondrial morphology changes occur after axon transport inhibition.21 These observations combined with our data suggest the sequence of events appears to be first, axon transport inhibition, then mitochondrial volume decrease, then axon shrinkage. Our intention in future studies is to examine mitochondrial function directly in ON for which we know transport status in order to place mitochondrial bioenergetics within the sequence of events in optic neuropathy.
One motivation to examine proximal versus distal ON was to determine if we could distinguish among Wallerian degeneration or distal axonopathy as contributing to the optic neuropathy in the glaucomatous ON. There is evidence for both forms of degeneration in glaucoma.11,22 Distal axonopathy would predict significant changes in distal axon cytoskeleton and possible cargo accumulation in proximal portions of the ON. We did observe increased flocculent axons in distal CTB− ON, and cargo accumulation was limited to vesicle-in-vesicle (clear) profiles and lysosomes in proximal CTB− ON. Though the high number of flocculent axons in distal ON and cargo accumulations support distal axonopathy, we cannot rule out Wallerian degeneration because it can be asynchronous over a population of axons within a nerve and can initiate at multiple sites along the axon. Wallerian degeneration slow (Wlds), a fusion protein of an NAD+ synthesizing enzyme, NMNAT, and the N-terminal portion of a ubiquitination factor,23 has been shown to effectively delay the optic neuropathy of glaucoma.22 A recent investigation showed Wlds partially reverses ATP decline after axon transection by maintaining mitochondrial respiration and glycolysis.24 Given our observations of low ATP25 and mitochondrial changes in the D2 ON, Wlds likely delayed glaucomatous optic neuropathy by improving mitochondrial function.
Another rationale for examining proximal versus distal ON was to determine how the anterograde axon transport deficits11,26 may impact cargo (mitochondria and autophagic vesicle) distribution along the ON. The anterograde transport deficit in proximal CTB− ON led to significant accumulation of vesicle-in-vesicle (clear) and lysosome profiles; the significantly decreased axon volume may have exacerbated the situation. Though we do not know the identity of the vesicle-in-vesicle (clear) profiles, lysosomes originate in the retinal ganglion cell soma and fuse with autophagosomes to facilitate the recycling of engulfed organelles through the formation of the degradative autophagic vacuole (autolysosome).5 Others have shown this can occur within the axon.27 Because we observed lysosomes throughout the D2 and D2-Gpnmb+ ON, the loss of anterograde transport likely impacted the production of degradative autophagic vacuoles (autolysosomes) in the ON because of limited lysosomes.
Autophagy has a role in preventing neurodegeneration.28 Its importance to preventing neurodegeneration grows with age since a common feature of aging is a decline in autophagy function. Our 3D-EM analysis of autophagy in glaucomatous ON was based on identifying autophagic profiles, including endosomes, lysosomes, autophagosomes, and degradative autophagic vacuoles. Endosomes can also fuse with autophagosomes to form an amphisome, but they can also be signaling endosomes, which travel from the synapse to the cell soma. There were two common vesicle profiles, the vesicle-in-vesicle dense or clear, that could not unequivocally be placed in any of the known and well-described autophagic profiles. The vesicle-in-vesicle clear could be amphisomes, or they could be phagophores transitioning into autophagosomes that were newly formed from the ER and contain some ER membrane.29–31 Strikingly, optic nerve axons are enriched with ER, offering a ready supply of membrane for potential AP formation. Mitochondria have also been implicated in the source material for the phagophore.32 This certainly has implications for this analysis, though we observed no mitochondria adjacent to the phagophores we observed. The vesicle-in-vesicle dense profiles resemble late autophagosomes given the electron dense inclusions. However, confirmation of the identity of these vesicles requires immuno-electron microscopy, a goal of a future study.
Autophagy can be activated by many stress stimuli, including hypoxia,33 ER stress,34 protein aggregates,35 and energy depletion.36 We have shown an IOP-dependent decrease in ATP levels in D2 mouse ON,25 and increased numbers of autophagosomes,4 leading us to postulate that energy depletion activates autophagy in the glaucomatous ON. Treatment of chronic ocular hypertension with Nmnat3, an enzyme in the NAD biosynthetic pathway, was able to protect against optic neuropathy via a mechanism that included increased autophagy, also suggesting that energy depletion activates autophagy in glaucoma.3 The significant numbers of autophagic vesicles in CTB− proximal and distal ON compared to CTB+ suggest cellular stress related to anterograde transport breakdown activated autophagy. In proximal ON, all autophagic vesicle profiles were increased in ON with transport deficit (CTB−) compared with CTB+. For distal ON, lysosomes, autophagosomes, and degradative autophagic vacuoles were either decreased or unchanged with transport deficit. The discrepancy between proximal and distal within the transport deficit groups could derive from the maturation process of autophagosomes. Live imaging studies have shown that autophagosomes form preferentially at the axon tip and then are retrogradely transported back to the cell body.37,38 They mature as they are transported, fusing with lysosomes or endosomes. Retrograde transport is not significantly decreased in D2 ON until, on average, 13 months of age,39 so autophagic profile accumulation in proximal ON could be the result of retrogradely moving mitochondria and vesicles that get trapped in the diminished axon volume observed there, in addition to the accumulation of vesicle-in-vesicle (clear) profiles and lysosomes in proximal ON that should be moving anterogradely but are not because of transport deficit. The significantly fewer autophagosomes in the CTB− as compared with CTB+ distal ON could also reflect their retrograde movement that dAVs may not undergo, since dAV numbers were similar regardless of transport status. Conclusions about regional comparisons of autophagic vesicle populations are made complicated by autophagosomes, which have a tendency to form at the synapse, but can nevertheless engulf cargo like mitochondria along the axon.27 Our analysis supports that organelles can be engulfed by autophagosomes all along axons because we observed phagophore formation in both proximal and distal ON.
Mitophagy is the engulfment of a mitochondrion by an autophagosome so that its components can be recycled. Membrane depolarization is one trigger for mitophagy, though a recent study demonstrated that depolarization was necessary but not sufficient for mitochondria to be incorporated into autophagosomes and recycled.27 Our interest in mitophagy in the glaucomatous ON was piqued by our observation of high numbers of less intact mitochondria in the D2 ON,4 as well as observations that mitochondrial biogenesis is significantly decreased in D2 RGCs with age.40 High levels of autophagic activity without an impact on mitochondrial number suggested a possible decrease in mitophagy in the D2 ON. We observed few mitochondria engulfed in autophagosomes in the D2 ON, but they were observed, indicating that mitophagy can occur in myelinated optic nerve axons. The numbers observed were too small for statistical analysis, but are consistent with decreased mitophagy in an overall environment of high autophagic activity.
Acknowledgments
The authors acknowledge Topister Bonyo, Julia Hurst, Yvonne Newsome, and Erin Salvaggio for assistance with the mitochondrial scoring and autophagic vesicle identification and quantification. Matthew A. Smith assisted with tissue harvesting and imaging. Staining, imaging, and preliminary analyses were performed by Renovo Neural, Inc. (Cleveland, OH, USA).
Supported by grants through institutional funds (DMI; Rootstown, OH, USA), seed money from the NEOMED Office of Research and Sponsored Projects (Rootstown, OH, USA), and National Institutes of Health Grant EY022358 (SDC; Bethesda, MD, USA).
Disclosure: D. Kleesattel, None; S.D. Crish, None; D.M. Inman, None
References
- 1. Park HYL,, Kim JH,, Park CK. Activation of autophagy induces retinal ganglion cell death in a chronic hypertensive glaucoma model. Cell Death Dis. 2012; 3: e290. [DOI] [PMC free article] [PubMed] [Google Scholar]
- 2. Deng S,, Wang M,, Yan Z,, et al. Autophagy in retinal ganglion cells in a Rhesus monkey chronic hypertensive glaucoma model. PLoS One. 2013; 8: 1–12. [DOI] [PMC free article] [PubMed] [Google Scholar]
- 3. Kitaoka Y,, Munemasa Y,, Kojima K,, Hirano A,, Ueno S,, Takagi H. Axonal protection by Nmnat3 overexpression with involvement of autophagy in optic nerve degeneration. Cell Death Dis. 2013; 4: e860. [DOI] [PMC free article] [PubMed] [Google Scholar]
- 4. Coughlin L,, Morrison RS,, Horner PJ,, Inman DM. Mitochondrial morphology differences and mitophagy deficit in murine glaucomatous optic nerve. Invest Ophthalmol Vis Sci. 2015; 56: 1437–1446. [DOI] [PMC free article] [PubMed] [Google Scholar]
- 5. Klionsky D,, Agholme L,, Agnello M,, et al. Guidelines for the use and interpretation of assays for monitoring autophagy. Autophagy. 2012; 8: 445–544. [DOI] [PMC free article] [PubMed] [Google Scholar]
- 6. Nixon RA,, Wegiel J,, Kumar A,, et al. Extensive involvement of autophagy in Alzheimer's disease: an immuno-electron microscopy study. J Neuropathol Exp Neurol. 2005; 64: 113–122. [DOI] [PubMed] [Google Scholar]
- 7. Waller A. Experiments on the section of the glossopharyngeal and hypoglossal nerves of the frog and observations of the alterations produced thereby in the structure of their primitive fibres. Philos Trans R Soc London. 1850; 140: 423–429. [Google Scholar]
- 8. Cavanagh J. The “dying back” process. A common denominator in many naturally occurring and toxic neuropathies. Arch Pathol Lab Med. 1979; 103: 659–664. [PubMed] [Google Scholar]
- 9. Cavanagh J. The significance of the “dying back” process in experimental and human neurological disease. Int Rev Exp Pathol. 1964; 3: 219–267. [PubMed] [Google Scholar]
- 10. Deleglise B,, Magnifico S,, Duplus E,, et al. β-amyloid induces a dying-back process and remote trans-synaptic alterations in a microfluidic-based reconstructed neuronal network. Acta Neuropathol Commun. 2014; 2: 145. [DOI] [PMC free article] [PubMed] [Google Scholar]
- 11. Crish SD,, Sappington RM,, Inman DM,, Horner PJ,, Calkins DJ. Distal axonopathy with structural persistence in glaucomatous neurodegeneration. Proc Natl Acad Sci U S A. 2010; 107: 5196–5201. [DOI] [PMC free article] [PubMed] [Google Scholar]
- 12. Holcomb PS,, Hoffpauir BK,, Hoyson MC,, et al. Synaptic inputs compete during rapid formation of the calyx of Held: a new model system for neural development. J Neurosci. 2013; 33: 12954–12969. [DOI] [PMC free article] [PubMed] [Google Scholar]
- 13. Schindelin J,, Arganda-Carreras I,, Frise E,, et al. Fiji: an open-source platform for biological-image analysis. Nat Methods. 2012; 9: 676–682. [DOI] [PMC free article] [PubMed] [Google Scholar]
- 14. Fiala JC,, Harris KM. Cylindrical diameters method for calibrating section thickness in serial electron microscopy. J Microsc. 2001; 202: 468–472. [DOI] [PubMed] [Google Scholar]
- 15. Fiala JC. Reconstruct: a free editor for serial section microscopy. J Microsc. 2005; 218: 52–61. [DOI] [PubMed] [Google Scholar]
- 16. Fishman P. Role of membrane gangliosides in the binding and action of bacterial toxins. J Membr Biol. 1982; 69: 85–97. [DOI] [PubMed] [Google Scholar]
- 17. Luppi PH,, Fort P,, Jouvet M. Iontophoretic application of unconjugated cholera toxin B subunit (CTb) combined with immunohistochemistry of neurochemical substances: a method for transmitter identification of retrogradely labeled neurons. Brain Res. 1990; 534: 209–224. [DOI] [PubMed] [Google Scholar]
- 18. Angelucci A,, Clascá F,, Sur M. Anterograde axonal tracing with the subunit B of cholera toxin: a highly sensitive immunohistochemical protocol for revealing fine axonal morphology in adult and neonatal brains. J Neurosci Methods. 1996; 65: 101–112. [DOI] [PubMed] [Google Scholar]
- 19. Ward NJ,, Ho KW,, Lambert WS,, Weitlauf C,, Calkins DJ. Absence of transient receptor potential vanilloid-1 accelerates stress-induced axonopathy in the optic projection. J Neurosci. 2014; 34: 3161–3170. [DOI] [PMC free article] [PubMed] [Google Scholar]
- 20. Perge JA,, Koch K,, Miller R,, Sterling P,, Balasubramanian V. How the optic nerve allocates space energy capacity, and information. J Neurosci. 2009; 29: 7917–7928. [DOI] [PMC free article] [PubMed] [Google Scholar]
- 21. Fang C,, Bourdette D,, Banker G. Oxidative stress inhibits axonal transport: implications for neurodegenerative diseases. Mol Neurodegener. 2012; 7: 29. [DOI] [PMC free article] [PubMed] [Google Scholar]
- 22. Howell GR,, Libby RT,, Jakobs TC,, et al. Axons of retinal ganglion cells are insulted in the optic nerve early in DBA/2J glaucoma. J Cell Biol. 2007; 179: 1523–1537. [DOI] [PMC free article] [PubMed] [Google Scholar]
- 23. Mack TG,, Reiner M,, Beirowski B,, et al. Wallerian degeneration of injured axons and synapses is delayed by a Ube4b/Nmnat chimeric gene. Nat Neurosci. 2001; 4: 1199–1206. [DOI] [PubMed] [Google Scholar]
- 24. Godzik K,, Coleman MP. The axon-protective WLDS protein partially rescues mitochondrial respiration and glycolysis after axonal injury. J Mol Neurosci. 2015; 55: 865–871. [DOI] [PMC free article] [PubMed] [Google Scholar]
- 25. Baltan S,, Inman DM,, Danilov C,, Morrison RS,, Calkins DJ,, Horner PJ. Metabolic vulnerability disposes retinal ganglion cell axons to dysfunction in a model of glaucomatous degeneration. J Neurosci. 2010; 30: 5644–5652. [DOI] [PMC free article] [PubMed] [Google Scholar]
- 26. Dengler-Crish CM,, Smith MA,, Inman DM,, Young JW,, Wilson GN,, Crish SD. Anterograde transport blockade precedes deficits in retrograde transport in the visual projection of the DBA/2J mouse model of glaucoma. Front Neurosci. 2014; 8: 290. [DOI] [PMC free article] [PubMed] [Google Scholar]
- 27. Ashrafi G,, Schlehe JS,, LaVoie MJ,, Schwarz TL. Mitophagy of damaged mitochondria occurs locally in distal neuronal axons and requires PINK1 and Parkin. J Cell Biol. 2014; 206: 655–670. [DOI] [PMC free article] [PubMed] [Google Scholar]
- 28. Levine B,, Kroemer G. Autophagy in the pathogenesis of disease. Cell. 2008; 132: 27–42. [DOI] [PMC free article] [PubMed] [Google Scholar]
- 29. Hayashi-Nishino M,, Fujita N,, Noda T,, Yamaguchi A,, Yoshimori T,, Yamamoto A. A subdomain of the endoplasmic reticulum forms a cradle for autophagosome formation. Nat Cell Biol. 2009; 11: 1433–1437. [DOI] [PubMed] [Google Scholar]
- 30. Ylä-Anttila P,, Vihinen H,, Jokitalo E,, Eskelinen EL. 3D tomography reveals connections between the phagophore and endoplasmic reticulum. Autophagy. 2009; 5: 1180–1185. [DOI] [PubMed] [Google Scholar]
- 31. Biazika J,, Ylä-Anttilaa P,, Vihinenb H,, Jokitalob E,, Eskelinena E-L. Ultrastructural relationship of the phagophore with surrounding organelles. Autophagy. 2015; 11: 439–451. [DOI] [PMC free article] [PubMed] [Google Scholar]
- 32. Hamasaki M,, Furuta N,, Matsuda A,, et al. Autophagosomes form at ER-mitochondria contact sites. Nature. 2013; 495: 389–393. [DOI] [PubMed] [Google Scholar]
- 33. Liu L,, Feng D,, Chen G,, et al. Mitochondrial outer-membrane protein FUNDC1 mediates hypoxia-induced mitophagy in mammalian cells. Nat Cell Biol. 2012; 14: 177–185. [DOI] [PubMed] [Google Scholar]
- 34. Carloni S,, Albertini MC,, Galluzzi L,, Buonocore G,, Proietti F,, Balduini W. Increased autophagy reduces endoplasmic reticulum stress after neonatal hypoxia-ischemia: role of protein synthesis and autophagic pathways. Exp Neurol. 2014; 255: 103–112. [DOI] [PubMed] [Google Scholar]
- 35. Metcalf DJ,, García-Arencibia M,, Hochfeld WE,, Rubinsztein DC. Autophagy and misfolded proteins in neurodegeneration. Exp Neurol. 2010; 238: 22–28. [DOI] [PMC free article] [PubMed] [Google Scholar]
- 36. Lee J,, Giordano S,, Autophagy Zhang J. mitochondria and oxidative stress: cross-talk and redox signalling. Biochem J. 2012; 441: 523–540. [DOI] [PMC free article] [PubMed] [Google Scholar]
- 37. Maday S,, Wallace KE,, Holzbaur ELF. Autophagosomes initiate distally and mature during transport toward the cell soma in primary neurons. J Cell Biol. 2012; 196: 407–417. [DOI] [PMC free article] [PubMed] [Google Scholar]
- 38. Lee S,, Sato Y, Nixon Ra. Lysosomal proteolysis inhibition selectively disrupts axonal transport of degradative organelles and causes an Alzheimer's-like axonal dystrophy. J Neurosci. 2011; 31: 7817–7830. [DOI] [PMC free article] [PubMed] [Google Scholar]
- 39. Buckingham BP,, Inman DM,, Lambert WS,, et al. Progressive ganglion cell degeneration precedes neuronal loss in a mouse model of glaucoma. J Neurosci. 2008; 28: 2735–2744. [DOI] [PMC free article] [PubMed] [Google Scholar]
- 40. Guo X,, Dason ES,, Zanon-Moreno V,, et al. PGC-1α signaling coordinates susceptibility to metabolic and oxidative injury in the inner retina. Am J Pathol. 2014; 184: 1017–1029. [DOI] [PubMed] [Google Scholar]