Abstract
We report a case series of five patients with pancreatic acinar cell carcinoma who received surgical treatment and compared the preoperative contrast-enhanced endoscopic ultrasound (EUS) and EUS elastography patterns with the surgical specimens. The contrast-enhanced EUS indicated vascular tumors with gradual enhancement in four patients and a hypovascular tumor in one patient. The elastography indicated an elastic score of 3 (hard lesion with softer border) in two patients and a score of 5 (hard lesion, which included the surrounding area) in two patients. In tumors with an elastic score of 5, the pathology exhibited abundant hyalinizing fibrous stroma or massive tumor invasion to the surrounding tissue. We concluded that acinar cell carcinoma of the pancreas has various patterns of EUS contrast-enhancement and elastography, depending on the pathologic phenotype.
Introduction
Acinar cell carcinoma is a rare pancreatic cancer that accounts for less than 1 % of all pancreatic cancers 1 with a better prognosis compared with the more common pancreatic ductal adenocarcinoma at the same stage 2 3.
Endoscopic ultrasound (EUS) has become one of the most popular assessment tools for pancreatic lesions. Although many reports on EUS elastography and contrast-enhanced EUS in pancreatic ductal adenocarcinoma have been published, there have only been a few reports with regard to EUS findings, especially those of contrast-enhanced EUS, in pancreatic acinar cell carcinoma 4. Here, we report the combined features of both EUS elastography and contrast-enhanced EUS with special emphasis on the interpretation of pathological findings.
Case series
We performed a retrospective review of five patients diagnosed with pancreatic acinar cell carcinoma who underwent EUS examinations before surgical resection. EUS elastography was performed in four patients and contrast-enhanced harmonic EUS (CH-EUS) was performed in all five patients using Sonazoid® (16 µL as perfluorobutane, Daiichi Sankyo, Tokyo, Japan) as the contrast agent. The EUS elastography was interpreted via pattern recognition according to the report from Giovannini et al. 5 which classified the elastography pattern into five elastic scores: score 1, homogeneously soft tissue; score 2, heterogeneously soft tissue; score 3, distortion at the edge of the area with minimal heterogeneity that represents small adenocarcinoma; score 4, hypoechoic region in the center surrounded by harder tissue; and score 5, heterogeneously hard tissue that represents advanced pancreatic adenocarcinoma.
The resected surgical specimens were evaluated. The amount of vascular components was evaluated by counting the number of small arteries within 20 high power fields (HPF, × 200), with an average of 3 – 5 vessels per HPF in normal pancreatic tissue. The fibrosis was quantitatively assessed by the type of fibrosis (e. g., hyalinizing fibrosis), and qualitatively assessed by estimating the percentage of the fibrosis area and classified as normal (0 – 10 %), mild (10 – 40 %), moderate (40 – 80 %), or severe (80 – 100 %).
Results
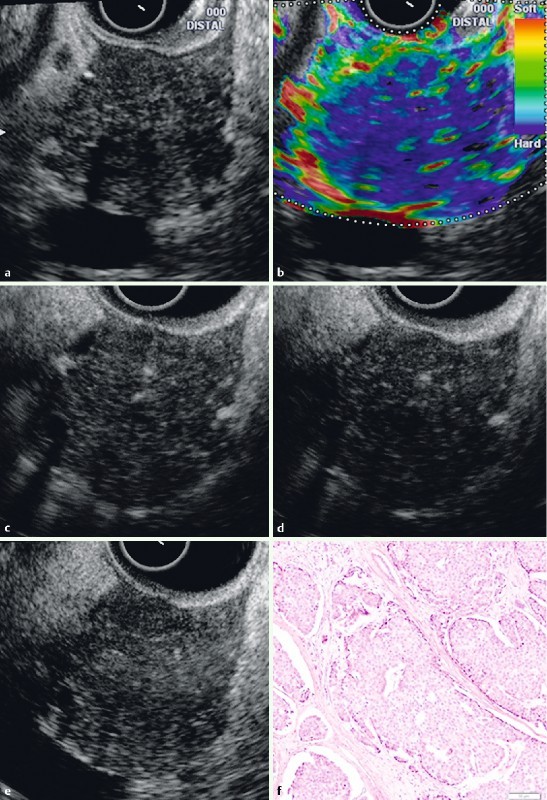
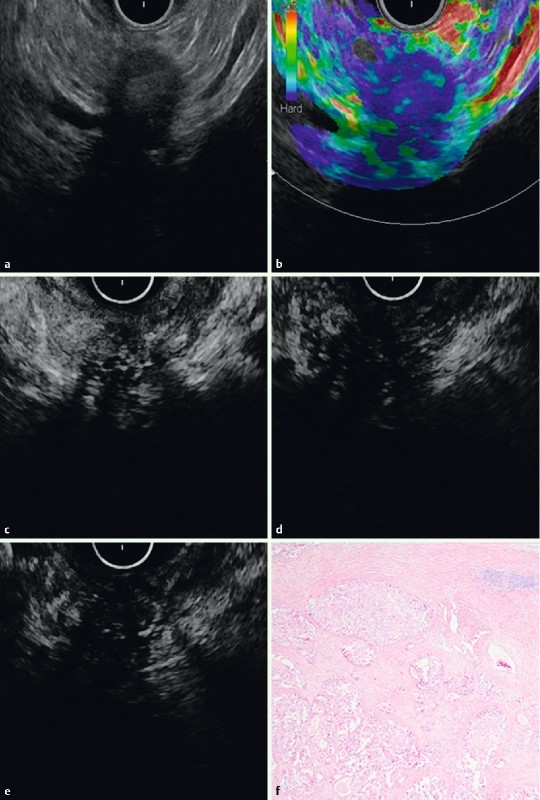
The tumor characteristics and EUS B-mode (brightness mode) findings are presented in Table 1. Acinar cell carcinoma was diagnosed in all patients, and one had acinar cell carcinoma with a mucinous carcinoma component. The EUS elastography and CH-EUS findings in each patient are listed in Table 2. The EUS B-mode image, EUS elastography image, and CH-EUS of patients with elastic scores of 3 and 5 are shown in Fig. 1 and Fig. 2, respectively.
Table 1. Characteristics and pathological findings of acinar cell carcinoma.
| Patient 1 | Patient 2 | Patient 3 | Patient 4 | Patient 5 | |
| Size, cm | 7 | 2 | 4 | 2.5 | 3.5 |
| Location (pancreas) | Head | Head | Head | Tail | Body |
| EUS echogenicity | Slightly hyperechoic | Hypoechoic | Isoechoic | Hypoechoic | Hypoechoic |
| Pancreatic duct dilation | Yes | Yes | Yes | No | Yes |
| Calcification | No | No | No | No | Yes |
| Cystic component | Yes | No | No | No | No |
| Histology | Acinar cell carcinoma with a mucinous carcinoma component | Acinar cell carcinoma | Acinar cell carcinoma | Acinar cell carcinoma | Acinar cell carcinoma |
| Additional histological findings | ns | Intraductal component | ns | Hyalinization | Ossification |
| Invasive component | Massive | Minimal | Massive | Minimal | Minimal |
| Fibrosis grade1 | Mild | Normal | Mild | Moderate | Mild |
| Fibrosis area | 20 % | 5 % | 20 % | 65 % | 30 % |
| Hyalinizing fibrosis | None | None | Partially + | Diffuse + | None |
| Vasculature2 | 83 | 1 | 3 | 1 | 2 |
EUS, endoscopic ultrasound; ns, non-specific.
Fibrosis grade: normal 0 – 10 %, mild 10 – 40 %, moderate 40 – 80 %, or severe 80 – 100 %.
Number of small arteries in 20 high power fields.
Area calculated included the peripancreatic vessels involved by the tumor.
Table 2. Endoscopic ultrasound (EUS) elastography of acinar cell carcinoma analyzed using elastic score and contrast-enhanced harmonic EUS.
| Patient 1 | Patient 2 | Patient 3 | Patient 4 | Patient 5 | |
| Elastography pattern | Score 3 | Score 3 | Score 5 | Score 5 | Not performed |
| Contrast enhanced harmonic EUS | Slightly decreased enhancement at 1 min, followed by a continuously increasing enhancement at 3 to 5 min | Uniformly increasing enhancement | Strong continuous enhancement | Early enhancement within 1 min, followed by washout to hypovascular | Early enhancement, followed by gradual decrease after 1 min |
Fig. 1.

EUS B-mode image (a), EUS elastography, and contrast-enhanced EUS of a patient with an elastic score of 3 (patient number 2). Using EUS elastography (b), the lesion exhibits harder tissue (blue color) than the surrounding tissue. The borders of the lesion exhibit a red color (soft) in the elastography, which is correlated with minimal tumor invasion of the surrounding tissue via histology. The contrast-enhanced EUS study indicated a uniform increased enhancement at 1 minute (c), 3 minutes (d) and 5 minutes (e) in the contrast-enhanced harmonic mode. The histological results (f) indicated acinar cell carcinoma with an intraductal component. The fibrosis was minimal.
Fig. 2.

EUS B-mode image (a), EUS elastography, and contrast-enhanced harmonic study of a patient with an elastic score of 5 (patient number 4). Using EUS elastography (b), the lesion exhibited harder tissue (blue color) than the surrounding tissue. The contrast-enhanced EUS study indicated a rapid, increased enhancement and washout within the first minute (c). At 3 minutes (d) and 5 minutes (e), the tumor exhibited hypovascularity. The histological results (f) indicated acinar cell carcinoma with abundant hyalinizing fibrosis.
Discussion
Acinar cell carcinoma exhibits variations in histology; thus, we hypothesized that the elastography and contrast-enhancement features of acinar cell carcinoma should reflect the pathologic characteristics. Using EUS elastography, our study identified elastic scores of 3 in three patients and scores of 5 in two patients. An elastic score of 3 indicates tissue distortion at the edge of the heterogeneously hard lesion. This finding was compatible with the histology, which indicated mild fibrosis and minimal invasion of the surrounding tissue. In the two patients with a score of 5, there was massive tumor invasion of the surrounding tissue with hyalinizing fibrosis component in one patient and massive hyalinizing fibrosis but with minimal invasion of the surrounding tissue in the other patient. This finding correlated with the elastography pattern of the blue area (i. e., hard tissue) that expanded to the surrounding area. According to these findings, both the hyalinizing fibrosis and the invasive component are factors that determine the elastography pattern.
The contrast-enhanced harmonic EUS study demonstrated various patterns of enhancement. In the patient with rapid enhancement followed by a washout pattern, the histology indicated an abundant amount of hyalinization. However, the number of small arteries is not clearly related to the pattern of enhancement. This finding may be because of the limited number of patients and other factors, such as the amount of fibrosis and invasion of the surrounding tissue. Our study showed that EUS elastography did not convey any advantage in the differential diagnosis of acinar cell carcinoma from pancreatic ductal adenocarcinoma. On the other hand, CH-EUS showed the different enhancement patterns, with gradual enhancement in acinar cell carcinoma compared with hypo-enhancement in pancreatic ductal adenocarcinoma. As a result, malignant acinar cell carcinoma could not be excluded in hyperenhanced pancreatic lesions with hard consistency, particularly with the presence of other B mode and/or clinical features of malignancy.
In summary, EUS elastography and contrast-enhanced EUS imaging in acinar cell carcinoma reflect tumor histology. Most lesions have an elastic score similar to findings in pancreatic ductal adenocarcinoma. Moreover, the contrast-enhanced study indicated at least three patterns of enhancement that reflect the tumor microstructure.
Footnotes
Competing interests: None
References
- 1.Chen J, Baithun S I. Morphological study of 391 cases of exocrine pancreatic tumours with special reference to the classification of exocrine pancreatic carcinoma. J Pathol. 1985;146:17–29. doi: 10.1002/path.1711460103. [DOI] [PubMed] [Google Scholar]
- 2.Wisnoski N C, Townsend C M Jr, Nealon W H. et al. 672 patients with acinar cell carcinoma of the pancreas: a population-based comparison to pancreatic adenocarcinoma. Surgery. 2008;144:141–148. doi: 10.1016/j.surg.2008.03.006. [DOI] [PubMed] [Google Scholar]
- 3.Kitagami H, Kondo S, Hirano S. et al. Acinar cell carcinoma of the pancreas: clinical analysis of 115 patients from Pancreatic Cancer Registry of Japan Pancreas Society. Pancreas. 2007;35:42–46. doi: 10.1097/mpa.0b013e31804bfbd3. [DOI] [PubMed] [Google Scholar]
- 4.Hirooka Y, Itoh A, Kawashima H. et al. Diagnosis of pancreatic disorders using contrast-enhanced endoscopic ultrasonography and endoscopic elastography. Clin Gastroenterol Hepatol. 2009;7:63–67. doi: 10.1016/j.cgh.2009.08.025. [DOI] [PubMed] [Google Scholar]
- 5.Giovannini M, Hookey L C, Bories E. et al. Endoscopic ultrasound elastography: the first step towards virtual biopsy? Preliminary results in 49 patients. Endoscopy. 2006;38:344–348. doi: 10.1055/s-2006-925158. [DOI] [PubMed] [Google Scholar]


