Abstract
Hydride attack at a ferric heme–NO to give an Fe–HNO intermediate is a key step in the global N-cycle. We demonstrate differential reactivity when six- and five-coordinate ferric heme-NO models react with hydride. Although Fe–HNO formation is thermodynamically favored from this reaction, Fe–H formation is kinetically favored for the 5C case.
Introduction
Nitroxyl (HNO) is gaining attention as a significant player in the overall biology of nitric oxide (NO) due to its involvement as a reactive intermediate in the global N-cycle.1-4 HNO can be generated by metal-mediated and organic processes.5, 6 Heme–HNO species are present in the reaction cycles of cyt c nitrite reductases (via proton attack on a heme-bound NO),7 and in fungal cyt P450 NO reductases (via hydride attack on a ferric heme–NO) en route to N2O formation.8 Very little experimental information on heme model-HNO compounds is available.1-4, 9-12 Farmer and coworkers have reported the spectroscopic characterization of several heme protein-HNO adducts.13 Coordination non-heme compounds with HNO ligands have been reviewed.1, 2, 14 Related anionic (i.e., non-protonated) synthetic porphyrin-NO compounds of the form [(por)Fe(NO)]− 9, 10, 12, 15 have been characterized, and two such species, namely [(TFTTBr8)Fe(NO)]− (TFTTBr8 = octabromo[tetrakis(pentafluorophenyl)porphyrinato dianion)16 and [(OEP)Fe(NO)]− (OEP = octaethylpoprhyrinato dianion)17 have been structurally characterized by X-ray crystallography. Although density functional theory (DFT) calculations have aided significantly in our theoretical understanding of heme–HNO compounds, 3, 7, 18-20 the general lack of appropriate experimental heme–HNO models has hindered research in this important area.
We recently reported that hydride attack at the coordinated NO group in a ferric [(OEP)Fe(NO)(5-MeIm)]+ compound generates the Fe–HNO derivative (eq 1),21 modeling a key step in cyt P450nor catalysis. Of prime importance is an examination of factors that lead to successful hydride attack at
| (1) |
the coordinated NO of ferric–NO hemes. The availability of both six-coordinate and five-coordinate ferric–NO heme models has allowed us to investigate hydride attack at the coordinated NO and/or the Fe center experimentally and computationally (e.g., the 5C case shown in eq 2).
 |
Results and discussion
Following up on our earlier report, we have determined that the attack of hydride at the coordinated NO groups of six-coordinate cationic ferric-NO heme models can be quite general. In this work, we prepared several [(por)Fe(NO)(L)]+ compounds (por = dianions of protoporphyrin IX dimethyl ester (PPDME), OEP, and TTP (tetratolylporphyrin)). The crystal structure of [(PPDME)Fe(NO)(5-MeIm)]SbF6, an excellent model for histidine-ligated (PPIX)Fe, is shown in Fig. 1.‡
Fig. 1.
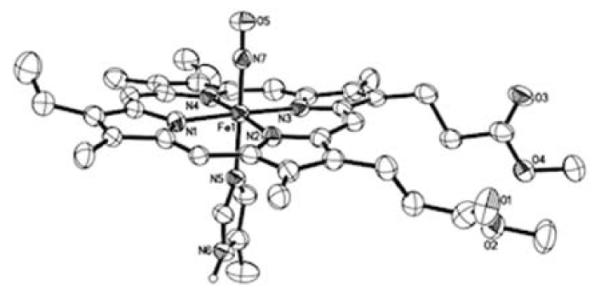
Molecular structure of the cation of [(PPDME)Fe(NO)(5-MeIm)]SbF6 in the space group (with thermal ellipsoids drawn at 50%). The H atoms (except for the imidazole N6 proton) and the anion have been omitted for clarity. Fe1–N7 = 1.654(5) Å, N7–O5 = 1.133(6) Å, Fe1–N5 = 1.990(5), ∠Fe1–N7–O5 = 174.8(5)°.
The reactions of these cations with borohydride (as the source of hydride) are best carried out at low temperature (−50 to −20 °C), as the products decompose readily at higher temperatures. For example, with the reaction [(PPDME)Fe(NO)(1-MeIm)]+ cation (υNO 1915 cm−1) with borohydride generates the (PPDME)Fe(HNO)(1-MeIm) product characterized by a new band in its IR spectrum at 1384 cm−1 assigned to the υNO of the newly-formed Fe–HNO group (Fig. 2). This Fe–HNO decomposes even at this temperature to the paramagnetic (PPDME)Fe(NO) species (υNO 1672 cm−1) (see later).
Fig. 2.
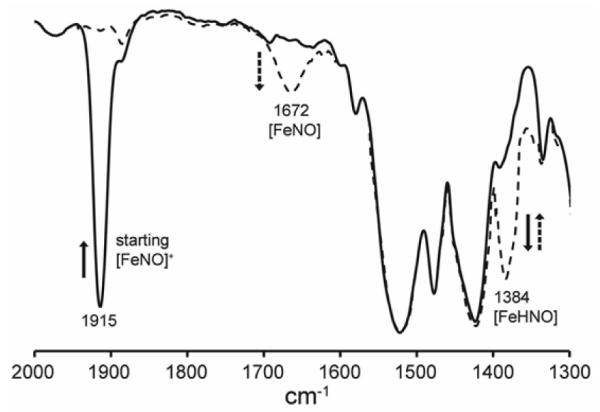
IR spectroscopic characterization of the bound HNO ligand in (PPDME)Fe(HNO)(1-MeIm), showing formation of the υNO 1384 cm−1 band (dashed line) upon hydride addition to the cationic precursor (υNO 1915 cm−1). The new 1384 cm−1 band slowly converts to the band at 1672 cm−1.
The generated (PPDME)Fe(HNO)(1-MeIm) product is also characterized by a singlet peak at 13.64 ppm in the 1H NMR spectrum that splits into a doublet (JNH 77 Hz) with 15NO labeling (Fig. 3). The 1H NMR spectra from the related reaction to generate the (PPDME)Fe(HNO)(5-MeIm) analogue are shown in Fig. S1a. The low-temperature IR and 1H NMR spectral data for these and other Fe–HNO compounds prepared in this work are collected in Table 1.
Fig. 3.
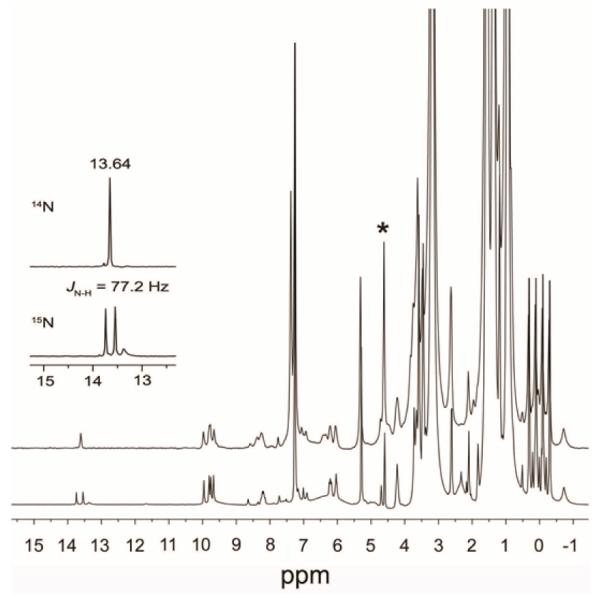
1H NMR spectra (in CDCl3) of the reaction of [(PPDME)Fe(NO)(1-MeIm)]OTf with [NBu4]BH4 to generate (PPDME)Fe(HNO)(1-MeIm). The bottom spectrum showing the splitting of the Fe-HNO peak at 13.64 ppm into a doublet was obtained using [(PPDME)Fe(15NO)(1-MeIm)]OTf in the reaction. The peak labeled * is due to the H2 decomposition product (see text and Fig. S2).
Table 1.
Spectral data for the precursor [(por)Fe(NO)(L)]+ and (por)Fe(HNO)(L) complexes.a
| [(por)Fe(NO)L]+ |
(por)Fe(HNO)(L) |
|||
|---|---|---|---|---|
| por | L | IR (cm−1) | IR (cm−1) | 1H NMR, ppmb |
| OEP | ImH | 1911 | 1381 | 13.93 (78) |
| 5-MeIm | 1910 | 1383 | 13.99 (76) | |
| 1-MeIm | 1912 | 1388 | 13.72 (77) | |
|
| ||||
| PPDME | ImH | 1915 | 1382 | 13.90 (76) |
| 5-MeIm | 1912 | 1382 | 13.93 (77) | |
| 1-MeIm | 1915 | 1384 | 13.64 (77) | |
|
| ||||
| TTP | ImH | 1917 | 1386 | 14.20 (76) |
| 5-MeIm | 1912 | 1381 | 14.26 (76) | |
| 1-MeIm | 1914 | 1389 | 14.02 (76) | |
IR data in CHCl3 (at −45 °C), and 1H NMR data in CDCl3 (at −20 °C).
The JN-H coupling constants (in Hz) for the Fe(H15NO) derivatives are in brackets.
The spectral data for the Fe–HNO complexes are reproduced well by DFT calculations using both the pyrrole-substituted (OEP) and meso-substituted (TTP) porphyrins, and an N-substituted imidazole (1-MeIm) and the histidine mimic (5-MeIm). Our experimental observations of a mild effect of OEP vs. TTP macrocycle and axial ligand (5-MeIm vs. 1-MeIm) type on 1H NMR chemical shifts (range of 0.54 ppm; ~4%), but essentially negligible (<1%) υNO shifts for these systems, are reproduced by the calculations (Table S1); with a range of proton shifts of 0.69 ppm (~5%) and a range of υNO shifts of <1%, affirming that 1H NMR spectroscopy is a more sensitive structural probe for these Fe–HNO systems.
In contrast, the reaction of borohydride with the five-coordinate [(OEP)Fe(NO)]OTf (Fig. 4)‡ at −50 °C does not result in new 15N isotope sensitive peaks in the 11–15 ppm region of the 1H NMR spectrum attributable to an Fe–HNO derivative. Rather, a new sharp peak at −4.11 ppm is observed that we attribute to the six-coordinate Fe-hydride product (OEP)Fe(NO)H (Fig. 5a). Importantly, the DFT-calculated 1H NMR chemical shift of the hydride peak for (OEP)Fe(NO)H is at −3.64 ppm, which is in good agreement with the experimentally observed value of −4.11 ppm.
Fig. 4.
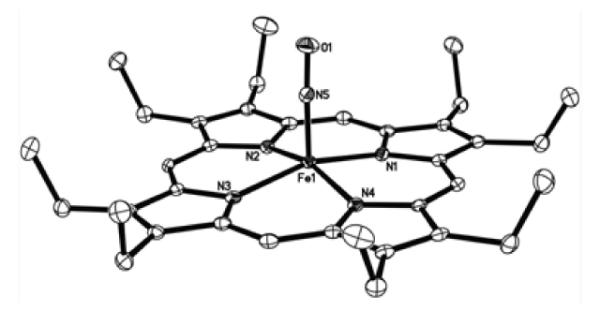
Molecular structure of the cation of [(OEP)Fe(NO)]OTf in the space group (with thermal ellipsoids drawn at 50%). The H atoms and the anion have been omitted for clarity. Fe1–N5 = 1.6371(15) Å, N5–O1 = 1.1473(19) Å, ∠Fe1–N5–O1 = 176.15(15)°. The related [(OEP)Fe(NO)]ClO4 structure in the P21/n space group has been reported.22, 23
Fig. 5.
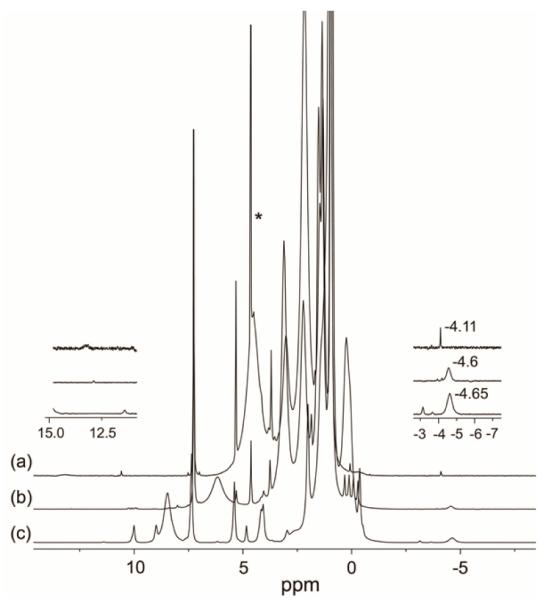
1H NMR spectra (in CDCl3) of the reaction to generate (OEP)Fe(NO)H, highlighting the upfield and downfield regions of (a) (OEP)Fe(NO)H (top spectrum), (b) (OEP)Fe(H) byproduct (middle spectrum), and (c) (OEP)Fe(H) from the control reaction of [(OEP)Fe]OTf with hydride (bottom spectrum). The peak labeled * is due to the H2 decomposition product (see text).
Interestingly, geometry optimization of the model (porphine)Fe(NO)H product reveals a core geometry not unlike that of the structurally characterized aryl derivative (OEP)Fe(NO)(C6H4F-p),24 showing an off-axis tilt of the nitrosyl N atom, a bent FeNO moiety (∠FeNO = 155.2°), and an asymmetry of the equatorial Fe–N(por) core displaying longer Fe–N(por) distances in the direction of the bent FeNO moiety (Fig. 6).
Fig. 6.
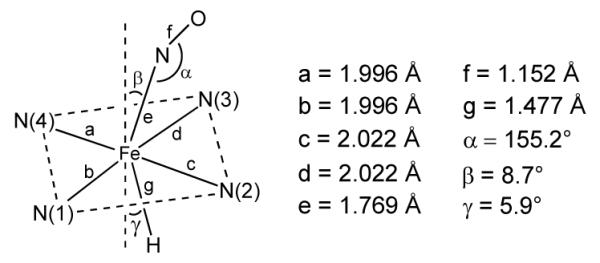
Selected geometrical parameters (in Å and degrees) for DFT-calculated (OEP)Fe(NO)H. The tilting angles are with respect to the four-nitrogen porphyrin plane.
We observe, on occasion, an additional broad peak at −4.6 ppm in the 1H NMR spectrum (Fig. 5b). We attribute this latter peak to the non-nitrosyl paramagnetic (OEP)Fe(H) compound, probably resulting from dissociation of NO from the ferric [(OEP)Fe(NO)]+ cation in solution prior to hydride attack. Indeed, a control experiment involving the reaction of [(OEP)Fe]+ with borohydride reproduces this peak (Fig. 5c).
The (OEP)Fe(NO)H product is very unstable even at −35 °C, with the Fe-H peak at −4.11 ppm in the 1H NMR spectrum disappearing even after only ~15 mins. In fact, this peak is not detectable in the 1H NMR spectrum when the reaction is carried out at −20 °C. The (OEP)Fe(NO)H decomposition products are (OEP)Fe(NO) (87% total yield by IR) and H2 (85% total yield by NMR). That diborane is the boron-containing by-product in both the reactions of the six-coordinate [(OEP)Fe(NO)(5-MeIm)]+ and five-coordinate [(OEP)Fe(NO)]+ with borohydride was verified by 11B{1H} NMR spectroscopy (Fig. 7), which showed identical 11B NMR signals at −26 ppm when compared with that of authentic diborane (prepared from the reaction of borohydride with a reactive alkyl halide).25
Fig. 7.
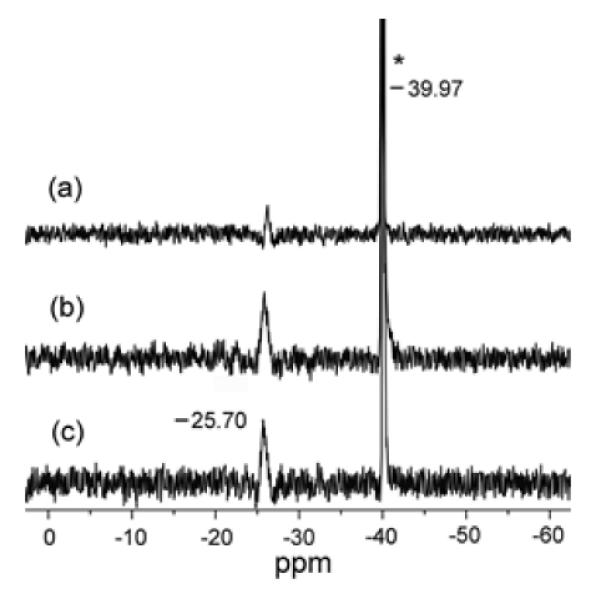
11B{1H} NMR spectra of the product mixtures from (a) the reaction of [(OEP)Fe(NO)(5-MeIm)]OTf with excess [NBu4]BH4 (signal at −40 ppm), and (b) the reaction of [(OEP)Fe(NO)]OTf with excess [NBu4]BH4, and (c) the control and known reaction of [NBu4]BH4 with 1,2-dichloroethane to generate diborane.25
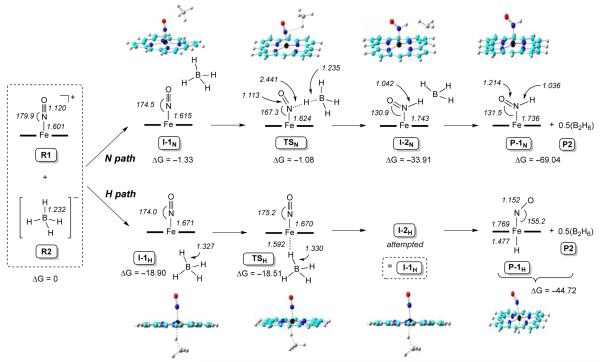
We employed DFT calculations to provide insight into the differential Fe–H versus Fe–HNO bond-forming reactions (Scheme 1) when the five-coordinate [(porphine)Fe(NO)]+ cation (R1) is reacted with borohydride (R2). We previously reported the calculated reaction path for the analogous six-coordinate compound [(porphine)Fe(NO)(5-MeIm)]+.21 The "N path" in Scheme 1 represents an attack of hydride at the coordinated NO, and the "H path" represents direct Fe–H bond formation. The calculated electronic energies (ΔE), zero-point energy corrected electronic energies (ΔEZPE), enthalpies (ΔH), and Gibbs free energy (ΔG) follow the same trends for the N- and the H-paths (Table S2).
Scheme 1.
DFT-calculated N- and H-pathways for hydride addition to the five-coordinate [(P)Fe(NO)]+ cation.
The first encounter intermediate in the N-path is represented by I-1N in Scheme 1, with a distance of 2.984 Å (Table S3) between the nitrosyl N atom and the hydride to be transferred. This distance shortens to 2.441 Å in the transition state TSN, with an accompanying very slight lengthening of the bond between boron and the hydride to be transferred. In fact, the similarity of the B–H bond lengths in TSN and the reagent R2, and the large difference (of 1.405 Å) in the N–H bond lengths between that in TSN and the final Fe–HNO product P-1N suggests an early transition state along the N-path, as observed also for the six-coordinate systems.21
The H-path first generates the intermediate I-1H with a distance of 1.594 Å (Table S3) between the Fe and the hydride to be transferred; this distance is much shorter than that seen in I-1N, suggesting a stronger Fe…HBH3 interaction in I-1H (H-path) than the N…HBH3 interaction in I-1N (N-path). This trend is also maintained in both transition states TSN and TSH. While the data for the N-path suggests an early transition state, that for the H-path suggests a much later transition state. For example, for the H-path, the difference in the Fe–H distances between TSH and P-1H is only 0.115 Å (c.f., the analogous difference in N–H distances of 1.405 Å along the N-path). Further, the difference in the B–H (H to be transferred) bond distances in TSH and in the initial reactant R2 is 0.098 Å, ~33x the noted difference along the related N-path. Attempts to locate a distinct second intermediate I-2H, using a shorter Fe…H length and longer FeH…BH3 distance (en route to P-1H), yielded the same I-1H structure, probably due to the strong favorable electronic driving force between the ferric metal center and the hydride as discussed above, and the strong interaction between hydride and BH3 (the B-H bond length difference between I-1H/I-2H and TSH is only 0.003 Å).
Analysis of the data above shows that although both pathways of hydride attack on the five-coordinate [(por)Fe(NO)]+ are thermodynamically favorable, the H-path is kinetically more favorable than the N-path by 17.43 kcal/mol (i.e., ΔE∣TSH–TSN∣), supporting the experimental formation of the Fe–H hydride complex with no observation of the Fe–HNO product. The charge analysis data (Table S4) is also consistent with the experimental and energy results; in the precursor cation [(porphine)Fe(NO)]+ (R1), the Fe atom bears a more positive charge (0.999e) than the nitrosyl N atom (0.101e; i.e. by ~9.9x), consistent with an easier hydride transfer to Fe rather than N. In accordance with such a strong electronic driving force difference, and based on the charge differences in transition states and reactants (Table S4), hydride transfer to Fe results in a donation of 0.652e from borohydride, while the hydride transfer to the nitrosyl N results in a much smaller donation of 0.136e from borohydride.
Both the (por)Fe(HNO)(L) (Table 1) and (OEP)Fe(NO)H systems are thermally unstable even at −35 °C. For example, although the Fe–HNO peaks for the (OEP)Fe(HNO)(L) compounds are persistent in the 1H NMR spectra for ~2 h (integrating to ~5-21% variable yields), the compounds decompose to generate H2 (by 1H NMR) and the five-coordinate (OEP)Fe(NO) derivative (by IR), with overall yields of 85% (L = 5-MeIm), 52% (L = ImH), and 76% (L = 1-MeIm), respectively, based on the cationic [(OEP)Fe(NO)(L)]+ precursors. The analogous overall yields for the PPDME systems to give (PPDME)Fe(NO) are 41%, 65%, and 51%, respectively. We surmise that HNO dissociation from the six-coordinate (por)Fe(HNO)(imidazole) products does not occur, as N2O (the HNO dimerization product) is not detected in the headspace gas by IR spectroscopy. Curiously, when borodeuteride is used for the reaction with the [(OEP)Fe(NO)(5-MeIm)]+ cationic precursor (eq 1), D2 is similarly generated (identified by 2H NMR spectroscopy) together with (OEP)Fe(NO), but we also detected the presence of N2O (by IR) and D2O (by 2H NMR spectroscopy), indicative of both D–NO bond cleavage and partial DNO dissociation from the (OEP)Fe(DNO)(5-MeIm) complex. In contrast, the reaction of borodeuteride with the five-coordinate [(OEP)Fe(NO)]+ cation resulted in the net formation of only D2 and (OEP)Fe(NO).
We then employed DFT calculations to probe the Fe-HNO decomposition pathways. Selected data are shown in Fig. 8. and in Tables 2 and S5. As seen from the enthalpy costs to break the H–NO and Fe–N(H)O bonds, the covalent H–NO bond is stronger than the Fe–N(H)O coordination bond, as expected from the bonding nature, and both bonds become stronger in the presence of the axial 5-MeIm ligand. Although the trans effect elongates the Fe–N(H)O bond length by 0.054 Å (Scheme 1) it also donates charge (0.248 e) to (P)Fe(HNO).
Fig. 8.
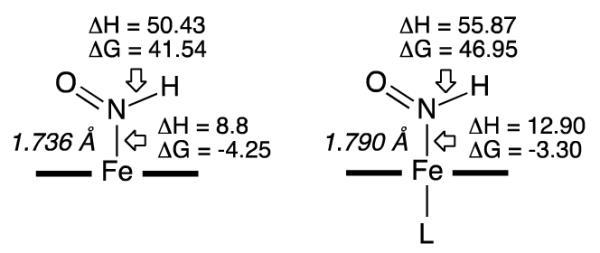
Bond strength energies (ΔH and ΔG) for the five-coordinate and six-coordinate Fe–HNO systems (L = 5-MeIm). Values are in kcal/mol.
Table 2.
Reaction energies (in kcal/mol).a
| C.N. | Decomposition pathway | δG |
|---|---|---|
| 5-C | (P)Fe(HNO) → (P)Fe + 1/2(N2O + H2O) | −48.71 |
| 5-C | (P)Fe(HNO) → (P)Fe(NO)+ 1/2 H2 | −4.78 |
| 6-C | (P)Fe(HNO)L → (P)Fe(L) + 1/2(N2O + H2O) | −47.76 |
| 6-C | (P)Fe(HNO)L → (P)Fe(NO) + L + 1/2 H2 | −3.19 |
| HNO → 1/2(N2O + H2O) | −44.46 |
C.N. = coordination number. P = porphine. L = 5-MeIm.
The reaction pathway associated with Fe–N(H)O bond breaking and subsequent HNO dimerization is much more thermodynamically favorable, by ~44 kcal/mol in Gibbs free energy, than that associated with the H–NO bond breaking and subsequent H2 formation. This is largely due to the strong thermodynamic driving force of HNO dimerization (ΔG of −44.46 kcal/mol; Table 2). In fact, the ΔG of −4.25 kcal/mol for the decomposition of the Fe–N(H)O bond in the five-coordinate (porphine)Fe(HNO) compound is similar to that for the H2 formation pathway overall energy of −4.78 kcal/mol. The corresponding data for Fe–N(H)O decomposition and for the H2 formation pathway are similar for the six-coordinate (porphine)Fe(HNO)L, at −3.30 kcal/mol and −3.19 kcal/mol, respectively. This suggests that the experimentally observed relative preference of H2 formation in the presence of the axial ligand, versus HNO loss and subsequent dimerization, is not due to thermodynamics alone, but could be due to the kinetic effect of the hydrogen radical formation and dimerization.
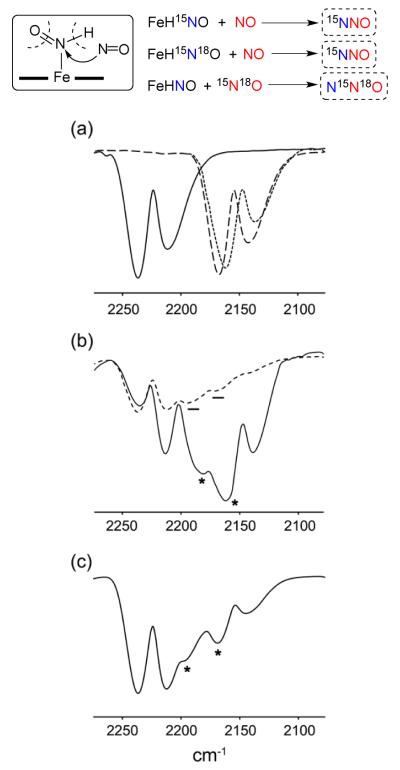
The formation and spectral characterization of the Fe–HNO complexes allowed us to probe their N–N bond-forming reactions with external NO, a key coupling reaction step that is at the center of NO detoxification by fungal NO reductases.19 As described above, the decomposition of the six-coordinate (OEP)Fe(HNO)(5-MeIm) complex generates H2 and (OEP)Fe(NO) with no evidence of N2O formation as judged by headspace IR spectroscopy. Interestingly, however, our preliminary results from the reactions of (OEP)Fe(HNO)(5-MeIm) with external NO show clear N2O formation resulting from an N–N coupling reaction. To verify that N2O was indeed forming from a coupling reaction involving the bound HNO and external NO, we employed various NO isotopomers (i.e., containing 15N and/or 18O) in these reactions. Our results reveal that the terminal N-atom of the mixed-isotope N2O product originates from the Fe-HNO moiety, whereas the central N-atom and the O-atom of the N2O product originate from the external NO reagent (sketched schematically at the top of Fig. 9). The mixed-isotopic N2O products were identified by their characteristic gas-phase IR spectra.26 For example, the reaction of unlabeled (OEP)Fe(HNO)(5-MeIm) with external and doubly-labeled 15N18O generates 14N15N18O (bands at 2185 and 2162 cm−1) as shown in the solid trace in Fig. 9b. The related reaction of (OEP)Fe(H15N18O)(5-MeIm) with unlabeled NO generates 15N14N16O (Fig. 9c, broken line trace; bands at 2195 and 2169 cm−1). Further, the reaction of (OEP)Fe(H15NO)(5-MeIm) with unlabeled NO generates 15N14N16O, namely the same reaction product from the (OEP)Fe(H15N18O)(5-MeIm)/NO reaction.
Fig. 9.
N2O formation from the reactions of in situ generated (OEP)Fe(HNO)(5-MeIm) with external NO. (a) spectra of authentic samples of 14N2O (solid line trace, 2237/2212 cm−1), 15N2O (broken line trace, 2167/2142 cm−1), and 15N218O (dotted line trace, 2160/2138 cm−1), (b) spectra of the headspace from the reactions of (solid line trace) (OEP)Fe(HNO)(5-MeIm) with 15N18O, and (broken line trace) (OEP)Fe(H15N18O)(5-MeIm) with NO; the newly formed mixed-isotope N2O bands are highlighted. The solid line trace shows formation of 14N15N18O (2185/2162 cm−1), while the broken line trace shows formation of 15N14N16O (2195/2169 cm−1), (c) IR spectrum of the headspace from the reaction of (OEP)Fe(H15NO)(5-MeIm) with NO. The newly formed bands for the mixed-isotope 15N14N16O bands at 2195/2169 cm−1 are highlighted. The singly labeled N2O gases are also present in the headspace, and provide good internal reference spectra.
Our finding that the terminal N-atom of the mixed-isotope N2O products originate from the Fe–HNO moiety, whereas the central N- and O-atoms originate from external NO is consistent with that predicted by DFT calculations for the related N–N coupling reaction catalyzed by fungal cyt P450nor.19, 27 The generation of the additional singly labeled (at the N-atom) N2O isotopomers implies that other pathways may supplement the mixed-isotope Fe–HNO/NO coupling reactions observed in this non-protein system.
Conclusion
In summary, we have demonstrated, experimentally and computationally, varied outcomes for hydride attack at ferric–NO moieties (five- vs. six-coordinate) that result in either Fe–HNO or Fe–H formation. We have also demonstrated varied decomposition pathways for these species, one involving H2 formation without Fe–N(H)O bond cleavage (to form Fe–NO and H2) and the other involving Fe–N(H)O bond cleavage (to form N2O). We have also shown that the Fe–HNO species can react with external NO to generate N2O in which the central N and the O atoms of N2O derive from the external NO reagent. These results have set up excellent framework for the study of the Fe–HNO complexes related to their observed biology. Further work to delineate the reaction mechanism of the N–N coupling reactions and related reactions are underway.
Experimental
General
The reactions were performed anaerobically in standard Schlenk glassware and/or in a glove box under a nitrogen atmosphere. Solvents used in the reactions were collected under nitrogen from a Pure Solv 400-5-MD Solvent Purification System (Innovative Technology) or distilled from appropriate drying agents under an atmosphere of nitrogen. Nitric oxide (NO; Air Gas Inc.) gas was passed through a potassium hydroxide column, then through a cold trap (dry ice/acetone) prior to its contact with the precursor solution to avoid the introduction of NOx impurities. 15NO (Icon Isotopes Inc., 99% 15N) was used as received without further purification. FT-IR spectra were recorded on a Bruker Tensor 27 spectrometer. 1H NMR experiments for Fe–HNO and Fe–H detection were performed on a 400 MHz Varian NMR spectrometer at −20°C and −50°C, respectively. 11B{1H} NMR experiments were performed on a 400 MHz Varian NMR spectrometer using quartz NMR tubes.
[(PPDME)Fe(NO)(5-MeIm)]SbF6
A CH2Cl2 (5 mL) solution of [(PPDME)Fe]SbF6 (13.8 mg, 0.016 mmol) with 1 equiv of 4/5-methylimidazole (1.3 mg, 0.016 mmol) was stirred for 2 h, followed by the introduction of NO gas, in a similar manner to that used to prepare other crystalline [(por)Fe(NO)(L)]+ complexes.28 X-ray diffraction-quality crystals of the product [(PPDME)Fe(NO)(5-MeIm)]SbF6 (9.0 mg, 58% isolated yield based on Fe) were obtained from a mixed CH2Cl2/methanol solvent system under an NO atmosphere. IR (KBr): υNO = 1905 cm−1. Characteristic band of uncoordinated hexafluoroantimonate: υSb-F = 659 cm−1.29
(PPDME)Fe(HNO)(5-MeIm)
To a CDCl3 (0.5 mL) solution of [(PPDME)Fe(NO)(5-MeIm)]OTf (8.1 mg, 0.009 mmol; υNO 1912 cm−1 (υ15NO 1874 cm−1)) in a J. Young NMR tube at −20 °C was added a CDCl3 (0.2 mL) solution of [NBu4]BH4 (5.0 mg, 0.017 mmol) in a similar manner to that reported by us earlier.21 The 1H NMR spectra were recorded immediately. 1H NMR (−20° C, 400 MHz): 13.93 ppm (s, Fe–HNO; J15N-H = 77 Hz). The characteristic NO stretching frequency of the (OEP)Fe(HNO)(5-MeIm) complex was obtained from a separate reaction in CHCl3 at −45°C (IR υNO = 1384 cm−1, υ15NO = 1360 cm−1).
The other (por)Fe(HNO)(L) derivatives were generated in a similar manner.
Detection of H2 from the decomposition of (PPDME)Fe(HNO)(5-MeIm)
The headspace gas of the reaction mixture to generate (PPDME)Fe(HNO)(5-MeIm) described above was collected using a gas-tight syringe after warming the mixture to room temperature. The headspace gas was then injected into pre-cooled CDCl3 in an NMR tube and the 1H NMR spectrum was recorded (Fig. S2A). 1H NMR: 7.26 (s, residual CHCl3), 4.62 (s, dissolved H2 gas).30 The data was compared with an authentic commercial sample of 5% H2/N2 (Fig. S2B).
Detection of N2O from the decomposition of (OEP)Fe(DNO)(5-MeIm) and (OEP)Fe(DNO)(1-MeIm)
The headspace gas of the reaction mixture to generate (OEP)Fe(DNO)(5-MeIm) (using [NBu4]BD4 as the deuteride source) was vacuum transferred to an IR gas cell (10 cm pathlength) after warming the mixture to room temperature. IR (gas phase): υas (N2O) = 2237/2213 (15N2O = 2167/2145) cm−1. 2H NMR: Δ = 2.2 ppm assigned to D2O which was confirmed by spiking the sample with authentic D2O. In a separate reaction, formation of the known five coordinate (OEP)Fe(NO) (solution υNO 1665 cm−1) was also observed during the decomposition of (OEP)Fe(DNO)(5-MeIm). Identical results above were obtained for the decomposition of (OEP)Fe(DNO)(1-MeIm).
[(OEP)Fe(NO)]OTf
In a manner similar to that used to prepare [(OEP)Fe(NO)]ClO4,23 NO gas was introduced to a CH2Cl2 (5 mL) solution of [(OEP)Fe]OTf (10.7 mg, 0.015 mmol). X-ray diffraction-quality crystals of the product [(OEP)Fe(NO)]OTf (6.7 mg, 61% isolated yield based on Fe) were obtained from CH2Cl2/n-hexane under an NO atmosphere. IR (KBr): υNO = 1856, 1841 cm−1.
(OEP)Fe(NO)H
To a CDCl3 (0.5 mL) solution of [(OEP)Fe(NO)]OTf 7 (7.9 mg, 0.013 mmol; IR υNO =1856 and 1841 cm−1) in a J. Young NMR tube at −50 °C was added a CDCl3 (0.2 mL) solution of [NBu4]BH4 (6.0 mg, 0.02 mmol). The 1H NMR spectra were recorded immediately. 1H NMR (−50° C, 400 MHz): −4.11 ppm (s, Fe–H).
Thermal decomposition of (OEP)Fe(NO)H
IR and 1H NMR spectroscopy were utilized to monitor the decomposition of (OEP)Fe(NO)H in the product mixture from the reaction of [(OEP)Fe(NO)]OTf with [NBu4]BH4. The IR spectrum was recorded after warming the solution mixture to room temperature for 0.5 h. IR (CHCl3): υNO = 1668 cm−1. 1H NMR (−50° C, 400 MHz): Δ 4.62 ppm assigned to the H2 by-product of the decomposition (see Fig. S2).30
Reaction of (OEP)Fe(HNO)(L) with NO and its isotopomers
(a) 15N18O gas was introduced to a CH2Cl2 (3 mL) solution of the in-situ prepared (OEP)Fe(HNO)(5-MeIm) (−95 °C) in a sealed Schlenk tube. The reaction mixture was stirred for 10 min at this temperature. The solution was then slowly warmed to room temperature and stirred for additional 30 min. The headspace gases formed during the reaction were vacuum transferred to a gas IR cell (10 cm path length). IR (gas phase): in addition to the bands due to singly labeled N-atom of N2O (N2O at 2237/2213 cm−1 and 15N2 18O at 2160/2137 cm−1), new bands were observed at 2185/2162 cm−1 assigned to 14N15N18O (the band at 2162 cm−1 overlaps with a 15N2 18O band).
(b) A separate reaction of (OEP)Fe(H15N18O)(5-MeIm) with NO was also conducted in a similar manner described above. IR (gas phase): in addition to the bands due to singly labeled N-atom of N2O gases, new bands were formed at 2195/2169 cm−1 assigned to 15N14N16O.
(c) In a similar manner, we conducted a reaction of singly labeled (OEP)Fe(H15NO)(5-MeIm) with unlabeled NO. in addition to the bands due to N2O and 15N2O, new bands were formed at 2195/2169 cm−1 assigned to 15N14N16O.
Computational Details
All calculations were performed using the program Gaussian 0931 as reported previously.21 Full geometry optimizations were conducted for all chemical species studied with subsequent frequency calculations to verify the nature of the corresponding stationary states on their potential energy surfaces and provide zero-point energy corrected electronic energies, enthalpies, and Gibbs free energies. Based on a recent methodology study,21 geometries were optimized using the mPW1PW9132 method and the NMR properties were calculated using the B3LYP33 method with solvent (CHCl3) effect included using the PCM formalism,34-37 similar to the approach used previously to study 1H NMR shifts in various organometallic complexes.38 The basis set used in the geometry optimization is Wachters’ basis39 for iron, 6-311++G(2d,2p) for 1st shell atoms (atoms bonded to iron, HNO, and BH3/B2H6), and 6-31G(d) for other atoms. The basis set used in the NMR calculation is similar with the only difference of using LanL2DZ40 basis for Fe. The calculated NO frequencies of various iron porphyrin systems studied in this work were scaled using the experimental/computational NO frequency (1380/1568) for a related HNO Ru porphyrin system.11 The atomic charges were calculated using the Merz-Singh-Kollman scheme41 as implemented in Gaussian 09.
Supplementary Material
Acknowledgements
We are grateful to the U.S. National Science Foundation (Grants CHE-1213674 and CHE-1566509 to GBR-A) and to the U.S. National Institutes of Health (GM085774 to YZ) for funding for this work. We also thank Jim Cornell for technical assistance with our quartz NMR tubes used for 11B NMR spectroscopy.
Footnotes
Notes
The crystal structures of [(PPDME)Fe(NO)(5-MeIm)]SbF6 and [(OEP)Fe(NO)]OTf have been deposited with the Cambridge Structural Database, with ID numbers of CCDC1484724 and CCDC1484725, respectively. Selected data are included in the Supporting Information.
Electronic Suplementary Information (ESI) available: Experimental, X-ray, and computational details. See DOI: 10.1039/x0xx00000x
References
- 1.Miranda KM. Coord. Chem. Rev. 2005;249:433–455. [Google Scholar]
- 2.Farmer PJ, Sulc F. J. Inorg. Biochem. 2005;99:166–184. doi: 10.1016/j.jinorgbio.2004.11.005. [DOI] [PubMed] [Google Scholar]
- 3.Speelman AL, Lehnert N. Acc. Chem. Res. 2014;47:1106–1116. doi: 10.1021/ar400256u. [DOI] [PubMed] [Google Scholar]
- 4.Doctorovich F, Bikiel DE, Pellegrino J, Suarez SA, Marti MA. Acc. Chem. Res. 2014;47:2907–2916. doi: 10.1021/ar500153c. [DOI] [PubMed] [Google Scholar]
- 5.Miao Z, King SB. Nitric Oxide. 2016;57:1–14. doi: 10.1016/j.niox.2016.04.006. [DOI] [PMC free article] [PubMed] [Google Scholar]
- 6.Hamer M, Suarez SA, Neuman NI, Alvarez L, Munoz M, Marti MA, Doctorovich F. Inorg Chem. 2015;54:9342–9350. doi: 10.1021/acs.inorgchem.5b01347. [DOI] [PubMed] [Google Scholar]
- 7.Bykov D, Neese F. Inorg. Chem. 2015;54:9303–9316. doi: 10.1021/acs.inorgchem.5b01506. [DOI] [PubMed] [Google Scholar]
- 8.Daiber A, Shoun H, Ullrich V. J. Inorg. Biochem. 2005;99:185–193. doi: 10.1016/j.jinorgbio.2004.09.018. [DOI] [PubMed] [Google Scholar]
- 9.Choi I-K, Liu Y, Feng D, Paeng K-J, Ryan MD. Inorg. Chem. 1991;30:1832–1839. [Google Scholar]
- 10.Barley MH, Takeuchi KJ, Meyer TJ. J. Am. Chem. Soc. 1986;108:5876–5885. doi: 10.1021/ja00279a036. [DOI] [PubMed] [Google Scholar]
- 11.Lee J, Richter-Addo GB. J. Inorg. Biochem. 2004;98:1247–1250. doi: 10.1016/j.jinorgbio.2004.04.005. [DOI] [PubMed] [Google Scholar]
- 12.Goodrich LE, Roy S, Alp EE, Zhao JY, Hu MY, Lehnert N. Inorg. Chem. 2013;52:7766–7780. doi: 10.1021/ic400977h. [DOI] [PubMed] [Google Scholar]
- 13.Kumar MR, Pervitsky D, Chen L, Poulos T, Kundu S, Hargrove MS, Rivera EJ, Diaz A, Colon JL, Farmer PJ. Biochemistry. 2009;48:5018–5025. doi: 10.1021/bi900122r. [DOI] [PMC free article] [PubMed] [Google Scholar]
- 14.Doctorovich F, Bikiel D, Pellegrino J, Suarez SA, Larsen A, Marti MA. Coord. Chem. Rev. 2011;255:2764–2784. [Google Scholar]
- 15.Pellegrino J, Bari SE, Bikiel DE, Doctorovich F. J. Am. Chem. Soc. 2010;132:989–995. doi: 10.1021/ja905062w. [DOI] [PubMed] [Google Scholar]
- 16.Hu B, Li JF. Angew. Chem. Int. Ed. 2015;54:10579–10582. doi: 10.1002/anie.201505166. [DOI] [PubMed] [Google Scholar]
- 17.Kundakarla N, Lindeman S, Rahman MH, Ryan MD. Inorg. Chem. 2016 doi: 10.1021/acs.inorgchem.5b02384. [DOI] [PubMed] [Google Scholar]
- 18.Linder DP, Rodgers KR. Inorg. Chem. 2005;44:8259–8264. doi: 10.1021/ic0504745. [DOI] [PubMed] [Google Scholar]
- 19.Riplinger C, Bill E, Daiber A, Ullrich V, Shoun H, Neese F. Chem. Eur. J. 2014;20:1602–1614. doi: 10.1002/chem.201302443. [DOI] [PubMed] [Google Scholar]
- 20.Zhang Y. J. Inorg. Biochem. 2013;118:191–2000. doi: 10.1016/j.jinorgbio.2012.09.023. and references therein. [DOI] [PMC free article] [PubMed] [Google Scholar]
- 21.Abucayon EG, Khade RL, Powell DR, Zhang Y, Richter-Addo GB. J. Am. Chem. Soc. 2016;138:104–107. doi: 10.1021/jacs.5b12008. [DOI] [PMC free article] [PubMed] [Google Scholar]
- 22.Scheidt WR, Lee YJ, Hatano K. J. Am. Chem. Soc. 1984;106:3191–3198. [Google Scholar]
- 23.Ellison MK, Schulz CE, Scheidt WR. Inorg. Chem. 2000;39:5102–5110. doi: 10.1021/ic000789e. [DOI] [PubMed] [Google Scholar]
- 24.Richter-Addo GB, Wheeler RA, Hixon CA, Chen L, Khan MA, Ellison MK, Schulz CE, Scheidt WR. J. Am. Chem. Soc. 2001;123:6314–6326. doi: 10.1021/ja010276m. [DOI] [PubMed] [Google Scholar]
- 25.Brandstrom A, Junggren U, Lamm B. Tetrahedron Lett. 1972:3173–3176. [Google Scholar]
- 26.Dubowski Y, Harush D, Shaviv A. Soil Sci. Soc. Am. J. 2014;78:61–69. [Google Scholar]
- 27.Lehnert N, Praneeth VKK, Paulat F. J. Comput. Chem. 2006;27:1338–1351. doi: 10.1002/jcc.20400. [DOI] [PubMed] [Google Scholar]
- 28.Ellison MK, Scheidt WR. J. Am. Chem. Soc. 1999;121:5210–5219. [Google Scholar]
- 29.Reed CA, Mashiko T, Bentley SP, Kastner ME, Scheidt WR, Spartalian K, Lang G. J. Am. Chem. Soc. 1979;101:2948–2958. [Google Scholar]
- 30.Fulmer GR, Miller AJM, Sherden NH, Gottlieb HE, Nudelman A, Stoltz BM, Bercaw JE, Goldberg KI. Organometallics. 2010;29:2176–2179. [Google Scholar]
- 31.Frisch MJ, et al. Gaussian-09. Gaussian Inc.; Wallingford, CT: 2010. Revision B.01. [Google Scholar]
- 32.Adamo C, Barone V. J. Chem. Phys. 1998;108:664–675. [Google Scholar]
- 33.Becke AD. J. Chem. Phys. 1993;98:5648–5652. [Google Scholar]
- 34.Cossi M, Barone V, Cammi R, Tomasi J. Chem. Phys. Lett. 1996;255:327–335. [Google Scholar]
- 35.Cossi M, Barone V, Mennucci B, Tomasi J. Chem. Phys. Lett. 1998;286:253–260. [Google Scholar]
- 36.Cossi M, Scalmani G, Rega N, Barone V. J. Chem. Phys. 2002;117:43–54. [Google Scholar]
- 37.Mennucci B, Tomasi J. J. Chem. Phys. 1997;106:5151–5158. [Google Scholar]
- 38.Zhang Y, Lewis JC, Bergman RG, Ellman JA, Oldfield E. Organometallics. 2006;25:3515–3519. [Google Scholar]
- 39.Wachters AJ. J. Chem. Phys. 1970;52:1033–1036. [Google Scholar]
- 40.Hay PJ, Wadt WR. J. Chem. Phys. 1985;82:270–283. [Google Scholar]
- 41.Besler BH, Merz KM, Kollman PA. J. Comput. Chem. 1990;11:431–439. [Google Scholar]
Associated Data
This section collects any data citations, data availability statements, or supplementary materials included in this article.


