

Abstract
Depression is well known to share a negative cross-sectional relationship with personality constructs defined by positive emotion (positive affect, extraversion, behavioral activation). These Positive Emotionality (PE) constructs have been proposed to represent stable temperamental risk factors for depression, not merely current mood state. These constructs have also been proposed to increase risk specifically for depression, relative to anxiety. We performed a meta-analysis of longitudinal studies to examine the relationship of PE to depression (59 effect sizes) and anxiety (26 effect sizes). In cross-sectional analyses, PE constructs were negatively associated with depression (r = −.34) and anxiety (r = −.24). PE constructs also prospectively predicted depression (r = −.26) and anxiety (r = −.19). These relationships remained statistically significant, but were markedly attenuated, when baseline levels of depression (β = −.08) and anxiety (β = −.06) were controlled. Moreover, depression and anxiety were equally strong predictors of subsequent changes in PE (β = −.07 and −.09, respectively). These findings are consistent with theoretical accounts of low PE as a temperamental vulnerability for depression, but suggest that the prospective relationship of PE to depression may be weaker and less specific than previously assumed.
Keywords: anxiety, depression, extraversion, longitudinal, positive affect
Major depressive disorder is one of the most common mental disorders in the U.S. (Kessler, Chiu, Demler, Merikangas, & Walters, 2005) and among the most burdensome diseases in the world (World Health Organization, 2002). A core symptom of depression is anhedonia, a lack of interest or pleasure in usual activities (American Psychiatric Association, 2013). Many depressed individuals exhibit a diminished tendency to experience positive emotions, even in the presence of normally appetitive stimuli (Berenbaum & Oltmanns, 1992; Kaviani et al., 2004; D. F. Klein, 1974; McFarland & Klein, 2009; Sloan, Strauss, & Wisner, 2001). This contrasts with the experience of individuals high in Positive Emotionality (PE), who exhibit elevations in positive mood states such as happiness, interest, energy, and confidence (Mineka, Watson, & Clark, 1998; Watson & Naragon-Gainey, 2010, 2014). In fact, PE is generally regarded not only as a marker of psychological health (Gilbert, 2012; Ozer & Benet-Martinez, 2006; Tugade & Fredrickson, 2004; though see Gruber, Johnson, Oveis, & Keltner, 2008) but as an evolutionarily adaptive trait that increases psychological flexibility and strengthens physical, intellectual, and social resources (Fredrickson, 1998).
Several prominent theoretical models suggest that, in addition to reflecting current mood state, PE is a stable and heritable personality trait (Krueger, McGue, & Iacono, 2001) that, at low levels, increases risk for depression and exacerbates the course of the disorder (Clark, 2005; Clark & Watson, 1991, 1999; Davidson, 1998; Depue & Iacono, 1989; Gray, 1994; Watson, Stasik, Ellickson-Larew, & Stanton, 2015). For example, theories concerning the closely related behavioral activation and inhibition systems (Gray, 1994), approach and withdrawal systems (Davidson, 1998), and behavioral facilitation systems (Depue & Iacono, 1989; Fowles, 1994) all posit a causal role for low PE in depression. Broadly, these biobehavioral theories describe an approach system that controls goal-directed behavior, is activated in response to positive stimuli, and generates positive emotional experiences. Depression is thought to result from an underactive approach system (Shankman & Klein, 2003). Similarly, the influential tripartite model (Clark & Watson, 1991), later reformulated into the integrative hierarchical (Mineka et al., 1998) and quadripartite (Watson, 2009) models, identifies low PE as a core component and potential risk factor for depression (Clark, Watson, & Mineka, 1994). Unlike negative emotionality, which is viewed as a factor common to depression and anxiety, PE is thought to relate more specifically to depression. Although PE has also been associated with social phobia and agoraphobia (Bienvenu & Stein, 2003; Kashdan, 2007), it is generally more strongly and consistently correlated with measures of depression than anxiety (Watson, 2009). The PE personality trait in the Five-Factor Model, extraversion, is also theorized to constitute a risk factor for the development of depression (Clark et al., 1994; McCrae & Costa, 1987; Watson, Wiese, Vaidya, & Tellegen, 1999). Importantly, although PE is labeled differently in different theories, PE constructs are conceptually similar and correlations among them are high.1
Spurred in part by these models, numerous studies have investigated the relationship of PE to depression, with research efforts increasing sharply in recent years (Naragon-Gainey, Watson, & Markon, 2009; Proceedings, 2011; Watson, Clark, & Stasik, 2011; Watson, Gamez, & Simms, 2005; Watson et al., 2015). Many, though not all, of these studies have provided evidence for a cross-sectional relationship, paralleling experimental evidence for attenuated reactivity to positive stimuli in depression across self-report, behavioral, physiological, and neural measures (Bylsma, Morris, & Rottenberg, 2008; Dichter, 2010; Dichter, Damiano, & Allen, 2012; Dillon et al., 2014). Building on these findings, two meta-analyses have directly examined the cross-sectional relationship between PE (restricted to extraversion) and depression. One meta-analysis found that while mental disorders as a group were associated with low PE, mood disorders were associated with significantly lower PE than all other disorders (Malouff, Thorsteinsson, & Schutte, 2005). The second meta-analysis found that PE was most strongly associated with dysthymic disorder (a chronic form of depression) and social phobia (Kotov, Gamez, Schmidt, & Watson, 2010). Unexpectedly, PE shared weak associations with major depression and relatively strong associations with other anxiety disorders. This surprising pattern may have resulted from the presence of comorbid disorders in the diagnostic groups that were studied (Naragon-Gainey, Gallagher, & Brown, 2013), although it leaves open the possibility that low PE may be less specific to depression than has previously been suggested.
These cross-sectional studies, though informative, have been unable to test the fundamental assertion that PE increases vulnerability to depression. Demonstrating that low PE precedes and predicts subsequent increases in depression is essential for establishing PE as a risk factor, rather than an epiphenomenon or a consequence, of depression (Kraemer et al., 1997). Characterizing the temporal association between PE and depression is also important for adjudicating among explanations for their relationship. Explanations that have been proposed for the relationship between personality traits and psychopathology include: (a) the predisposition model, which posits that personality influences the development of psychopathology; (b) the pathoplasty model, which posits that personality affects the course of psychopathology; (c) the scar model, which asserts that psychopathology leads to permanent changes in personality; and (d) the complication model, which asserts that psychopathology leads to temporary changes in personality that last until the disorder remits (Clark et al., 1994; Kotov et al., 2010). Discovering that PE prospectively predicts depression would lend support to the predisposition and pathoplasty models, whereas evidence that depression predicts PE would provide support for the scar and complication models. While these pathways are not mutually exclusive, the degree to which PE predicts depression versus the reverse can shed light on the relative applicability of these explanatory models to the PE-depression relationship.
In line with views of PE as a vulnerability factor, some longitudinal studies have found that low PE predicts later heightened levels of depression (e.g., Geerts & Bouhuys, 1998; Kasch, Rottenberg, Arnow, & Gotlib, 2002; Naragon-Gainey et al., 2013). Further support comes from studies showing that initial levels of anhedonia predict increased odds of depression two years later (Wardenaar, Giltay, van Veen, Zitman, & Penninx, 2012) and a more chronic course of the disorder over ten years (Moos & Cronkite, 1999). In adolescents, diminished seeking of positive stimuli has been found to predict later depressive symptoms (Forbes, Shaw, & Dahl, 2007; Rawal, Collishaw, Thapar, & Rice, 2013). Similarly, heightened reactivity to positive stimuli has been found to predict recovery from depression in adults (Rottenberg, Kasch, Gross, & Gotlib, 2002).
Not all studies have found that PE predicts subsequent levels of depression, however (e.g., Brown, 2007; Weiss et al., 2009). These conflicting accounts mirror the findings from family and twin studies, which do not consistently identify PE as a risk factor for depression (D. N. Klein, Kotov, & Bufferd, 2011). Several narrative reviews have evaluated the longitudinal relationship between PE and depression and have come to different conclusions, suggesting that PE probably does predict depression (Clark et al., 1994; Morris, Bylsma, & Rottenberg, 2009; Watson & Naragon-Gainey, 2010), probably does not (Shankman & Klein, 2003), or that results are inconclusive (Enns & Cox, 1997). These conclusions are complicated by the fact that few longitudinal studies have tested whether PE predicts change in depression by controlling for initial depression symptoms. Controlling for initial symptoms is critical to ensure that prospective effects of PE are not due to the cross-sectional relationship between PE and depression and the stability of depression over time (Finkel, 1995).
The present study is the first to examine the longitudinal relationship between PE and depression using meta-analysis, thereby overcoming several important limitations of past reviews (Rosenthal & DiMatteo, 2001). Meta-analysis does not rely on each study’s report of statistical significance to determine the presence of a relationship, pools studies together to overcome the problem of low statistical power that is common in psychopathology research, and quantifies effect sizes to determine the strength of relationships. Importantly, the technique used in the present meta-analysis also allows for the control of initial symptom levels regardless of whether the study itself controlled for this factor (Sowislo & Orth, 2013), thereby providing a more rigorous test of PE as a risk factor for depression.
According to extant theoretical models, PE is a risk factor for depression in particular (Hasler, Drevets, Manji, & Charney, 2004). This suggests that PE should exhibit stronger and more consistent relationships with depression than with other emotional disorders (i.e., anxiety disorders; Mineka et al., 1998; Watson & Naragon-Gainey, 2010; Watson et al., 2015). In fact, low PE is one of very few risk factors that are thought to distinguish depression from anxiety (see Ruscio & Khazanov, 2016, for a review). The specificity of low PE to depression, however, has been examined only in cross-sectional meta-analyses (Kotov et al., 2010; Malouff et al., 2005), whose conflicting results have been described above. Previous narrative reviews of this topic have been similarly inconclusive (Clark et al., 1994; Shankman & Klein, 2003; Watson & Naragon-Gainey, 2010). To address this gap, the present study examined PE as a risk factor for anxiety as well as depression. We focused on general (rather than syndromal) measures of anxiety because we wanted to test the claim that PE is more strongly associated with depression than with anxiety conceptualized in general terms (Watson & Naragon-Gainey, 2010), and because there were not enough studies examining the longitudinal relationships between PE and specific anxiety syndromes (e.g., panic, social anxiety) to include in our analysis.2
Gaining a better understanding of the relation of PE to depression and anxiety may help reduce the steep societal and personal costs of these conditions. If PE is indeed a risk factor for depression, low PE levels could be used to identify vulnerable individuals for prevention efforts before the onset of depression (Kotov et al., 2010). Targeting prevention interventions toward individuals at high risk for depression is crucial to limit the cost and increase the feasibility of these interventions (Smit, Beekman, Cuijpers, de Graaf, & Vollebergh, 2004). Furthermore, PE measures could be included in initial clinical assessments to recommend treatment strategies that target this particular vulnerability (e.g., behavioral activation; Hopko, Lejuez, Ruggiero, & Eifert, 2003) or to provide therapists with information helpful for other aspects of treatment planning, such as promoting a strong therapeutic alliance and compliance with homework assignments (Zinbarg, Uliaszek, & Adler, 2008). Patient outcomes could improve if treatment choices were made based on characteristics that predict treatment response (DeRubeis et al., 2014), and personality traits have been found to predict response to particular types of treatments (Simon & Perlis, 2010). Evidence that PE is a specific risk factor for depression relative to anxiety would allow for more precise predictions regarding the onset and course of particular symptoms, further enhancing prevention and treatment efforts.
By contrast, evidence that PE increases risk similarly for depression and anxiety would prompt reevaluation of its scope as a vulnerability factor and reformulation of its role in emotional disturbance. For example, a lack of specificity could suggest that PE, like negative emotionality (Lahey, 2009; Mineka et al., 1998), contributes to the close relationship and frequent co-occurrence of depression with anxiety. Similarly, evidence that PE follows, as well as precedes, depression would challenge the unidirectional causal pathway that is widely assumed in the literature (e.g., Brown & Barlow, 2009; Clark, 2005). Bidirectional effects would have implications not only for etiological models of depression, but for the broader debate over the nature of the relationship between personality and psychopathology (Akiskal, Hirschfeld, & Yerevanian, 1983; Clark et al., 1994; Krueger & Tackett, 2003). These findings would call into question the conceptualization of personality traits as primarily contributing to, rather than influenced by, the development of clinical disorders (Clark, 2005).
The Present Study
The present meta-analysis sought to establish whether PE is a specific risk factor for depression. To answer this question, four goals were pursued. The first goal was to examine three effect sizes quantifying the relationship between PE and depression: the cross-sectional relationship; the longitudinal relationship between PE and depression; and the longitudinal relationship between PE and depression, controlling for initial symptoms of depression. The longitudinal, controlled relationship was considered the most rigorous test of PE as a risk factor for depression. However, examining all three relationships allowed us to compare the meta-analytic results with patterns observed in previous research, much of which has focused on cross-sectional and uncontrolled relationships.
The second goal was to investigate whether depression predicts PE. To do this, we examined the longitudinal relationship between depression and PE, with and without controls for initial levels of PE. Together with the earlier tests of PE predicting depression, these analyses allowed us to compare the extent of support for the scar/complication models versus the predisposition/pathoplasty models.
The third goal was to evaluate the specificity of PE as a predictor and outcome of depression. This goal was pursued by recalculating the effect sizes described above for the relationship between PE and anxiety. We compared the effect sizes to determine whether the influence of PE is limited to depression or extends to other forms of emotional disturbance.
As the relationships of PE with depression and anxiety have been studied over widely varying time intervals, we recalculated the longitudinal, controlled relationships for relatively short (up to one year) and long (more than one year) inter-assessment intervals. These analyses allowed us to examine the magnitude and stability of the primary effect sizes across more homogenous time lags. They also allowed us to check that effect sizes were not disproportionally affected by studies with very long time lags.
The fourth goal was to examine moderators that may explain variability in the relationship between PE and depression. Given our primary interest in the longitudinal relationship between PE and depression, controlling for initial depression levels, we examined moderators of this relationship. Previous research prompted us to include several categories of potential moderators: the operationalization of PE, characteristics of the sample, and features of the study measures.
Operationalization of PE
While the constructs of positive affect, extraversion, and behavioral activation are generally grouped under the umbrella of PE, these constructs might differ in the magnitude of their association with depression. Specifically, positive affect may relate more strongly to depression than the broader construct of extraversion, which includes elements of sociability, ascendance, and fun seeking in addition to positive affect (Naragon-Gainey & Watson, 2014; Naragon-Gainey et al., 2009; Watson et al., 2015). Behavioral activation has also been suggested to relate more strongly to depression than extraversion (Shankman & Klein, 2003). To explore potential differences in the magnitude of these relationships, the type of PE construct was examined as a moderator.
Additionally, the time span covered by the PE measure might influence the strength of its relationship to depression (Watson & Clark, 1994). PE measures can be administered with state instructions (i.e., asking respondents to rate PE over a particular span of time) or trait instructions (i.e., asking respondents to rate their general levels of PE). Whereas state measures may relate more strongly to current ratings of psychopathology (Watson & Clark, 1994), trait measures may predict future depression more strongly (Brown, 2007). We therefore examined state versus trait instructions of PE measures as a moderator.
Demographic and other characteristics of the sample
Some, but not all, studies have suggested that the relationship between PE and depression may differ by age. Specifically, PE may be less consistently related to depression in children and adolescents than in adults (for a review, see De Bolle & De Fruyt, 2010). To examine this possibility more closely, we evaluated sample age as a moderator. Although few studies have investigated sex differences in the relationship between PE and depression, indications that this relationship may be stronger for males than females (Rorsman, Grasbeck, Hagnell, Isberg, & Otterbeck, 1993) prompted us to test sex as a moderator as well.
Given past reviews that have documented stronger relationships between personality characteristics and mental disorders in clinical than nonclinical samples (Kashdan, 2007; Kotov et al., 2010; Ruiz, Pincus, & Schinka, 2008), we examined sample type as a moderator. To understand more fully how sample characteristics influence the relationship of PE to depression, we also examined the following sample characteristics as moderators: whether study eligibility criteria (e.g., including only individuals with major depression) likely yielded a restricted range of symptom levels, whether the sample experienced a defined event between assessments (e.g., loss of a loved one, medical treatment) that would be expected to produce change in symptom levels, and whether the sample consisted of a special population (e.g., individuals with a physical illness) that differed from the general population in important ways.
Study measures
Past studies generally have not found differences in the PE-depression relationship based on the type of reporter (e.g., self-report versus clinician-report; Watson et al., 2015). However, as discrepancies between self- and other-reports are not uncommon in research on psychopathology (Dozier & Lee, 1995), we examined type of reporter as a moderator. Also, as continuous disorder measures are generally more stable and reliable than dichotomous measures (Chmielewski, Clark, Bagby, & Watson, 2015; Watson, 2009), we examined whether the type of depression measure moderated the relationship between PE and depression.
Hypotheses
We hypothesized that PE would be related to depression in cross-sectional and longitudinal analyses and would predict depression even when initial symptoms were controlled. We further hypothesized that PE would predict depression to a greater extent than depression would predict PE, thereby obtaining stronger support for the predisposition and pathoplasty models than for the scar and complication models. In line with extant theoretical models, we hypothesized that PE would serve as a specific risk factor for depression, as evidenced by a stronger prospective, controlled relationship between PE and depression than between PE and anxiety. We also expected that PE’s prospective, controlled relationships with both depression and anxiety would be stronger over shorter time intervals. Finally, based on previous research, we expected the PE-depression relationship to be moderated by type of PE construct assessed, state versus trait measurement of PE, sample age, and sample type (clinical versus nonclinical).
Method
Literature Search
Relevant studies were identified through a search on PsycINFO and Medline databases through November, 2014 using combinations of the keywords (1) positive affect*, positive emotion*, behavioral activation, BAS, extr*version, and reward dependence, paired with (2) depress*, dysthym*, dysphor*, anx*, phob*, fear, panic, post traumatic stress disorder, post-traumatic stress disorder, posttraumatic stress disorder, PTSD, acute stress disorder, obsessive compulsive disorder, obsessive-compulsive disorder, OCD, GAD, and schizo*, and (3) longitudinal, risk factor, vulnerability, prospective, retrospective, and antecedent. The asterisk allowed for the inclusion of alternate word endings. For example, anx* resulted in articles containing anxiety, anxious, and so forth. In an effort to reduce publication bias (the “file drawer problem”), no restrictions were placed on publication type. Eight doctoral dissertations and one conference paper met our eligibility criteria and were included in the analyses. Additionally, the reference sections of all eligible papers, including papers without sufficient effect size data for which authors were contacted, were hand-searched for relevant studies. Finally, papers included in the two meta-analyses that examined the relationships between personality traits and clinical disorders (Kotov et al., 2010; Malouff et al., 2005) were screened.
Eligibility criteria
The following eligibility criteria were applied to select studies for the meta-analysis:
Study design
The study design was longitudinal and included measures of PE and depression/anxiety at one time-point and at least one of these measures at the following time-point (to allow for the control of symptoms or PE levels at baseline). Given these restrictions, retrospective studies with only one assessment occasion were excluded. Studies using ecological momentary assessment (EMA) were excluded unless the study also included a long-term followup (e.g., if a study measured PE using EMA at Time 1 and depression at Time 1 and Time 2, this study was eligible for inclusion). Due to difficulties with correlated data points in twin studies (Carlin, Gurrin, Sterne, Morley, & Dwyer, 2005), these types of studies were excluded. Finally, only reports in English were included.
Measures
Eligible PE measures included measures of positive affect, positive emotionality, behavioral activation, and extraversion. Given variability in the content of positive emotionality measures, these measures (n = 5) were categorized as positive affect measures if they focused exclusively on positive affect, and as extraversion measures if they also assessed sociability.
As stated previously, we included measures that used either state or trait instructions. To ensure that measures of PE reflected participants’ report of their natural state over a period of at least a few days, studies with instructions to rate PE “in the present moment” were excluded, as were studies using a measure of PE to assess changes in mood state following an experimental manipulation. EMA studies utilizing momentary assessments of PE that compiled these ratings over a period of at least a few days were included.
Symptom measures were required to include an assessment of symptoms of depression or anxiety. Measures of depressed affect that did not include assessment of other symptoms of depression were excluded. Anxiety measures focusing on fear (e.g., Beck Anxiety Inventory; Beck & Steer, 1993) and anxiety (e.g., State-Trait Anxiety Inventory; Spielberger, 1989) were included. As noted, only measures assessing general levels of anxiety were included. Measures assessing specific anxiety disorders (e.g., social anxiety disorder) or anxiety in particular situations (e.g., test anxiety) were excluded. Measures were also required to assess depression and anxiety as separate constructs. Measures assessing “internalizing symptoms” or “emotional disorders” were excluded. Both continuous and dichotomous symptom measures were included.
Self-report measures and measures rated by others (i.e., expert clinical interviewers, trained lay interviewers, parents) were included. Behavioral measures were excluded. Single measures assessing multiple constructs of interest (e.g., positive affect and depression measured on the same scale, as in the Center for Epidemiologic Studies Depression Scale; Radloff, 1977) were included if there was no content overlap.
Population and life events
All types of populations were included, except those for whom there were concerns about measurement validity due to potential cognitive impairment. Therefore, studies focusing on patients with dementia, stroke, multiple sclerosis, or traumatic brain injury were excluded. Participants who were bereaved, serving as caregivers, or currently or previously physically ill were included and identified as special populations. Given differences between participants with unipolar and bipolar depression on measures of PE in previous research (Watson & Naragon-Gainey, 2014; Watson et al., 2015) and our focus on unipolar depression, samples including participants with bipolar disorder were excluded.
Samples experiencing a defined life event between assessments (e.g., loss of a loved one, military deployment, birth of a child) were included. Treatment studies of medical treatments were included. Treatment studies of psychological or psychiatric treatments were excluded. If a study was not a psychological treatment study, but a portion of participants likely received treatment (i.e., studies recruiting from outpatient clinics), the study was included. Follow-up studies in which the first assessment took place after receipt of treatment were included. These criteria allowed us to be as inclusive as possible, while restricting the analyses to studies that tracked the progression of depression/anxiety without direct attempts to change symptom levels.
Independence of effect sizes
To ensure independence of effect sizes, when multiple papers presented data from the same study, one paper was selected for inclusion based on the following criteria (in order of importance): 1) if one paper presented data on both depression and anxiety and another presented data on only one of these constructs, the paper with more information was selected; 2) the paper with the most complete data to calculate effect sizes was selected; 3) the paper that most directly addressed the present research question was selected; and 4) the most recently published paper was selected.
Contact criteria
Authors of studies providing the majority of data needed to calculate effect sizes (i.e., only one correlation was missing) were contacted. Additionally, authors of studies including PE and depression/anxiety as central constructs, but not including the data necessary to calculate effect sizes, were contacted. Authors of studies that did not provide the majority of data needed to calculate effect sizes and that did not include PE and depression/anxiety as central constructs were not contacted.
When authors were contacted, all relevant measures included in the paper were requested. As the majority of eligible studies used continuous symptom measures, and as continuous effect sizes were used in the present analysis, continuous symptom measures were requested (e.g., a self-report measure or a measure of the number of symptoms endorsed in a clinical interview). As the majority of eligible studies used self-report measures, self-report measures were requested. These requests were intended to minimize the heterogeneity between studies. When the paper presented data from up to three time points, data from all time points were requested. When the paper presented data from four or more time points (k = 10), three time points were requested: the baseline assessment, the time point closest to one year after baseline, and the time point closest to five years after baseline. This strategy allowed us to conduct additional analyses examining effect sizes for studies with more homogeneous time points.
All authors were requested to send effect size data for the same sample of participants for all time points. This ensured that all effect size calculations were based on the same sample of participants. When eligible studies providing all data necessary for calculating effect sizes included data on different samples (i.e., baseline correlations included more participants than prospective correlations), authors were contacted and requested to send data for equivalent samples. Of 23 eligible studies, seven included data on different samples. The authors of these seven studies were contacted and revised data were sent for two papers. Of the remaining five papers, three provided data for samples that differed in size by less than 20% and the papers specified that no differences were found between these samples on measures of interest (PE and depression/anxiety measures). We conducted sensitivity analyses with the remaining two studies (Marques et al., 2011; Poon & Knight, 2013). As effect sizes were essentially unchanged whether these studies were included or excluded, analyses are reported with these studies included. For all studies, the percent of attrition from the first assessment to the assessment used for analyses was included as a moderator.
Selection of Studies
Our literature search led to the identification of 1,564 papers (see Figure 1 for schematic). Titles and abstracts were reviewed by the first author and a trained research assistant, and the full texts of all papers marked as potentially relevant by either reviewer (k = 869) were examined.
Figure 1.
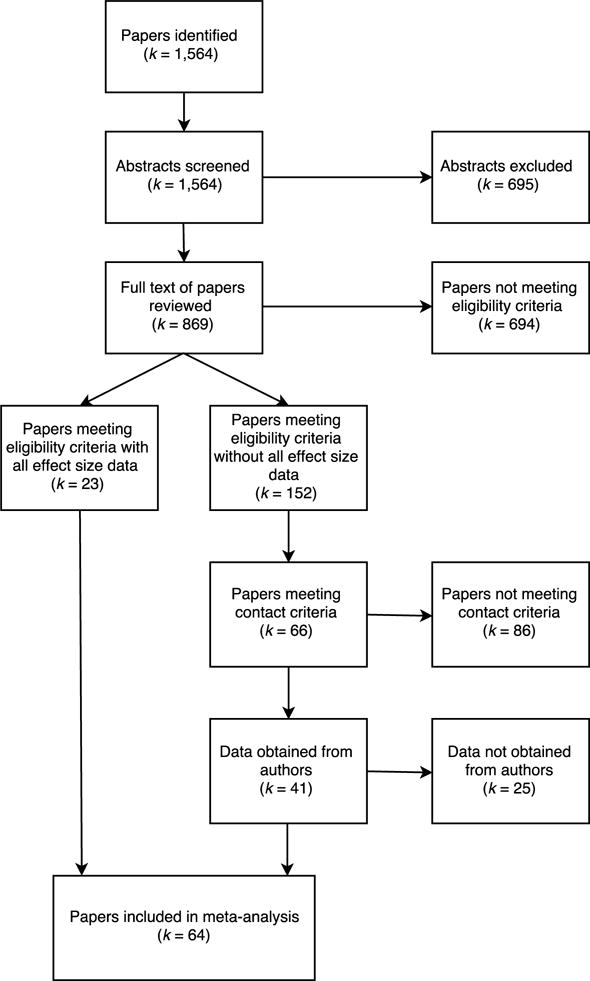
Flow diagram for inclusion and exclusion in meta-analysis.
Of these papers, 23 met the eligibility criteria listed above and included all the information necessary to calculate effect sizes. Another 152 papers met the eligibility criteria, but did not include enough information to calculate effect sizes. Of these 152 papers, the authors of 66 papers were contacted based on the contact criteria listed above. Corresponding authors were contacted three times using up-to-date contact information found online or obtained from university administrators, coauthors, and former advisors. Data were obtained for 41 papers. Therefore, 64 papers were included in the analyses, with one paper providing effect sizes for two separate samples of participants (Langer, Weisman, Rodebaugh, Binder, & Lenze, 2014). As some articles (k = 20) provided effect sizes for both depression and anxiety, these 65 separate samples provided 59 effect sizes for depression and 26 effect sizes for anxiety.
Coding of Studies
Approach
As noted, we calculated three effect sizes for each set of analyses: (1) the cross-sectional correlation between the two variables (e.g., the correlation of PE at Time 1 with depression at Time 1); (2) the prospective correlation between the predictor variable and the outcome variable (e.g., the correlation of PE at Time 1 with depression at Time 2); and (3) the cross-lagged regression between the predictor variable and the outcome variable, controlling for prior levels of the outcome variable (e.g., the correlation of PE at Time 1 with depression at Time 2, controlling for depression at Time 1). These effect sizes were calculated for four sets of analyses estimating the relationships between (1) PE at Time 1 and depression at Time 2; (2) depression at Time 1 and PE at Time 2; (3) PE at Time 1 and anxiety at Time 2; (4) anxiety at Time 1 and PE at Time 2.
Cross-lagged regressions were calculated for the third (controlled) effect size using zero-order correlations between variables in the following equation (Cohen, Cohen, West, & Aiken, 2003):
βY1.2 is the standardized regression coefficient of X1 predicting Y, adjusting for the effect of X2 (e.g., the effect of PE at Time 1 on depression at Time 2, adjusting for depression at Time 1). The correlation between the predictor variable of interest [X1] and the outcome variable [Y] is rY1 (e.g., the correlation of PE at Time 1 with depression at Time 2). The correlation between the other predictor variable [X2] and the outcome variable [Y] is rY2 (e.g., the correlation of depression at Time 1 with depression at Time 2). The baseline correlation between the two predictors [X1 and X2] is r12 (e.g., the correlation of PE at Time 1 with depression at Time 1).
We used cross-lagged regressions, rather than cross-lagged correlations (e.g., comparing the correlation between PE at Time 1 and depression at Time 2 with the correlation between depression at Time 1 and PE at Time 2), because of criticisms that the latter are confounded by the stability of the outcome variable (Locascio, 1982; Rogosa, 1980; Sowislo & Orth, 2013). For example, a large cross-lagged correlation between PE and depression may merely reflect the high stability of depression from Time 1 to Time 2 if PE and depression are strongly correlated at Time 1. Cross-lagged regressions avoid this confound by controlling for the stability of the outcome variable.
Coding procedures
Studies were coded for effect sizes and moderators using a formal coding manual. The first author coded all studies and an advanced graduate student coded a random subset of 30 studies. Interrater reliability was calculated for effect sizes and continuous moderators using intraclass correlation coefficients and for categorical moderators using Cohen’s kappa. Interrater agreement was high (ICC ≥ .99 and κ ≥ .91 for continuous and categorical variables, respectively) and discrepant ratings were discussed until consensus was reached.
Coding decisions
When multiple symptom measures were available in one study, we coded the continuous measure and the self-report measure (PE measures were always continuous and self-report). These decisions were made to reduce the heterogeneity between studies, as the majority of symptom measures were continuous and self-report. Additionally, continuous measures were privileged because effect sizes were continuous. On the other hand, when only dichotomous measures were available, they were included to avoid systematically biasing the sample by excluding studies in which major depression was measured via clinician diagnoses.
When more than one continuous, self-report depression or anxiety measure was available (k = 5), the effect sizes based on these measures were averaged for analysis. By contrast, we decided against combining multiple PE measures because we were interested in the moderating effect of PE constructs (positive affect vs. extraversion vs. behavioral activation) on the relationship of PE to depression and anxiety. In other words, combining a measure of extraversion with a measure of positive affect would have prevented us from examining differences between these constructs across studies. Instead, for studies in which more than one PE measure was available (k = 4), we chose the measure that had the strongest cross-sectional relationship with depression or anxiety at Time 1. This enabled us to represent the strongest available relationship between PE and symptoms, without basing selection on the primary effect size of interest (i.e., the prospective, controlled relationship). Sensitivity analyses using the weakest available relationship between PE and symptoms resulted in effect sizes that were essentially unchanged.
Coding of time lags
For prospective analyses, the effect size for the shortest time lag in each study was coded. Additionally, we grouped the cross-lagged effect sizes into two categories for separate analyses: (1) time lags up to and including one year and (2) time lags over one year. These categories were not mutually exclusive; studies reporting data for more than one time lag (k = 14), of which one was up to a year and one was over a year, were included in both groups. We chose this method of examining time lags because it allowed us to evaluate the stability of cross-lagged effect sizes across more homogenous intervals and to utilize multiple effect sizes from individual studies where available.
Coding of moderators
For each effect size, the following moderators were coded:
PE constructs
We coded the type of PE construct (positive affect, extraversion, or behavioral activation) and whether the measure used state instructions (i.e., asked participants to rate their PE over a particular span of time) or trait instructions (i.e., asked participants to rate their general levels of PE). All measures with state instructions asked participants to rate PE within the past year or less.
Demographic and other characteristics of the sample
As this meta-analysis utilized longitudinal data with varying time lags, it was not possible to code participants’ exact age. Instead, the sample was coded as child/adolescent or adult, as few studies differentiated between children and adolescents.
As the proportion of male and female participants differed at different time lags and precise demographic information was not available for data requested from authors, we coded studies whose sample consisted primarily (over 70%) of one sex. Only one study in the depression analysis was predominantly male, whereas 15 studies were predominantly female. We therefore examined the use of a predominantly female sample as a moderator.
We coded sample type, including clinical samples (recruited from mental health inpatient or outpatient settings), physical health samples (recruited from physical health inpatient or outpatient settings), students, and community/representative samples. We tested clinical status as a moderator by examining differences (1) between clinical samples and all other samples, and (2) between clinical and physical health samples and all other samples.
To examine whether studies with a restricted range of symptom levels differed from other studies, we coded whether the study (1) included only participants with depression or anxiety, or (2) excluded participants with baseline symptoms of depression.
Samples that experienced a defined life event between assessments (e.g., loss of a loved one, military deployment, birth of a child), received medical treatment, or had a high probability of receiving psychological treatment were coded as such. As these were all samples in which change between assessments was more likely than in other samples, they were examined together as one moderator.
Finally, we coded whether the sample consisted of a special population, including participants who were bereaved, caretakers of others, or selected on the basis of a current or former physical illness.
Study measures
We distinguished studies in which all measures were self-reported from studies in which the depression measure was other-reported (PE measures were always self-reported). We also distinguished studies in which all measures were continuous from studies in which the depression measure was originally dichotomous and presented continuously by request (i.e., symptom count from a clinical interview). No dichotomous depression measures were included in the sample of studies examined for moderators.
Methodological considerations
The following indicators of study quality were coded: study location (study conducted in the U.S. or Western Europe versus anywhere else), sample size, year of publication, total number of study waves (not only those for which effect size data were available), and percent of attrition in the study sample from the first assessment to the assessment used for analyses. To ensure that there were no systematic differences between studies that included all the necessary data to calculate effect sizes in the report versus studies that required author contact, we included this variable as a moderator as well.
Meta-Analytic Procedure
Effect size and moderation analyses were conducted using Comprehensive Meta-Analysis version 3.3.070 (Borenstein, Hedges, Higgins, & Rothstein, 2014). As correlational effect sizes have problematic standard error formulations in their standard form (Alexander, Scozzaro, & Borodkin, 1989), all effect sizes were transformed using Fisher’s Zr-transform (Hedges & Olkin, 1985), defined as:
where r is the reported correlation, loge is the natural logarithm, and ESZr is the Fisher’s Zr-transformed correlation.
As recommended by Hedges and Olkin (1985), each effect size was weighted by the inverse of its within-study variance plus the between-studies variance (tau-squared). The within-study variance (wzr) was calculated using the following formula for Fisher’s Zr-transformed correlation coefficients:
where n is the sample size. This weighting procedure gives greater weight to larger samples than smaller samples (Lipsey & Wilson, 2001). For ease of interpretation, Fisher’s Zr-transformed correlations were transformed back into the standard correlational form for the presentation of results. Following two previous meta-analyses utilizing cross-lagged regression coefficients as effect sizes (Kuykendall, Tay, & Ng, 2015; Sowislo & Orth, 2013), cross-lagged effect sizes were also transformed using Fisher’s Zr-transform and weighted as described above. According to current guidelines (Borenstein, Hedges, Higgins, & Rothstein, 2009), all analyses were conducted using a random effects model, with the “method of moments” utilized to estimate between-study variance.
We compared corresponding effect sizes across depression and anxiety using robust variance estimation (Hedges, Tipton, & Johnson, 2010), implemented in the statistical program R (version 3.1.1) with the “robumeta” package. This technique, utilized in numerous meta-analyses (De Vibe, Bjørndal, Tipton, Hammerstrøm, & Kowalski, 2012; Oswald, Mitchell, Blanton, Jaccard, & Tetlock, 2013; Tanner-Smith, Wilson, & Lipsey, 2013), permits comparison of effect sizes across studies in which multiple, dependent effect sizes are drawn from the same sample. We used this method as some studies (k = 20) provided effect sizes for both depression and anxiety. The method requires a parameter estimate for the correlation between dependent effect sizes. Given typically high correlations between measures of depression and anxiety (Ruscio & Khazanov, 2016), we initially set ρ =.7; however, sensitivity analyses recommended by the developers revealed that results remained the same across all values of ρ (0–1).
Outliers
For each effect size, the sample-adjusted meta-analytic deviance (SAMD) statistic was calculated to test for the presence of statistical outliers (Huffcutt & Arthur, 1995). The SAMD statistic values approximate a normal t distribution. A more conservative cutoff score of 2.58 was used to consider studies for exclusion in order to avoid removing outliers whose effects represented true population variability, as extreme values can result from true population variability or error (Beal, Corey, & Dunlap, 2002). The SAMDs were rank-ordered and the scree plots examined. When an effect size’s SAMD value was greater than 2.58, but the scree plot indicated that it was continuous with the overall distribution, the study was retained. Only effect sizes that were clearly discontinuous with the overall distribution and that had SAMD values over 2.58 were excluded.
Tests for heterogeneity
Heterogeneity among effect sizes was examined using both τ2 (an estimate of between-study variance) and the I2 statistic. The I2 index quantifies the degree of heterogeneity by describing the percentage of the variance attributable to between-study variance. I2 values of 25%, 50%, and 75% indicate low, moderate, and high heterogeneity, respectively (Higgins & Thompson, 2002). As the I2 index is influenced by sample size and can be biased in meta-analyses with small samples (von Hippel, 2015), we included confidence intervals for each effect size as well.
Moderators
Categorical moderators were tested using an analysis of variance (ANOVA) of mixed-effects models. Continuous moderators were tested using unrestricted maximum likelihood meta-regression. Given the large number of moderators tested, significant moderators were included in a single regression to test the predictive power of each, controlling for the effects of the others.
Publication bias
In order to reduce publication bias, we included unpublished dissertations and acquired effect size data from authors. Additionally, we tested for the presence of publication bias in several ways. First, we visually inspected a funnel plot, which plots the standard error for each study (determined by the study’s sample size) against the study’s effect size (Fisher’s Z). In the absence of publication bias, the plot approximates a funnel shape, with large studies that provide a more reliable estimate of effect size clustered around the mean toward the top of the plot, and smaller studies that provide more variables estimates of effect size scattered more widely around the mean toward the bottom of the plot. In the presence of publication bias, the bottom of the plot appears asymmetrical. As the effect sizes in this analysis were expected to be negative, a pattern of more studies below than above the mean effect size would be the most likely indication of publication bias.
We also used Duval and Tweedie’s (2000) trim-and-fill procedure to calculate the likely number of missing studies based on asymmetry in the funnel plot and to compute effect sizes adjusting for these missing studies. Additionally, we calculated the classic fail-safe N to determine the number of missing studies that would bring the p value above .05.
While the funnel plot and its associated tests are well-established methods of evaluating publication bias, these procedures rely on the assumption of homogeneity of effect sizes (Terrin, Schmid, Lau, & Olkin, 2003). As we expected to find heterogeneity among effect sizes, we also tested for publication bias by using publication type as a moderator, examining whether effect sizes reported in published studies differed significantly from effect sizes reported in unpublished studies (i.e., dissertations and the conference paper).
Results
Description of Studies
Studies providing data for PE and depression (k = 59; see Table 1) were published between 1994 and 2014, with a median publication year of 2010. Sample sizes ranged from 20 to 2,773 (M = 415.31, SD = 542.74, Mdn = 223). Time lags between assessments ranged from 1 to 228 months (M = 18.41, SD = 40.46, Mdn = 7). Only 73% of studies reported reliability coefficients (Cronbach’s alpha) for measures within the study sample. Reliability coefficients ranged from .68 to .95 (M = .86, SD = .07) for depression measures and from .60 to .96 (M = .81, SD = .09) for PE measures.
Table 1.
Longitudinal Studies of the Relation Between Positive Emotionality and Depression
| Sample Characteristics
|
Effect Sizes
|
|||||||||||
|---|---|---|---|---|---|---|---|---|---|---|---|---|
| Study | N | Time lag in months |
Age | Sample Type | Positive Emotionality Construct |
Trait or State |
Inter-assessment change |
Cross- sectionala |
PE ➔ Da | PE ➔ D, controlledb |
D ➔PEa | D ➔ PE, controlledb |
| Bardi & Ryff, 2007 | 280 | 8 | Adult | Other | Extraversion | Trait | Yes | −.24 | −.26 | −.15 | ||
| Beran, 2009 | 79 | 6 | Adult | Physical health | Extraversion | Trait | No | −.30 | −.20 | −.01 | ||
| Billstedt et al., 2014 | 274 | 288 | Adult | Other | Extraversion | Trait | No | −.15 | −.12 | −.03 | ||
| Bornstein, 2003 | 255 | 3 | Adult | Other | Extraversion | Trait | No | −.46 | −.37 | −.13 | ||
| Brown, 2007c | 197 | 12 | Adult | Clinical | Positive Affect | Trait | Yes | −.46 | −.35 | −.10 | −.35 | −.03 |
| Buffington, 2012c | 236 | 2 | Adult | Other | Positive Affect | Trait | No | −.41 | −.42 | −.21 | ||
| Chien et al., 2007 | 1,348 | 12 | Adult | Other | Extraversion | Trait | No | −.19 | −.14 | −.03 | ||
| Christie, 2011 | 153 | 4 | Adult | Physical health | Positive Affect | State | No | −.68 | −.33 | −.01 | −.36 | .10 |
| Coleman & Neimeyer, 2010 | 99 | 12 | Adult | Other | Positive Affect | State | No | −.30 | −.35 | −.18 | −.33 | −.15 |
| De Bolle et al., 2011 | 150 | 12 | Child/Ad | Clinical | Positive Affect | Trait | Yes | −.44 | −.25 | .04 | −.23 | −.05 |
| Dill, 2005 | 1,146 | 12 | Child/Ad | Other | Extraversion | State | Yes | −.38 | −.23 | −.09 | −.22 | −.05 |
| Duberstein et al., 2008 | 223 | 60 | Adult | Other | Extraversion | Trait | No | −.09 | −.19 | −.15 | ||
| Fox, 2010 | 131 | 12 | Child/Ad | Other | Positive Affect | Trait | No | −.19 | −.03 | .06 | ||
| García-Peña et al., 2013 | 2,352 | 12 | Adult | Other | Positive Affect | State | No | −.43 | −.34 | −.08 | −.48 | −.44 |
| Gershuny & Sher, 1998 | 466 | 36 | Adult | Other | Extraversion | Trait | No | −.08 | −.08 | −.05 | ||
| Gudiño et al., 2012 | 159 | 6 | Child/Ad | Other | BAS | Trait | No | .16 | .08 | −.01 | ||
| Haase et al., 2012 | 752 | 12 | Adult | Other | Positive Affect | State | Yes | −.37 | −.26 | −.10 | −.30 | −.17 |
| Hart & Charles, 2013 | 59 | 6 | Adult | Physical health | Positive Affect | State | Yes | −.49 | −.34 | −.05 | −.17 | .03 |
| Hou et al., 2010 | 215 | 3 | Adult | Physical health | Positive Affect | State | Yes | −.72 | −.43 | −.25 | −.44 | −.18 |
| Joiner & Lonigan, 2000 | 33 | 2 | Child/Ad | Clinical | Positive Affect | Trait | Yes | −.67 | −.14 | .29 | ||
| Joiner, 1994 | 96 | 1 | Adult | Other | Positive Affect | State | No | −.53 | −.24 | −.00 | −.28 | −.05 |
| Joiner, 1995 | 97 | 1 | Adult | Other | Positive Affect | State | No | −.31 | −.18 | −.04 | −.16 | −.03 |
| Joiner, 1997 | 172 | 1 | Adult | Other | Positive Affect | State | No | −.52 | −.52 | −.18 | −.36 | −.04 |
| Jorm et al., 2000 | 433 | 43 | Adult | Other | Extraversion | Trait | No | −.12 | −.08 | −.02 | ||
| Jylhä et al., 2012 | 142 | 6 | Adult | Clinical | Extraversion | Trait | Yes | −.18 | −.20 | −.16 | −.08 | .05 |
| Karademas & Tsaousis, 2014 | 115 | 3 | Adult | Physical health | Extraversion | Trait | No | −.51 | −.36 | −.08 | ||
| Keyes et al., 2010 | 1,725 | 120 | Adult | Other | Positive Affect | State | No | −.27 | −.19 | −.11 | −.09 | −.02 |
| Klimstra et al., 2010 | 1,060 | 12 | Child/Ad | Other | Extraversion | Trait | No | −.30 | −.22 | −.09 | −.15 | .02 |
| Langer et al., 2014 | 93 | 6 | Adult | Other | Positive Affect | State | No | −.11 | −.12 | −.08 | −.09 | −.02 |
| Langer et al., 2014 | 336 | 6 | Adult | Physical health | Positive Affect | State | No | −.04 | −.07 | −.05 | −.12 | −.10 |
| Lengua, 2003 | 83 | 12 | Child/Ad | Other | Positive Affect | Trait | No | −.07 | −.01 | .02 | −.08 | −.05 |
| Loh et al., 2014 | 107 | 3 | Adult | Other | Positive Affect | Trait | No | −.56 | −.47 | −.07 | −.51 | −.17 |
| Lonigan et al., 2003 | 270 | 7 | Child/Ad | Other | Positive Affect | Trait | No | −.38 | −.35 | −.10 | −.32 | −.09 |
| Marques et al., 2011 | 382 | 6 | Adult | Other | Positive Affect | State | Yes | −.35 | −.22 | −.06 | ||
| Mascaro & Rosen, 2005 | 191 | 2 | Adult | Other | Extraversion | Trait | No | −.42 | −.25 | .04 | −.29 | .04 |
| McIntosh et al., 2013 | 759 | 38 | Adult | Other | Extraversion | Trait | No | −.42 | −.36 | −.09 | ||
| Meeks et al., 2012 | 441 | 6 | Adult | Other | Positive Affect | State | No | −.43 | −.34 | −.10 | −.30 | −.11 |
| Mezulis et al., 2011 | 423 | 24 | Child/Ad | Other | Extraversion | Trait | No | −.07 | .04 | .07 | ||
| Naragon-Gainey et al., 2013c | 810 | 6 | Adult | Clinical | Positive Affect | Trait | Yes | −.49 | −.40 | −.13 | −.44 | −.13 |
| O’Neill et al., 2004 | 101 | 2 | Adult | Other | Positive Affect | State | No | −.29 | −.13 | .01 | ||
| Parrish et al., 2011 | 93 | 2 | Adult | Other | Positive Affect | Trait | No | .03 | −.01 | −.03 | .00 | −.02 |
| Poon & Knight, 2013 | 337 | 36 | Adult | Other | Positive Affect | State | No | −.29 | −.17 | −.03 | −.27 | −.14 |
| Poulin et al., 2009 | 532 | 5 | Adult | Other | Positive Affect | State | No | −.47 | −.35 | −.06 | −.38 | −.09 |
| Prenoveau, 2009 | 189 | 12 | Child/Ad | Other | Extraversion | Trait | No | −.26 | −.14 | −.01 | −.13 | .06 |
| Reddy, 2010 | 99 | 12 | Adult | Other | Extraversion | Trait | Yes | −.31 | −.22 | −.10 | ||
| Robinson-Whelen et al., 2001 | 143 | 48 | Adult | Other | Positive Affect | State | Yes | −.38 | −.49 | −.26 | −.51 | −.33 |
| Robison et al., 2009c | 61 | 6 | Adult | Clinical | Extraversion | Trait | Yes | −.41 | −.12 | .07 | ||
| Smith et al., 2012 | 269 | 18 | Adult | Other | Positive Affect | State | No | −.68 | −.48 | −.07 | −.50 | −.03 |
| Spinhoven et al., 2011 | 1,322 | 12 | Adult | Physical health | Extraversion | Trait | Yes | −.36 | −.33 | −.12 | ||
| Takahashi et al., 2012 | 109 | 1 | Adult | Other | BAS | Trait | No | −.34 | −.27 | −.02 | −.33 | −.06 |
| Vanhalst et al., 2012 | 290 | 12 | Child/Ad | Other | Extraversion | Trait | No | −.12 | −.09 | −.02 | ||
| Verstraeten et al., 2009 | 249 | 12 | Child/Ad | Other | Positive Affect | Trait | No | −.36 | −.32 | −.16 | ||
| Vliegen et al., 2013 | 41 | 42 | Adult | Clinical | Positive Affect | Trait | Yes | −.53 | −.38 | −.21 | −.38 | −.07 |
| Voelz et al., 2001 | 63 | 2 | Adult | Other | Positive Affect | State | No | −.40 | −.18 | −.03 | −.14 | .15 |
| Weinstein et al., 2007 | 466 | 6 | Child/Ad | Other | Positive Affect | State | No | −.29 | −.27 | −.06 | −.30 | −.10 |
| Weiss et al., 2009 | 659 | 12 | Adult | Other | Extraversion | Trait | Yes | −.26 | −.26 | −.11 | ||
| Wetter & Hankin, 2009 | 345 | 5 | Child/Ad | Other | Missing | Trait | No | −.47 | −.35 | −.04 | ||
| Yang et al., 2008 | 2,773 | 12 | Child/Ad | Other | Extraversion | Trait | No | −.23 | −.16 | −.02 | ||
| Zdanowicz et al., 2012d | 20 | 6 | Other | Extraversion | Trait | No | .34 | .07 | −.12 | |||
Note. Child/Ad = child/adolescent; PE = Positive Emotionality; D = depression; N = number of participants; Time lag in months = time between the first and second assessment; Age = age of sample; Sample type = the type of sample (Clinical = sample recruited from inpatient or outpatient mental health clinics; Physical health = sample recruited from inpatient or outpatient physical health clinics); Positive Emotionality Construct = type of Positive Emotionality construct assessed; Trait or State = whether Positive Emotionality was assessed using a trait or a state measure; Inter-assessment change = whether the sample likely experienced change between assessments.
Correlation coefficient.
Standardized regression coefficient.
Study included a non-primary BAS measure that was utilized for the “Positive Emotionality construct” moderation analysis.
Zdanowicz et al., 2012 included both adolescents and adults.
Studies providing data for PE and anxiety (k = 26; see Table 2) were also published between 1994 and 2014, with a median of 2010. Sample sizes ranged from 33 to 2,352 (M = 442.08, SD = 576.62, Mdn = 185.5). Time lags between assessments ranged from 1 to 60 months (M = 14.15, SD = 16.67, Mdn = 6). Reliability coefficients, reported by 81% of studies, ranged from .63 to .96 (M = .87, SD = .09) for anxiety measures and from .68 to .96 (M = .84, SD = .07) for PE measures. Of the 26 studies that assessed anxiety, six used measures that primarily (over 75% of items) assessed fear (e.g., racing heart), and three used measures that primarily assessed anxious distress (e.g., feeling worried or upset). As the remaining 17 studies used measures assessing fear and distress in more equal proportions, we treated anxiety as a unitary construct rather than examining fear and distress separately.
Table 2.
Longitudinal Studies of the Relation Between Positive Emotionality and Anxiety
| Sample Characteristics
|
Effect Sizes
|
|||||||||||
|---|---|---|---|---|---|---|---|---|---|---|---|---|
| Study | N | Time lag in months |
Age | Sample Type | Positive Emotionality Construct |
Trait or State |
Inter-assessment change |
Cross- sectionala |
PE ➔ Aa | PE ➔ A, controlledb |
A ➔PEa | A ➔ PE, controlledb |
| Avey et al., 2011 | 128 | 4 | Adult | Other | Positive Affect | State | No | −.14 | −.09 | −.02 | −.03 | .04 |
| Bardi & Ryff, 2007 | 280 | 8 | Adult | Other | Extraversion | Trait | Yes | −.09 | −.09 | −.05 | ||
| Benyamini & Roziner, 2008 | 525 | 60 | Adult | Other | Positive Affect | Trait | No | −.34 | −.26 | −.09 | −.23 | −.06 |
| de Beurs et al., 2005 | 1,694 | 36 | Adult | Other | Positive Affect | State | No | −.45 | −.31 | −.08 | −.32 | −.14 |
| De Bolle et al., 2011 | 150 | 12 | Child/Ad | Clinical | Positive Affect | Trait | Yes | −.34 | −.18 | .04 | −.20 | −.06 |
| Dill, 2005 | 1,146 | 5 | Child/Ad | Other | Extraversion | State | No | −.08 | −.14 | −.10 | −.12 | −.07 |
| Festen et al., 2013 | 78 | 3 | Child/Ad | Clinical | Extraversion | Trait | No | −.28 | −.29 | −.08 | ||
| Fox, 2010 | 131 | 12 | Child/Ad | Other | Positive Affect | Trait | No | −.25 | −.06 | .02 | ||
| García-Peña et al., 2013 | 2,352 | 12 | Adult | Other | Positive Affect | State | No | −.34 | −.29 | −.10 | −.30 | −.23 |
| Gershuny & Sher, 1998 | 466 | 36 | Adult | Other | Extraversion | Trait | No | −.04 | −.03 | −.01 | ||
| Gudiño et al., 2012 | 159 | 6 | Child/Ad | Other | BAS | Trait | No | .21 | .10 | −.01 | ||
| Hou et al., 2010 | 215 | 3 | Adult | Physical health | Positive Affect | State | Yes | −.54 | −.29 | −.10 | −.33 | −.09 |
| Joiner & Lonigan, 2000 | 33 | 2 | Child/Ad | Clinical | Positive Affect | Trait | Yes | −.39 | .03 | .21 | ||
| Joiner, 1994 | 96 | 1 | Adult | Other | Positive Affect | State | No | −.14 | −.13 | −.06 | −.14 | −.08 |
| Joiner, 1995 | 97 | 1 | Adult | Other | Positive Affect | State | No | .07 | −.04 | −.07 | −.04 | −.07 |
| Jorm et al., 2000 | 433 | 43 | Adult | Other | Extraversion | Trait | No | −.00 | .03 | .04 | ||
| Jylhä et al., 2012 | 142 | 6 | Adult | Clinical | Extraversion | Trait | Yes | −.14 | −.11 | −.04 | −.05 | .05 |
| Karademas & Tsaousis, 2014 | 115 | 3 | Adult | Physical health | Extraversion | Trait | No | −.46 | −.23 | .03 | ||
| Lonigan, et al., 2003 | 270 | 7 | Child/Ad | Other | Positive Affect | Trait | No | −.30 | −.22 | −.01 | −.32 | −.14 |
| McIntosh et al., 2013 | 759 | 38 | Adult | Other | Extraversion | Trait | No | −.22 | −.20 | −.05 | ||
| Poulin et al., 2009 | 532 | 5 | Adult | Other | Positive Affect | State | No | −.33 | −.23 | −.03 | −.25 | −.04 |
| Salsman et al., 2009 | 55 | 3 | Adult | Physical health | Positive Affect | State | No | −.77 | −.74 | −.49 | −.62 | −.12 |
| Spinhoven et al., 2011 | 1,322 | 12 | Adult | Physical health | Extraversion | Trait | Yes | −.14 | −.20 | −.12 | ||
| Van Dijk et al., 2013 | 212 | 6 | Adult | Other | Positive Affect | State | Yes | −.32 | −.21 | −.02 | −.19 | −.09 |
| Vliegen et al., 2013 | 41 | 42 | Adult | Clinical | Positive Affect | Trait | Yes | −.53 | −.45 | −.13 | −.56 | −.32 |
| Voelz et al., 2001 | 63 | 2 | Adult | Other | Positive Affect | State | No | −.08 | −.23 | −.19 | −.01 | .04 |
Note. Child/Ad = child/adolescent; PE = Positive Emotionality; A = anxiety; N = number of participants; Time lag in months = time between the first and second assessment; Age = age of sample; Sample type = the type of sample (Clinical = sample recruited from inpatient or outpatient mental health clinics; Physical health = sample recruited from inpatient or outpatient physical health clinics); Positive Emotionality Construct = type of Positive Emotionality construct assessed; Trait or State = whether Positive Emotionality was assessed using a trait or a state measure; Inter-assessment change = whether the sample likely experienced change between assessments. See Supplementary Table 2 for a machine-readable version of Table 2.
Correlation coefficient.
Standardized regression coefficient.
Preliminary Analyses
Preliminary analyses identified 1–2 outliers in 5 (out of 10) analyses (for details, see Tables 3 and 4). After original analyses were run without these outliers, sensitivity analyses were run with outliers included. All effect sizes with outliers included were within .01 of the original effect size values and remained statistically significant (p < .05).
Table 3.
Effect Sizes for the Relation Between Positive Emotionality (PE) and Depression (D)
| Variable | k | N | Effect size | 95% CI | τ2 | I2 |
|---|---|---|---|---|---|---|
| Cross-sectionala | 59 | 24,503 | −.34 | [−.38, −.30] | 0.03 | 91.03 |
| Prospective, PE ➔ Da | 57c | 23,806 | −.26 | [−.29, −.22] | 0.01 | 82.45 |
| Prospective, controlled PE ➔ Db | 58 | 24,229 | −.08 | [−.09, −.06] | 0.00 | 28.01 |
| Prospective, D ➔ PEa | 32d | 9,185 | −.28 | [−.33, −.24] | 0.01 | 79.69 |
| Prospective, controlled D ➔ PEb | 33e | 10,910 | −.07 | [−.09, −.04] | 0.00 | 45.06 |
Note. Computations utilized a random effects model. k = number of studies; N = total number of participants in the k samples; CI = confidence interval; τ2 = tau-squared estimate of between-study variance; I2 = degree of heterogeneity. All effect sizes are significant at p < .05.
Correlation coefficient.
Standardized regression coefficient.
1 outlier (Mezulis et al., 2011).
2 outliers (García-Peña et al., 2013; Keyes et al., 2010).
1 outlier (García-Peña et al., 2013).
Table 4.
Effect Sizes for the Relation Between Positive Emotionality (PE) and Anxiety (A)
| Variable | k | N | Effect size | 95% CI | τ2 | I2 |
|---|---|---|---|---|---|---|
| Cross-sectionala | 25c | 9,800 | −.24 | [−.31, −.17] | 0.03 | 90.77 |
| Prospective, PE ➔ Aa | 26 | 11,494 | −.19 | [−.23, −.14] | 0.01 | 83.01 |
| Prospective, controlled PE ➔ Ab | 26 | 11,494 | −.06 | [−.09, −.04] | 0.00 | 30.18 |
| Prospective, A ➔ PEa | 16 | 7,718 | −.23 | [−.29, −.17] | 0.01 | 81.22 |
| Prospective, controlled A ➔ PEb | 15d | 5,366 | −.09 | [−.11, −.06] | 0.00 | 5.97 |
Note. Computations utilized a random effects model. k = number of studies; N = total number of participants in the k samples; CI = confidence interval; τ2 = tau-squared estimate of between-study variance; I2 = degree of heterogeneity. All effect sizes are significant at p < .05.
Correlation coefficient.
Standardized regression coefficient.
1 outlier (de Beurs et al., 2005).
1 outlier (García-Peña et al., 2013).
The two main analyses evaluating the cross-lagged effect of PE at Time 1 on depression or anxiety at Time 2 showed no evidence of publication bias. The funnel plots appeared symmetrical (see Figures 2 and 3). Following Duval and Tweedie’s (2000) trim-and-fill procedure, we used a random effects model to look for missing studies to the right of the mean. We found no evidence of missing studies in either of the two main analyses. Next, we calculated the classic fail-safe N. This test indicated that 1,370 studies and 190 studies would be required to reduce to nonsignificance the relationships of PE with depression and anxiety, respectively. Lastly, we evaluated publication type as a moderator of the relationships of PE with depression and anxiety. The effect sizes based on published and unpublished studies did not differ significantly for either depression (Q(1) = .06, p = .812) or anxiety (Q(1) = .10, p = .753).
Figure 2.
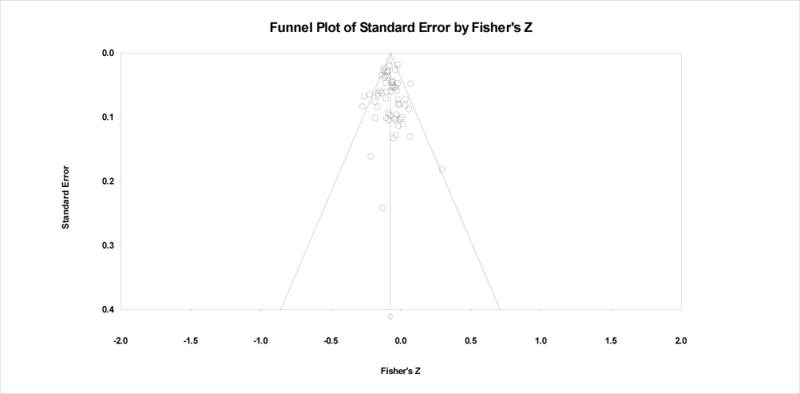
Funnel plot for the relationship between PE and depression, controlling for initial symptoms of depression.
Figure 3.
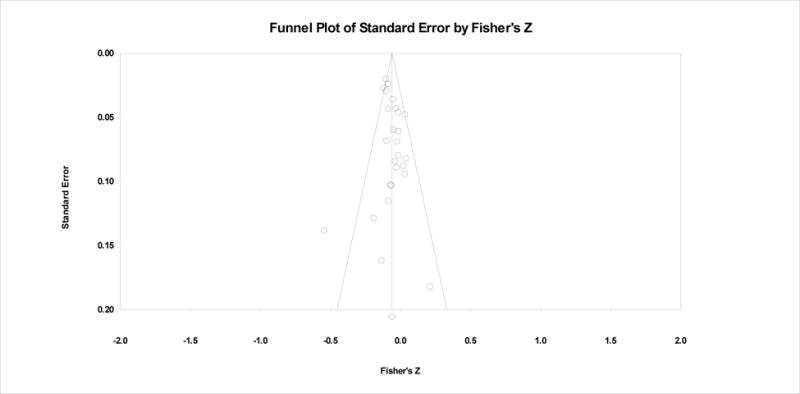
Funnel plot for the relationship between PE and anxiety, controlling for initial symptoms of anxiety.
Effect Size Analyses
PE as a predictor and outcome of depression
Table 3 displays the weighted mean effect sizes for the relationship of PE with depression. Consistent with our hypotheses, PE was related to depression in cross-sectional (r = −.34) and prospective, uncontrolled (r = −.26) analyses. These moderate effects diminished to a far smaller, though still reliable, association (−.08) in cross-lagged analyses that controlled for initial depression symptoms. Contrary to our hypotheses, depression predicted changes in PE to the same extent as PE predicted changes in depression: The uncontrolled (−.28 and −.26, respectively) and controlled (−.07 and −.08) effect sizes were nearly identical in both directions.3
Specificity to depression: Relationship between PE and anxiety
Table 4 displays parallel effect sizes for the relationship of PE with anxiety. In a pattern very similar to depression, PE was related to anxiety in cross-sectional (r = −.24) and prospective, uncontrolled (r = −.19) analyses. Controlling for initial anxiety symptoms diminished the cross-lagged relationship between PE and anxiety to −.06.4 Importantly, none of the three effect sizes (cross-sectional, uncontrolled prospective, or controlled prospective) were significantly larger for depression than for anxiety, all β < −.074, all p > .10, based on robust variance estimation.5 Additionally, the bidirectional paths observed between PE and depression were also evident for anxiety: Anxiety predicted, and was predicted by, PE to a very similar degree in both uncontrolled (−.19 and −.23, respectively) and controlled (−.06 and −.09, respectively) analyses.
Stability of controlled effect sizes across time lags
To examine the stability of the cross-lagged effects across different time lags, we recalculated the effects separately for inter-assessment intervals (a) up to and including one year and (b) more than one year, using the effect size closest to the time lag of interest (one year or five years). The prospective, controlled relationships between PE and depression were remarkably stable, regardless of the time frame that separated the assessments. Across all studies, the relationship (95% CI in brackets) between PE at Time 1 and depression at Time 2 was −.08 ([−.09, −.06], k = 58, Mdn time lag = 6.5 months). For studies with intervals up to one year, the effect size was −.08 ([−.10, −.06], k = 48, Mdn = 12 months) and for studies with intervals over one year, the effect size was −.08 ([−.10, −.05], k = 24, Mdn = 36 months). The relationship was equally stable in the opposite direction: Across all studies, the relationship between depression at Time 1 and PE at Time 2 was −.07 ([−.09, −.04], k = 33, Mdn = 6 months). For studies with intervals up to one year, the effect size was −.06 ([−.09, −.03, k = 27, Mdn = 12 months) and for studies with intervals over one year, the effect size was −.08 ([−.13, −.04], k = 15, Mdn = 36 months).
The prospective, controlled relationships between PE and anxiety were also quite stable over time, although results should be interpreted with caution given the small number of effect sizes available for some analyses. Across all studies, the relationship between PE at Time 1 and anxiety at Time 2 was −.06 ([−.09, −.04], k = 26, Mdn time lag = 6 months). For studies with intervals up to one year, the effect size was −.05 ([−.09, −.02], k = 20, Mdn = 6 months) and for studies with intervals over one year, the effect size was −.08 ([−.10, −.05], k = 11, Mdn = 38 months). Reversing the direction, the relationship between anxiety at Time 1 and PE at Time 2 was −.09 ([−.11, −.06], k = 15, Mdn = 5 months). For studies with intervals up to one year, the effect size was, −.04 ([−.07, −.002], k = 12, Mdn = 5 months) and for studies with intervals over one year, the effect size was −.13 ([−.19, −.08], k = 7, Mdn = 42 months).
Moderator Analyses
Tests of individual moderators
We tested moderators of the main relationship of interest: the cross-lagged relationship between PE at Time 1 and depression at T2. The amount of heterogeneity in this effect size estimate was small (28%), hinting that moderation effects were likely to be modest.
Consistent with this account, only two variables emerged as significant moderators of the cross-lagged relationship between PE and depression (see Table 5). The first was sample age: The link between PE and depression was stronger for adults (β = −.09 [−.11, −.07], p < .001, k = 42) than for children and adolescents (β = −.04 [−.07, −.01], p =.005, k = 15), Q(1) = 8.45, p = .004.6
Table 5.
Moderation Analyses for the Cross-lagged Regression Between PE at Time 1 and Depression at Time 2
| Categorical moderators | Category | β | Category | β | Category | β | Q |
|---|---|---|---|---|---|---|---|
| Operationalization of PE | |||||||
| Type of PE measureb | Extraversion (k = 21) | −.07* | Positive affect (k = 30) | −.08* | Behavioral activation (k = 6) | −.05 | 1.75 |
| Time span of PE measure | State (k = 22) | −.09* | Trait (k = 36) | −.07* | 1.43 | ||
| Demographics and other sample characteristics | |||||||
| Sample ageb | Adults (k = 42) | −.09* | Children/Adolescents (k = 15) | −.04* | 8.45* | ||
| Sample sexb | More than 70% female (k = 15) | −.09* | Less than 70% female (k = 42) | −.07* | 0.33 | ||
| Type of sample I | Clinical (k = 7) | −.09* | Nonclinical (k = 51) | −.07* | 0.20 | ||
| Type of sample II | Clinical and physical health (k = 14) | −.10* | Other samples (k = 44) | −.07* | 1.45 | ||
| Restricted range I | Depressed/anxious-only samples (k = 6) | −.12* | Other samples (k = 52) | −.07* | 3.64 | ||
| Restricted range II | Samples excluding baseline depression (k = 6) | −.13* | Other samples (k = 52) | −.07* | 2.28 | ||
| Likely inter-assessment change | Yes (k = 17) | −.11* | No (k = 41) | −.06* | 8.46* | ||
| Special population | Yes (k = 11) | −.11* | No (k = 47) | −.07* | 3.20 | ||
| Study measures | |||||||
| Depression measure report | Self-report (k = 52) | −.07* | Other-report (k = 6) | −.10* | 0.55 | ||
| Depression measure distribution | Continuous (k = 56) | −.07* | Originally dichotomous (k = 2) | −.12* | 1.86 | ||
| Methodological considerations | |||||||
| Study location | U.S. and western Europe (k = 51) | −.08* | Other locations (k = 7) | −.05* | 1.92 | ||
| Data publication status | Data published (k = 21) | −.08* | Data requested (k = 37) | −.07* | 0.02 | ||
|
| |||||||
| Continuous moderators | β | Q | |||||
|
| |||||||
| Sample size | <.001 | 0.27 | |||||
| Publication year | −.002 | 0.58 | |||||
| Total number of study waves | −.001 | 0.08 | |||||
| Percent attrition | .054 | 1.00 | |||||
Note. Computations utilized a random effects model. β = standardized regression coefficient; Q = test of moderation.
Analysis excluded one study that did not include enough information for coding moderators or did not fall into one of the moderator categories. Additional information can be found in Supplementary Table 1.
p < .01. No p values were < .05.
The second significant moderator was having an experience between assessments that posed a high likelihood of symptom change. Samples comprising individuals who experienced a defined life event, medical treatment, or the possibility of psychological treatment yielded larger effect sizes (β = −.11 [−.14, −.08], p < .001, k = 17) compared to other samples (β = −.06 [−.08, −.04], p < .001, k = 41), Q(1) = 8.46, p = .004. Separate follow-up analyses found each type of inter-assessment change to be associated with a larger effect size compared to all other studies. These differences, however, were only statistically reliable when all types of change were analyzed together. Interestingly, the moderating effect of defined life events was similar whether the event was negative (e.g., military deployment) or positive (e.g., graduating from high school), Q(2) = 4.10, p = .129.
We found no difference in the relationship between PE and depression depending on the operationalization of PE. This was the case even though we increased our power to detect a difference by increasing the number of behavioral activation effect sizes from 2 (in our main depression analyses) to 6, substituting a behavioral activation effect size for the 4 other studies that provided one (starred in Table 1). Similarly, moderation analyses revealed no significant differences by sample characteristics other than age, by study measures, or by any of the indicators of study quality evaluated. Importantly, effect sizes did not differ depending on whether data were published or requested from authors, supporting the decision to analyze them together.
Final model
As sample age and inter-assessment change both emerged as significant moderators, we included them together in a single regression analysis predicting the magnitude of the cross-lagged relationship between PE and depression. Each moderator remained statistically significant when levels of the other moderator were controlled, Q(2) = 18.15, p < .001. The two moderators accounted for roughly equal proportions of the variance in the effect size, with slight changes depending on the order in which they were entered into the regression. Together, they accounted for 83% of the variance in the prospective, controlled relationship between PE and depression, leaving no unexplained heterogeneity, Q(54) = 57.53, p = .346; I2 for the final model = 6.14%. That is, the model with these two predictors accounted for 83% of the unexplained variance (τ2) in the model without these predictors.
Discussion
In a series of meta-analyses, we quantified the cross-sectional, prospective, and cross-lagged relationships between PE and depression and evaluated their specificity vis-à-vis anxiety. PE shared a moderate cross-sectional relationship and a small to moderate prospective relationship with depression. The prospective relationship was markedly attenuated, however, once initial levels of depression were controlled. Furthermore, PE predicted change in depression to the same extent that depression predicted change in PE. Finally, PE predicted change in depression to the same extent that it predicted change in anxiety. These results were consistent across shorter (up to one year) and longer (more than one year) assessment intervals and across differing operationalizations of PE. The PE-depression relationship was stronger for adults than for children and adolescents, and stronger for samples with a high probability of inter-assessment symptom change than for other samples. Despite these differences, in all samples lower levels of PE reliably, but weakly, predicted subsequent increases in depression.
Relationship of PE to Depression
The moderate cross-sectional relationship observed here between PE and depression (r = −.34) was similar to the continuous effect sizes reported in a recent meta-analysis (r = −.25 to −.29, depending on type of depressive disorder; Kotov et al., 2010). Building on these results, we found that the prospective relationship of PE to depression was also robust (r = −.26). Demonstrating the temporal precedence of PE is an important precondition for establishing vulnerability, but it is not sufficient, given the cross-sectional relationship between PE and depression and the persistence of depression over time. In our sample of studies, for example, the correlation between depression at Time 1 and Time 2 was .56 (k = 57, 95% CI [.53, .59], τ2 = 0.02).
We undertook a more rigorous test of the vulnerability hypothesis by controlling for initial levels of depression, even when the original study did not include this control. That PE remained a significant predictor in this conservative analysis provides the most compelling psychometric evidence to date for its status as a risk factor for depression. At the same time, the large reduction in effect size that occurred when baseline symptoms were controlled suggests that the risk conferred by low PE may be much smaller than has previously been suggested. In addition, our finding that the cross-lagged relationship of PE to depression was nearly identical to the cross-lagged relationship of depression to PE suggests that PE is as likely to be a consequence as a cause of depression.
Explanation of Findings
What might account for the departure of our findings from extant theories of PE and depression? There are several possible explanations. First, it is rare in psychopathology for a single risk factor to have large and specific effects (Coie et al., 1993). This does not preclude the possibility that more potent risk factors than PE exist, and future research should be directed in part toward identifying the strongest predictors of depression. Nevertheless, comprehensive models will almost certainly need to consider multiple risk factors and their interactions in order to powerfully predict symptom change (D. N. Klein et al., 2011; Kraemer, Stice, Kazdin, Offord, & Kupfer, 2001).
Second, it is possible that the constructs of PE and depression are overly broad and that stronger cross-lagged relationships exist between specific aspects of these constructs (D. N. Klein et al., 2011; Watson & Naragon-Gainey, 2010). Although we did not find stronger associations of depression with the narrower construct of positive affect than with the broader construct of extraversion, positive affect is itself composed of several facets that may relate differentially to depression. For example, the positive affect facet of Joviality is associated more strongly with depression than are Self-Assurance and Attentiveness (Stanton & Watson, 2014), and the positive emotion of pride is associated more strongly with depression than are happiness and amusement (Gruber, Oveis, Keltner, & Johnson, 2011). Additionally, we focused on global levels of PE and not on PE responses to specific stimuli, which can be divided into emotional responses during anticipation, reaction, and recall of a stimulus (Gilbert, 2012). Preliminary evidence that depression relates more strongly to some phases of positive emotional responding (e.g., anticipation) than others (e.g., reaction; D. Gard, M. Gard, Kring, & John, 2006) highlights the importance of examining each temporal aspect of PE separately. Similarly, heterogeneity in the expressed features, pathophysiology, and etiology of depression (Monroe & Anderson, 2015) limits the power of any individual risk factor to predict change in depression over time. Given this heterogeneity, progress may be accelerated by investigating associations of PE with more homogenous subsets of depression symptoms. This approach is supported by evidence that some depression symptoms (anhedonia, depressed mood, worthlessness, and lassitude) are more strongly related to PE than others (motor, sleep, and appetite disturbance; Watson & Naragon-Gainey, 2010).
Third, it is possible that behavioral measures of PE will be revealed to predict depression more powerfully than the self-report measures investigated here. Behavioral PE measures include tasks evaluating reward learning, effort exertion for rewards, and facial expressions in response to pleasant stimuli (Pizzagalli, Iosifescu, Hallett, Ratner, & Fava, 2008; Rottenberg et al., 2002; Treadway, Buckholtz, Schwartzman, Lambert, & Zald, 2009). While several studies have found that behavioral measures of PE prospectively predict depression (Pizzagalli, 2014; Rottenberg et al., 2002), substantial differences between these measures and uncertainty over their relationship to self-reported PE (Forbes & Dahl, 2005; Pizzagalli, 2014) impede a meaningful quantitative synthesis across studies. In addition, behavioral measures of PE might be expected to yield smaller effect sizes than self-report measures, simply because the latter share method variance with self-reported depression symptoms. That said, behavioral measures deserve more attention in view of advantages they offer over global self-report measures. In particular, they map more directly onto dimensions of reward processing that are disrupted in depression (Der-Avakian & Markou, 2012), such as motivation for, engagement with, and learning from positive stimuli (Proceedings, 2011; Treadway & Zald, 2011). These dimensions are conceptually very similar to PE, and clarifying their relationship to PE would help bridge the burgeoning literature on reward processing with the vast literatures on normal personality and emotion. In doing so, behavioral measures could help illuminate behavioral and neurobiological mechanisms linking PE to psychopathology.
Fourth, prospective relationships between PE and depression may have been weakened by effects of current mood on PE levels. Although we controlled for initial symptoms of depression, we were unable to rule out the possibility that concurrent symptoms of depression biased participants’ reports of PE (Clark, Vittengl, Kraft, & Jarrett, 2003). With the use of repeated assessments, a recent study applied a statistical method for isolating the influence of time-invariant (as opposed to transient, mood-state-dependent) aspects of personality traits on disorder symptoms (Naragon-Gainey et al., 2013). Isolating the time-invariant component of PE enhanced its ability to predict the longitudinal course of depression. Another study using this method found that the time-invariant component of PE also predicted the first onset of depressive disorders (Kendall et al., 2015). These results suggest that state variance may dilute the association of PE with depression, especially in samples with high levels of depression whose responses are influenced by extreme mood states. Our moderation analyses found no evidence of a weaker cross-lagged relationship between PE and depression for clinical relative to nonclinical samples, or for depressed/anxious samples relative to all other samples. However, we could not ascertain whether mood state was more variable and led to more extreme changes in PE depending on mood in clinical than nonclinical participants. It therefore remains possible that the influence of current mood state on reports of PE weakened PE’s ability to predict depression.
The acknowledgment that PE has both trait and state components could help explain the discrepancy between our findings of the nonspecificity of PE and the many cross-sectional studies showing relative specificity of PE to depression vis-à-vis anxiety (Clark et al., 1994; Malouff et al., 2005; Mineka et al., 1998; Watson et al., 2005). As depression, unlike anxiety, includes symptoms reflecting low PE, it is possible that the state component of PE inflates its cross-sectional association with depression relative to anxiety. In longitudinal studies in which PE and symptoms are assessed months or even years apart, the influence of this state component on symptom reports is reduced.
Theoretical Implications
Perhaps the most striking departure from existing theories was not the magnitude of the observed effects, but their remarkable similarity in both temporal directions. Our results showed clearly that PE is as likely to be an outcome of depression (consistent with the scar and complication models) as a vulnerability factor (consistent with the predisposition and pathoplasty models). This suggests that theories conceptualizing PE largely as a risk factor for depression should be broadened to recognize and explain bidirectional influences between the two constructs. The nature and form of these influences, however, remain to be described. As our analysis focused on symptom, rather than diagnostic, measures of depression, we were unable to distinguish between the predisposition model (which asserts that PE increases risk of disorder onset) and the pathoplasty model (which asserts that PE influences the course and expression of the disorder). Past research suggests that both models are plausible (Kendall et al., 2015; D. N. Klein et al., 2011), and as they have different implications for intervention, studies capable of discriminating between them are needed.
For similar reasons, our analysis cannot distinguish the scar model (in which declines in PE persist even after the disorder has resolved) from the complication model (in which declines in PE are temporary and last only while the illness is active). Still, our discovery that depression predicts subsequent reductions in PE over periods longer than a year hints that changes in PE are not entirely temporary. Further investigation of low PE as a sequela of depression would help clarify these and related issues, such as whether declines in PE resulting from previous depressive episodes increase risk for new depressive episodes, and whether the mechanisms involved are the same in each temporal direction.
Our findings also have implications for two other models of the personality-psychopathology relationship. The spectrum model suggests that disorders and traits are different manifestations of the same process; this model would be supported by high, specific correlations between PE and depression (Kotov et al., 2010). As even the cross-sectional correlation between PE and depression was moderate in the present analysis (r = −.34), our results do not support this model. On the other hand, our results are broadly compatible with the common cause model, which posits that disorders and traits are associated because of shared genetic or environmental vulnerabilities. Evidence for this model comes from twin studies showing that PE and depression share a modest genetic correlation (Kendler, Gatz, Gardner, & Pedersen, 2006; Kendler & Myers, 2010). Meta-analyzing longitudinal studies for other personality traits (e.g., negative emotionality), as well as other forms of psychopathology, would shed further light on the important and complex relationship between personality and psychopathology.
Moderators of the Pathway from PE to Depression
A complete theoretical account of PE as a risk factor for depression will need to address the moderating influences identified here. We provided quantitative evidence for prior suggestions that PE is a stronger predictor of depression in adults than in children and adolescents (De Bolle & De Fruyt, 2010). The weaker relationship between PE and depression in youth could have a number of explanations, including differing manifestations of depression in children and adolescents relative to adults (De Bolle & De Fruyt, 2010; Jacques & Mash, 2004), different causal factors for early-onset relative to late-onset depression (Shankman, Klein, Tenke, & Bruder, 2007), or decreased stability of PE in childhood (Roberts & DelVecchio, 2000). While behavioral measures of low PE like reduced pursuit of positive stimuli and lower observer ratings of positive emotional expression have also been shown to predict depressive symptoms in youth (Dougherty, Klein, Durbin, Hayden, & Olino, 2010; Forbes et al., 2007; Rawal et al., 2013), we do not yet know whether these measures are more robust predictors of depression than self-reported PE. If this is found to be the case, it may indicate poorer validity of self-report relative to behavioral measures of PE in children and adolescents.
We also found a stronger relationship between PE and depression in samples with an increased likelihood of inter-assessment change, including samples that experienced a defined life event, received medical treatment, or had a high probability of receiving psychological treatment. This finding is consistent with research showing that the relationship between traits and mental disorders are stronger in the context of adverse life experiences (Clark, 2005; Geschwind et al., 2010). Life experiences, whether adverse or favorable (e.g., treatment), may amplify the relationship between PE and depression by increasing the need for adaptive information processing, coping strategies, and emotion regulation – all processes influenced by PE (Folkman & Moskowitz, 2000). Our moderation results may help explain inconsistencies across studies regarding the status of PE as a risk factor, as many, but not all, studies have relied on samples of individuals recruited in settings in which the possibility of treatment was high (Clark et al., 1994; Enns & Cox, 1997; Shankman & Klein, 2003; Watson & Naragon-Gainey, 2010). Unlike previous meta-analyses (Kashdan, 2007; Kotov et al., 2010), however, we did not find a reliably stronger relationship between PE and depression in clinical than nonclinical samples, perhaps because of insufficient statistical power to detect these differences or our focus on longitudinal, as opposed to cross-sectional, relationships.
Contrary to expectations, neither the type of PE construct (positive affect, extraversion, behavioral activation) nor the time span of PE measurement (trait, state) moderated the relationship between PE and depression. This contradicts several studies in which depression related more strongly to positive affect than to the broader trait of extraversion (Naragon-Gainey et al., 2009; Watson & Naragon-Gainey, 2014; Watson et al., 2015). A possible reason is that those studies distinguished between facets of extraversion, whereas our analysis focused on the far larger number of studies that used complete measures of positive affect and extraversion. The present results also run counter to suggestions that depression relates more strongly to behavioral activation than to extraversion (Shankman & Klein, 2003), although the relatively small number of prospective studies measuring behavioral activation left us with low power to detect these differences. Based on the available evidence, the consistency of effect sizes across constructs and time spans suggests that the relationship of PE to depression is quite stable regardless of how PE is measured. Further evidence of stability was provided by showing that the relationship does not vary by features of study measures or indicators of study quality.
Specificity of PE as a Risk Factor for Depression Relative to Anxiety
We found a cross-sectional relationship of PE to anxiety (r = −.24) that was not reliably different from the cross-sectional relationship of PE to depression (r = −.34). This aligns with the results of a previous meta-analysis (Kotov et al., 2010), which reported correlations of a similar magnitude for PE with depression (r = −.25 to −.29) and several anxiety disorders (r = −.18 to −.37, excluding specific phobia). In the current study, the same pattern held when we examined the prospective and the cross-lagged relationships between these constructs. In each analysis, the effect sizes for depression and anxiety were statistically indistinguishable. Contrary to our hypothesis and prominent theoretical models of emotional disorders, these findings challenge the notion that PE is a specific risk factor for depression relative to anxiety.
These longitudinal results extend prior claims that low PE is a feature of certain anxiety disorders (Bienvenu & Stein, 2003; Watson & Naragon-Gainey, 2010) to suggest that PE be reframed as a general vulnerability factor for emotional disturbance rather than a specific vulnerability factor for depression. These results align with a growing recognition of dimensions of psychopathology (Insel, 2014) and associated maintaining processes (Harvey, 2004) that cut across disorder categories. To date, research on dimensions of temperament that increase vulnerability for both depression and anxiety has focused mainly on negative emotionality (Barlow, Ellard, Sauer-Zavala, Bullis, & Carl, 2014; Lahey, 2009). By contrast, deficits in PE have more commonly been studied in connection with depression and schizophrenia (Proceedings, 2011), although most studies have examined low PE as a feature of these disorders rather than a risk factor for them. Our results indicate that it will be important to extend research on PE to anxiety.
A further priority will be to identify variables that account for the development of each disorder in the presence of low PE. Due to the small number of available anxiety studies as well as our principal interest in the PE-depression relationship, we did not examine moderators of the PE-anxiety relationship here. As more longitudinal studies become available, it will be valuable to explore differences in moderators and mechanisms of the pathways connecting PE to depression, anxiety, and other conditions (schizophrenia, mania) in which PE has been implicated (Gruber et al., 2008; Horan, Blanchard, Clark, & Green, 2008; Watson & Naragon-Gainey, 2010).
Clinical Implications
The present findings have implications for the prevention and treatment of depression and anxiety. We found that PE levels were quite stable over time (the correlation between PE at Time 1 and Time 2 was .61, k = 32, 95% CI [.57, .65], τ2 = 0.03) despite studies with long times lags, samples experiencing defined life events, and effects based on state as well as trait measures included in the analysis. This stability, together with evidence that PE precedes and predicts increases in depression and anxiety, suggests that PE could be used to identify individuals at risk for depression. Despite PE’s stability, studies have found that standard pharmacological and psychological treatments for depression can raise levels of PE (Du, Bakish, Ravindran, & Hrdina, 2002; Tang et al., 2009). These findings speak to the possibility of intervening to increase PE with the goal of preventing the onset or recurrence of depression and anxiety. In fact, recognition that conventional treatments, which focus mainly on reducing negative emotions, may not remedy deficits in positive emotions has spurred the development of interventions that target PE. These interventions seek to enhance and prolong PE by encouraging patients to savor and actively anticipate positive experiences and by removing barriers to PE expression. Preliminary evidence suggests that these types of interventions increase PE and decrease symptoms among currently depressed and anxious individuals (Carl, 2015; McMakin, Siegle, & Shirk, 2011). Although clinical trials are needed, these results highlight the potential of PE-focused interventions to alleviate and perhaps also prevent symptoms of depression and anxiety.
At the same time, the modest magnitude of the longitudinal, controlled relationship observed in this synthesis suggests that risk factors other than PE play a significant role. Previous research has identified numerous individual (e.g., negative emotionality, self-esteem) and environmental (e.g., early life experiences, social support) risk factors for depression. Theoretical models and prevention programs will benefit from further investigation of how these risk factors operate with or through PE to increase vulnerability for emotional disorders (e.g., Gershuny & Sher, 1998; Joiner & Lonigan, 2000). This will allow prevention programs to be offered to individuals whose vulnerability is especially high, and will identify the set of modifiable risk factors that are most important for such programs to address.
Limitations
The present results are qualified by several important limitations. First, we cannot reach strong conclusions regarding causality because all studies used correlational designs. In the absence of experimental manipulation, it is possible that a third variable was responsible for these effects, especially in light of the modest reciprocal effects observed here. One particularly important third variable is negative emotionality. PE, depression, and anxiety all correlate with negative emotionality, and the extent to which negative emotionality accounts for relationships among these constructs is unclear (Kendall et al., 2015; Naragon-Gainey et al., 2013; Watson & Naragon-Gainey, 2014). Additional prospective studies assessing negative emotionality in conjunction with PE, depression, and anxiety would permit a more systematic evaluation of these relationships. Extending this work to consider other variables associated with both PE and depression, such as stress, substance use, and conscientiousness, would further clarify the contribution of third variables to these relationships. Although correlational findings cannot speak decisively to causality, our analysis of longitudinal studies enabled us to go a step beyond meta-analyses of cross-sectional data in evaluating PE as a risk factor and consequence of depression. Future research can more directly test low PE as a cause of symptoms through increased use of randomized controlled prevention or intervention trials, quasi-experimental designs, and statistical matching methods (Jaffee, Strait, & Odgers, 2012).
Second, we did not determine whether PE predicts change in depression more strongly than depression predicts change in PE when both paths are considered simultaneously. Our use of cross-lagged regression effect sizes allowed us to account for the stability of the outcome variable when estimating the relationship between each predictor and outcome. This approach did not, however, allow us to adjust for the predictor variable at Time 2 or to pit one cross-lagged effect size against the other in the same analysis. Although our finding of nearly identical cross-lagged effect sizes suggests that PE predicts change in depression to much the same extent as depression predicts change in PE, it is possible that simultaneous estimation of both paths would have revealed a stronger effect for one than the other.
A third set of limitations stems from our focus on symptoms of depression and anxiety rather than on diagnoses of clinical disorders. As noted earlier, our focus on sympom measures meant that we could not distinguish between competing theoretical models whose predictions are linked to the timing of disorder onset and remission. Additionally, although psychological scientists may seek to understand the full range of outcomes with which PE is associated, clinical interest in PE as a risk factor may depend on its prediction of clinically significant disorders. Finally, two prior meta-analyses found that relationships between personality and psychopathology were stronger when focusing on disorders versus symptoms (Malouff et al., 2005; Ruiz et al., 2008). This hints that our effect sizes might have been larger had we evaluated the associations of PE with depressive and anxiety disorders rather than with symptoms.
A related limitation arises from our use of general, rather than specific, measures of anxiety. Although theoretical models posit that low PE is a risk factor for depression versus anxiety conceptualized generally (e.g., Watson & Naragon-Gainey, 2010), there is evidence that PE may share stronger associations with some anxiety disorders than others (Bienvenu & Stein, 2003; Kashdan, 2007). It is also possible that PE is related more strongly to disorders or symptoms characterized by distress (major depressive disorder, generalized anxiety disorder, posttraumatic stress disorder) than those characterized by fear (panic disorder, social anxiety disorder, specific phobia), although the available cross-sectional data do not support this assertion (Kotov et al., 2010). Our hope is that the current study helps stimulate interest in the relationship between PE and anxiety so that future meta-analyses can test whether PE better predicts some forms of anxiety than others.
Despite these limitations, a focus on general depression and anxiety symptoms has some significant advantages. Studies that test theories of PE as a risk factor for depression typically utilize symptom measures (Fowles, 1994; Gray, 1994; Watson, 2009; Watson et al., 2005); as a result, the number of effect sizes available for symptom measures far outnumber those available for diagnostic measures. Similarly, many more effect sizes are available for general, rather than specific, anxiety measures. Furthermore, assessments of symptoms are usually more reliable than dichotomous, disorder-based measures (Chmielewski et al., 2015; Naragon-Gainey et al., 2009). Importantly, our finding that PE is not specific to depression is consistent with a recent meta-analysis of cross-sectional studies that used diagnostic rather than symptom measures (Kotov et al., 2010). That meta-analysis found that nearly all anxiety disorders, as well as depressive disorders, were associated with decreased levels of PE, suggesting that the pattern of effects observed here may generalize to diagnostic measures and to clinical presentations characterized by distress or fear.
Fourth, the majority of studies in this meta-analysis used self-report measures. Although effect sizes did not differ for studies using self- versus other-report, it is possible that the preponderance of self-report measures inflated estimates of effect size due to shared method variance. This limitation is more applicable to the cross-sectional and uncontrolled prospective relationships, as shared method variance was reduced for cross-lagged effects by controlling for prior levels of the outcome variable (Sowislo & Orth, 2013). It is possible that this control for shared method variance was partly responsible for the attenuation in effect size between the prospective, uncontrolled relationship and the cross-lagged relationship of PE with depression.
Fifth, while we tested the relationship of PE to both depression and anxiety, it is important to keep in mind that there is significant content overlap in these measures (Watson et al., 1995). This likely limited our ability to detect differential relationships with PE. That said, these measures reflect the typical assessment of depression and anxiety in the literature, and they include assessment of non-overlapping as well as overlapping symptoms (Watson, 2009). More widespread use of measures that better distinguish between depression and anxiety would enhance future efforts to evaluate specificity (Watson et al., 1995).
A sixth limitation concerns the relatively small number of studies included in the meta-analysis. This was especially a limitation of the anxiety analyses, but may have also limited our ability to detect more modest moderation effects and the influence of moderators that were represented by relatively few studies (e.g., behavioral activation measures of PE). Additionally, the cross-sectional effect sizes presented in this paper were derived only from studies including a longitudinal component and therefore do not represent an exhaustive review of the literature.
Finally, we did not test for mediators of the relationships of PE to depression and anxiety. Surprisingly few studies have examined mediators of these relationships, although this work is beginning to be done. For example, there is some evidence that the relationship between low PE and later depression is mediated by supportive relationships (Finch & Graziano, 2001; Wetter & Hankin, 2009). It will be important for future research to identify constructs that account for the link between PE and symptoms, as these constructs represent potential targets for treatment.
Even with consideration of these limitations, this meta-analysis is the first to quantify the prospective relationship between a broad personality dimension and symptoms of depression or anxiety. Strengths of this analysis included the examination of longitudinal as well as cross-sectional relationships between PE and symptoms, the rigorous evaluation of PE as a risk factor by controlling for initial symptom levels, the evaluation of directionality by testing symptoms as risk factors for PE, and the evaluation of specificity by testing relationships with anxiety as well as depression. Our results provide support for theoretical accounts that cast low PE as a vulnerability factor for depression. At the same time, these results highlight the need to identify additional vulnerability factors, understand the mechanisms responsible for bidirectional relationships between personality and symptoms, and extend this work to other forms of psychopathology in which PE plays a role.
Supplementary Material
Acknowledgments
This work was supported in part by National Institute of Mental Health grant R01 MH094425 awarded to Ayelet Meron Ruscio. The authors thank Connor R. McLaren for his help with the literature search and Hana F. Zickgraf for her help conducting reliability coding. The authors also thank the researchers who took the time to provide additional study information to enhance the quality of this analysis.
Footnotes
Correlations among the PE constructs of positive affect, extraversion, and behavioral activation have been reported in the range of .48 to .66 (Naragon-Gainey et al., 2013). Following the lead of other researchers, we defined PE as including all three of these constructs (Brown, 2007; Clark et al., 1994; Naragon-Gainey et al., 2013; Naragon-Gainey et al., 2009). Initially, we also planned to include the related construct of reward dependence from the Tridimensional Personality Model (Cloninger, Przybeck, & Svrakic, 1991; Enns & Cox, 1997), but as we found few longitudinal studies of reward dependence and depression, we excluded this construct from our analysis.
As PE has also been studied in relation to schizophrenia/schizotypy (Horan et al., 2008; Watson & Naragon-Gainey, 2010), we initially planned to include this relationship as a further test of specificity. Due to the very small number of longitudinal studies, however, we were unable to include schizophrenia/schizotypy in the analysis.
To rule out differences in study characteristics as an explanation for differences between effect sizes, we reran these analyses using a common set of studies for which all five effect sizes could be calculated (k = 31). The resulting effect sizes were very similar to those presented in the paper and the overall pattern of results was unchanged (see Supplementary Table 3).
To ensure that Fisher’s Zr transformation was not biasing the cross-lagged effect sizes, we recomputed them without first transforming each correlation. These untransformed effect sizes were essentially the same as those reported in the paper.
We reran these analyses using only the studies that provided effect size data for both depression and anxiety. In this small sample (k ranged from 10–20, including just one-third of available depression studies), the effect sizes were very similar to those presented in the paper, although the cross-sectional and prospective, uncontrolled relationships between PE at Time 1 and depression at Time 2 were larger than the corresponding relationships between PE and anxiety when compared using robust variance estimation, both β > −.09, both p < .01 (see Supplementary Table 4).
Zdanowicz et al. (2012) was excluded from this analysis, as the sample included both adolescents and adults.
References
- Akiskal HS, Hirschfeld RM, Yerevanian BI. The relationship of personality to affective disorders. Archives of General Psychiatry. 1983;40(7):801–810. doi: 10.1001/archpsyc.1983.01790060099013. [DOI] [PubMed] [Google Scholar]
- Alexander RA, Scozzaro MJ, Borodkin LJ. Statistical and empirical examination of the chi-square test for homogeneity of correlations in meta-analysis. Psychological Bulletin. 1989;106(2):329–331. doi: 10.1037/0033-2909.106.2.329. [DOI] [Google Scholar]
- American Psychiatric Association. Diagnostic and statistical manual of mental disorders. 5th. Washington, DC: Author; 2013. [Google Scholar]
- *.Avey JB, Wernsing TS, Mhatre KH. A longitudinal analysis of positive psychological constructs and emotions on stress, anxiety, and well-being. Journal of Leadership & Organizational Studies. 2011:216–228. doi: 10.1177/1548051810397368. [DOI] [Google Scholar]
- *.Bardi A, Ryff CD. Interactive effects of traits on adjustment to a life transition. Journal of Personality. 2007;75(5):955–983. doi: 10.1111/j.1467-6494.2007.00462.x. [DOI] [PubMed] [Google Scholar]
- Barlow DH, Ellard KK, Sauer-Zavala S, Bullis JR, Carl JR. The origins of neuroticism. Perspectives on Psychological Science. 2014;9(5):481–496. doi: 10.1177/1745691614544528. [DOI] [PubMed] [Google Scholar]
- Beal DJ, Corey DM, Dunlap WP. On the bias of Huffcutt and Arthur’s (1995) procedure for identifying outliers in the meta-analysis of correlations. Journal of Applied Psychology. 2002;87(3):583–589. doi: 10.1037/0021-9010.87.3.583. [DOI] [PubMed] [Google Scholar]
- Beck AT, Steer RA. Manual for the Beck Anxiety Inventory. San Antonio, TX: Psychological Corporation; 1993. [Google Scholar]
- *.Benyamini Y, Roziner I. The predictive validity of optimism and affectivity in a longitudinal study of older adults. Personality and Individual Differences. 2008;44(4):853–864. doi: 10.1016/j.paid.2007.10.016. [DOI] [PMC free article] [PubMed] [Google Scholar]
- *.Beran TM. Doctoral dissertation. University of California, Los Angeles; Los Angeles, CA: 2009. Personality and coping strategies as predictors of adjustment to choroidal melanoma. ProQuest Information & Learning database. [Google Scholar]
- Berenbaum H, Oltmanns TF. Emotional experience and expression in schizophrenia and depression. Journal of Abnormal Psychology. 1992;101(1):37–44. doi: 10.1037/0021-843X.101.1.37. [DOI] [PMC free article] [PubMed] [Google Scholar]
- Bienvenu OJ, Stein MB. Personality and anxiety disorders: A review. Journal of Personality Disorders. 2003;17(2: Special issue):139–151. doi: 10.1521/pedi.17.2.139.23991. [DOI] [PubMed] [Google Scholar]
- *.Billstedt E, Skoog I, Duberstein P, Marlow T, Hällström T, André M, Waern M. A 37-year prospective study of neuroticism and extraversion in women followed from mid-life to late life. Acta Psychiatrica Scandinavica. 2014;129(1):35–43. doi: 10.1111/acps.12093. [DOI] [PMC free article] [PubMed] [Google Scholar]
- Borenstein M, Hedges LV, Higgins JPT, Rothstein HR. Introduction to meta-analysis. West Sussex, UK: John Wiley & Sons, Ltd.; 2009. [Google Scholar]
- Borenstein M, Hedges LV, Higgins JPT, Rothstein HR. Comprehensive meta-analysis version 3.3.070. Englewood, NJ: Biostat; 2014. [Google Scholar]
- *.Bornstein JE. Doctoral dissertation. Pacific Graduate School of Psychology; Palo Alto, CA: 2003. Personality, coping, and adaptation in maternal caregivers of children with chronic illness. ProQuest Information & Learning database. [Google Scholar]
- *.Brown TA. Temporal course and structural relationships among dimensions of temperament and DSM-IV anxiety and mood disorder constructs. Journal of Abnormal Psychology. 2007;116(2):313–328. doi: 10.1037/0021-843X.116.2.313. [DOI] [PubMed] [Google Scholar]
- Brown TA, Barlow DH. A proposal for a dimensional classification system based on the shared features of the DSM-IV anxiety and mood disorders: Implications for assessment and treatment. Psychological Assessment. 2009;21(3):256–271. doi: 10.1037/a0016608. [DOI] [PMC free article] [PubMed] [Google Scholar]
- *.Buffington AG. Links between depressive symptoms and reactive and effortful temperament mediated by behavioral activation. The Ohio State University; Columbus, OH: 2013. ProQuest Information & Learning database. [Google Scholar]
- Bylsma LM, Morris BH, Rottenberg J. A meta-analysis of emotional reactivity in major depressive disorder. Clinical Psychology Review. 2008;28(4):676–691. doi: 10.1016/j.cpr.2007.10.001. [DOI] [PubMed] [Google Scholar]
- Carl JR. Unpublished doctoral dissertation. Boston University; Boston, MA: 2015. Enhancing positive emotions in anxiety disorders: A preliminary evaluation of a CBT module targeting disturbances in positive emotion regulation. [Google Scholar]
- Carlin JB, Gurrin LC, Sterne JA, Morley R, Dwyer T. Regression models for twin studies: A critical review. International Journal of Epidemiology. 2005;34(5):1089–1099. doi: 10.1093/ije/dyi153. [DOI] [PubMed] [Google Scholar]
- *.Chien LL, Ko HC, Wu JYW. The five-factor model of personality and depressive symptoms: One-year follow-up. Personality and Individual Differences. 2007;43(5):1013–1023. doi: 10.1016/j.paid.2007.02.022. [DOI] [Google Scholar]
- Chmielewski M, Clark LA, Bagby RM, Watson D. Method matters: Understanding diagnostic reliability in DSM-IV and DSM-5. Journal of Abnormal Psychology. 2015;124(3):764–769. doi: 10.1037/abn0000069. [DOI] [PMC free article] [PubMed] [Google Scholar]
- *.Christie KM. Doctoral dissertation. University of Southern California; Los Angeles, CA: 2011. Partners of breast cancer survivors: Research participation and understanding of survivors’ concerns. ProQuest Information & Learning database. [Google Scholar]
- Clark LA. Temperament as a unifying basis for personality and psychopathology. Journal of Abnormal Psychology. 2005;114(4):505–521. doi: 10.1037/0021-843X.114.4.505. [DOI] [PubMed] [Google Scholar]
- Clark LA, Vittengl J, Kraft D, Jarrett RB. Separate personality traits from states to predict depression. Journal of Personality Disorders. 2003;17(2):152–172. doi: 10.1521/pedi.17.2.152.23990. Retrieved from http://www.ncbi.nlm.nih.gov/pubmed/12755328. [DOI] [PMC free article] [PubMed] [Google Scholar]
- Clark LA, Watson D. Tripartite model of anxiety and depression: psychometric Evidence and taxonomic implications. Journal of Abnormal Psychology. 1991;100(3):316–336. doi: 10.1037/0021-843X.100.3.316. [DOI] [PubMed] [Google Scholar]
- Clark LA, Watson D. Temperament: A new paradigm for trait psychology. In: John OP, P LA, editors. Handbook of personality: Theory and research. 2nd. New York, NY: Guilford Press; 1999. pp. 399–423. [Google Scholar]
- Clark LA, Watson D, Mineka S. Temperament, personality, and the mood and anxiety disorders. Journal of Abnormal Psychology. 1994;103(1):103–116. doi: 10.1037/0021-843X.103.1.103. [DOI] [PubMed] [Google Scholar]
- Cloninger CR, Przybeck TR, Svrakic DM. The Tridimensional Personality Questionnaire: U.S. normative data. Psychological Reports. 1991;69(3 Pt 1):1047–1057. doi: 10.2466/pr0.1991.69.3.1047. [DOI] [PubMed] [Google Scholar]
- Cohen J, Cohen P, West SG, Aiken LS. Applied multiple regression/correlation analysis for the behavioral sciences. 3rd. Mahwah, NJ: Lawrence Erlbaum Associates; 2003. [Google Scholar]
- Coie JD, Watt NF, West SG, Hawkins JD, Asarnow JR, Markman HJ, Long B. The science of prevention. A conceptual framework and some directions for a national research program. The American Psychologist. 1993;48(10):1013–1022. doi: 10.1037/0003-066X.48.10.1013. [DOI] [PubMed] [Google Scholar]
- *.Coleman RA, Neimeyer RA. Measuring meaning: Searching for and making sense of spousal loss in late-life. Death Studies. 2010;34(9):804–834. doi: 10.1080/07481181003761625. [DOI] [PMC free article] [PubMed] [Google Scholar]
- Davidson RJ. Affective style and affective disorders: Perspectives from affective neuroscience. Cognition & emotion. 1998;12(3):307–330. doi: 10.1080/026999398379628. [DOI] [Google Scholar]
- *.de Beurs E, Comijs H, Twisk JW, Sonnenberg C, Beekman AT, Deeg D. Stability and change of emotional functioning in late life: Modelling of vulnerability profiles. Journal of Affective Disorders. 2005;84(1):53–62. doi: 10.1016/j.jad.2004.09.006. [DOI] [PubMed] [Google Scholar]
- *.De Bolle M, De Clercq B, Decuyper M, De Fruyt F. Affective determinants of anxiety and depression development in children and adolescents: An individual growth curve analysis. Child Psychiatry & Human Development. 2011;42(6):694–711. doi: 10.1007/s10578-011-0241-6. [DOI] [PubMed] [Google Scholar]
- De Bolle M, De Fruyt F. The tripartite model in childhood and adolescence: Future directions for developmental research. Child Development Perspectives. 2010;4(3):174–180. doi: 10.1111/j.1750-8606.2010.00136.x. [DOI] [Google Scholar]
- Depue RA, Iacono WG. Neurobehavioral aspects of affective disorders. Annual Review of Psychology. 1989;40:457–492. doi: 10.1146/annurev.ps.40.020189.002325. [DOI] [PubMed] [Google Scholar]
- Der-Avakian A, Markou A. The neurobiology of anhedonia and other reward-related deficits. Trends in Neurosciences. 2012;35(1):68–77. doi: 10.1016/j.tins.2011.11.005. [DOI] [PMC free article] [PubMed] [Google Scholar]
- DeRubeis RJ, Cohen ZD, Forand NR, Fournier JC, Gelfand LA, Lorenzo-Luaces L. The Personalized Advantage Index: Translating research on prediction into individualized treatment recommendations. A demonstration. PloS One. 2014;9(1):e83875. doi: 10.1371/journal.pone.0083875. [DOI] [PMC free article] [PubMed] [Google Scholar]
- De Vibe M, Bjørndal A, Tipton E, Hammerstrøm KT, Kowalski K. Mindfulness based stress reduction (MBSR) for improving health, quality of life, and social functioning in adults. Campbell Systematic Reviews. 2012;8(3):1–127. doi: 10.4073/csr.2012.3. [DOI] [Google Scholar]
- Dichter GS. Anhedonia in unipolar major depressive disorder: A review. The Open Psychiatry Journal. 2010;4:1–9. doi: 10.2174/1874354401004010001. [DOI] [Google Scholar]
- Dichter GS, Damiano CA, Allen JA. Reward circuitry dysfunction in psychiatric and neurodevelopmental disorders and genetic syndromes: Animal models and clinical findings. Journal of Neurodevelopmental Disorders. 2012;4(19):1–43. doi: 10.1186/1866-1955-4-19. [DOI] [PMC free article] [PubMed] [Google Scholar]
- *.Dill EJ. Doctoral dissertation. University of Kansas; Lawrence, KS: 2005. An extensive validation of a comprehensive multidimensional measure of internalizing symptoms in adolescents (the I FEEL questionnaire) and an integrated action-control model of depression. ProQuest Information & Learning, database. [Google Scholar]
- Dillon DG, Rosso IM, Pechtel P, Killgore WD, Rauch SL, Pizzagalli DA. Peril and pleasure: An RDoC-inspired examination of threat responses and reward processing in anxiety and depression. Depression and Anxiety. 2014;31(3):233–249. doi: 10.1002/da.22202. [DOI] [PMC free article] [PubMed] [Google Scholar]
- Dougherty LR, Klein DN, Durbin CE, Hayden EP, Olino TM. Temperamental positive and negative emotionality and children’s depressive symptoms: A longitudinal prospective study from age three to age ten. Journal of Social and Clinical Psychology. 2010;29(4):462–488. doi: 10.1521/jscp.2010.29.4.462. [DOI] [Google Scholar]
- Dozier M, Lee SW. Discrepancies between self-and other-report of psychiatric symptomatology: Effects of dismissing attachment strategies. Development and Psychopathology. 1995;7(01):217–226. doi: 10.1017/S095457940000643X. [DOI] [Google Scholar]
- Du L, Bakish D, Ravindran AV, Hrdina PD. Does fluoxetine influence major depression by modifying five-factor personality traits? Journal of Affective Disorders. 2002;71(1):235–241. doi: 10.1016/S0165-0327(01)00370-6. [DOI] [PubMed] [Google Scholar]
- *.Duberstein PR, Palsson SP, Waern M, Skoog I. Personality and risk for depression in a birth cohort of 70-year-olds followed for 15 years. Psychological Medicine. 2008;38(5):663–671. doi: 10.1017/S0033291707002620. [DOI] [PubMed] [Google Scholar]
- Duval S, Tweedie R. Trim and fill: A simple funnel-plot-based method of testing and adjusting for publication bias in meta-analysis. Biometrics. 2000;56(2):455–463. doi: 10.1111/j.0006-341X.2000.00455.x. [DOI] [PubMed] [Google Scholar]
- Enns MW, Cox BJ. Personality dimensions and depression: Review and commentary. Canadian Journal of Psychiatry. 1997;42(3):274–284. doi: 10.1177/070674379704200305. Retrieved from http://www.ncbi.nlm.nih.gov/pubmed/9114943. [DOI] [PubMed] [Google Scholar]
- *.Festen H, Hartman CA, Hogendoorn S, de Haan E, Prins PJM, Reichart CG, Nauta MH. Temperament and parenting predicting anxiety change in cognitive behavioral therapy: The role of mothers, fathers, and children. Journal of Anxiety Disorders. 2013;27(3):289–297. doi: 10.1016/j.janxdis.2013.03.001. [DOI] [PubMed] [Google Scholar]
- Finch JF, Graziano WG. Predicting depression from temperament, personality, and patterns of social relations. Journal of Personality. 2001;69(1):27–55. doi: 10.1111/1467-6494.00135. [DOI] [PubMed] [Google Scholar]
- Finkel SE. Causal analysis with panel data. Thousand Oaks, CA: Sage Publications; 1995. [Google Scholar]
- Folkman S, Moskowitz JT. Positive affect and the other side of coping. American Psychologist. 2000;55(6):647–654. doi: 10.1037/0003-066X.55.6.647. [DOI] [PubMed] [Google Scholar]
- Forbes EE, Dahl RE. Neural systems of positive affect: Relevance to understanding child and adolescent depression? Development and Psychopathology. 2005;17(3):827–850. doi: 10.1017/S095457940505039X. [DOI] [PMC free article] [PubMed] [Google Scholar]
- Forbes EE, Shaw DS, Dahl RE. Alterations in reward-related decision making in boys with recent and future depression. Biological Psychiatry. 2007;61(5):633–639. doi: 10.1016/j.biopsych.2006.05.026. [DOI] [PubMed] [Google Scholar]
- Fowles DC. A motivational theory of psychopathology. In: Spaulding WD, editor. Integrative views of motivation, cognition, and emotion. Vol. 41. Lincoln, NE: University of Nebraska Press; 1994. pp. 181–238. [PubMed] [Google Scholar]
- *.Fox JK. Doctoral dissertation. State University of New York; Albany, NY: Prospective effects of temperamental reactivity, emotion dysregulation, and stress on risk for anxiety and depression in elementary school-age children. ProQuest Information & Learning database. [Google Scholar]
- Fredrickson BL. What good are positive emotions? Review of General Psychology. 1998;2(3):300–319. doi: 10.1037/1089-2680.2.3.300. [DOI] [PMC free article] [PubMed] [Google Scholar]
- *.García-Peña C, Wagner FA, Sánchez-García S, Espinel-Bermúdez C, Juárez-Cedillo T, Pérez-Zepeda M, Gallo JJ. Late-life depressive symptoms: Prediction models of change. Journal of Affective Disorders. 2013;150(3):886–894. doi: 10.1016/j.jad.2013.05.007. [DOI] [PMC free article] [PubMed] [Google Scholar]
- Gard DE, Gard MG, Kring AM, John OP. Anticipatory and consummatory components of the experience of pleasure: A scale development study. Journal of Research in Personality. 2006;40(6):1086–1102. doi: 10.1016/j.jrp.2005.11.001. [DOI] [Google Scholar]
- Geerts E, Bouhuys N. Multi-level prediction of short-term outcome of depression: Non-verbal interpersonal processes, cognitions and personality traits. Psychiatry Research. 1998;79(1):59–72. doi: 10.1016/S0165-1781(98)00021-3. [DOI] [PubMed] [Google Scholar]
- *.Gershuny BS, Sher KJ. The relation between personality and anxiety: Findings from a 3-year prospective study. Journal of Abnormal Psychology. 1998;107(2):252–262. doi: 10.1037/0021-843X.107.2.252. [DOI] [PubMed] [Google Scholar]
- Geschwind N, Peeters F, Jacobs N, Delespaul P, Derom C, Thiery E, Wichers M. Meeting risk with resilience: High daily life reward experience preserves mental health. Acta Psychiatrica Scandinavica. 2010;122(2):129–138. doi: 10.1111/j.1600-0447.2009.01525.x. [DOI] [PubMed] [Google Scholar]
- Gilbert KE. The neglected role of positive emotion in adolescent psychopathology. Clinical Psychology Review. 2012;32(6):467–481. doi: 10.1016/j.cpr.2012.05.005. [DOI] [PubMed] [Google Scholar]
- Gray JA. Framework for a taxonomy of psychiatric disorder. In: v Goozen SHM, d Poll NEV, Sergeant JA, editors. Emotions: Essays on emotion theory. Hillsdale, NJ: Lawrence Erlbaum Associates; 1994. pp. 29–59. [Google Scholar]
- Gruber J, Johnson SL, Oveis C, Keltner D. Risk for mania and positive emotional responding: Too much of a good thing? Emotion. 2008;8(1):23–33. doi: 10.1037/1528-3542.8.1.23. [DOI] [PMC free article] [PubMed] [Google Scholar]
- Gruber J, Oveis C, Keltner D, Johnson SL. A discrete emotions approach to positive emotion disturbance in depression. Cognition and Emotion. 2011;25(1):40–52. doi: 10.1080/02699931003615984. [DOI] [PMC free article] [PubMed] [Google Scholar]
- *.Gudino OG, Nadeem E, Kataoka SH, Lau AS. Reinforcement sensitivity and risk for psychopathology following exposure to violence: A vulnerability-specificity model in Latino youth. Child Psychiatry & Human Development. 2012;43(2):306–321. doi: 10.1007/s10578-011-0266-x. [DOI] [PMC free article] [PubMed] [Google Scholar]
- *.Haase CM, Poulin MJ, Heckhausen J. Happiness as a motivator: Positive affect predicts primary control striving for career and educational goals. Personality and Social Psychology Bulletin. 2012;38(8):1093–1104. doi: 10.1177/0146167212444906. [DOI] [PubMed] [Google Scholar]
- *.Hart SL, Charles ST. Age-related patterns in negative affect and appraisals about colorectal cancer over time. Health Psychology. 2013;32(3):302–310. doi: 10.1037/a0028523. [DOI] [PubMed] [Google Scholar]
- Harvey AG, Watkins E, Mansell W, Shafran R. Cognitive behavioural processes across psychological disorders: A transdiagnostic approach to research and treatment. New York, NY: Oxford University Press; 2004. [Google Scholar]
- Hasler G, Drevets WC, Manji HK, Charney DS. Discovering endophenotypes for major depression. Neuropsychopharmacology. 2004;29(10):1765–1781. doi: 10.1038/sj.npp.1300506. [DOI] [PubMed] [Google Scholar]
- Hedges LV, Olkin I. Statistical method for meta-analysis. Orlando, FL: Academic Press; 1985. [Google Scholar]
- Hedges LV, Tipton E, Johnson MC. Robust variance estimation in meta-regression with dependent effect size estimates. Research Synthesis Methods. 2010;1(1):39–65. doi: 10.1002/jrsm.5. [DOI] [PubMed] [Google Scholar]
- Higgins JP, Thompson SG. Quantifying heterogeneity in a meta-analysis. Statistics in Medicine. 2002;21(11):1539–1558. doi: 10.1002/sim.1186. [DOI] [PubMed] [Google Scholar]
- Hopko DR, Lejuez CW, Ruggiero KJ, Eifert GH. Contemporary behavioral activation treatments for depression: Procedures, principles, and progress. Clinical Psychology Review. 2003;23(5):699–717. doi: 10.1016/s0272-7358(03)00070-9. Retrieved from http://www.ncbi.nlm.nih.gov/pubmed/12971906. [DOI] [PubMed] [Google Scholar]
- Horan WP, Blanchard JJ, Clark LA, Green MF. Affective traits in schizophrenia and schizotypy. Schizophrenia Bulletin. 2008;34(5):856–874. doi: 10.1093/schbul/sbn083. [DOI] [PMC free article] [PubMed] [Google Scholar]
- *.Hou WK, Law CC, Fu YT. Does change in positive affect mediate and/or moderate the impact of symptom distress on psychological adjustment after cancer diagnosis? A prospective analysis. Psychology and Health. 2010;25(4):417–431. doi: 10.1080/08870440802559375. [DOI] [PubMed] [Google Scholar]
- Huffcutt AI, Arthur W. Development of a new outlier statistic for meta-analytic data. Journal of Applied Psychology. 1995;80(2):327–334. doi: 10.1037/0021-9010.80.2.327. [DOI] [Google Scholar]
- Insel TR. The NIMH Research Domain Criteria (RDoC) Project: Precision medicine for psychiatry. American Journal of Psychiatry. 2014;171(4):395–397. doi: 10.1176/appi.ajp.2014.14020138. [DOI] [PubMed] [Google Scholar]
- Jacques HA, Mash EJ. A test of the tripartite model of anxiety and depression in elementary and high school boys and girls. Journal of Abnormal Child Psychology. 2004;32(1):13–25. doi: 10.1023/B:JACP.0000007577.38802.18. [DOI] [PubMed] [Google Scholar]
- Jaffee SR, Strait LB, Odgers CL. From correlates to causes: Can quasi-experimental studies and statistical innovations bring us closer to identifying the causes of antisocial behavior? Psychological Bulletin. 2012;138(2):272–295. doi: 10.1037/a0026020. [DOI] [PMC free article] [PubMed] [Google Scholar]
- *.Joiner TE., Jr Contagious depression: Existence, specificity to depressed symptoms, and the role of reassurance seeking. Journal of Personality and Social Psychology. 1994;67(2):287–296. doi: 10.1037/0022-3514.67.2.287. [DOI] [PubMed] [Google Scholar]
- *.Joiner TE., Jr The price of soliciting and receiving negative feedback: Self-verification theory as a vulnerability to depression theory. Journal of Abnormal Psychology. 1995;104(2):364–372. doi: 10.1037/0021-843X.104.2.364. [DOI] [PubMed] [Google Scholar]
- *.Joiner TE., Jr Shyness and low social support as interactive diatheses, with loneliness as mediator: Testing an interpersonal-personality view of vulnerability to depressive symptoms. Journal of Abnormal Psychology. 1997;106(3):386–394. doi: 10.1037/0021-843X.106.3.386. [DOI] [PubMed] [Google Scholar]
- *.Joiner TE, Jr, Lonigan CJ. Tripartite model of depression and anxiety in youth psychiatric inpatients: Relations with diagnostic status and future symptoms. Journal of Clinical Child Psychology. 2000;29(3):372–382. doi: 10.1207/S15374424JCCP2903_8. [DOI] [PubMed] [Google Scholar]
- *.Jorm AF, Christensen H, Henderson AS, Jacomb PA, Korten AE, Rodgers B. Predicting anxiety and depression from personality: Is there a synergistic effect of neuroticism and extraversion? Journal of Abnormal Psychology. 2000;109(1):145–149. doi: 10.1037/0021-843X.109.1.145. [DOI] [PubMed] [Google Scholar]
- *.Jylhä P, Ketokivi M, Mantere O, Melartin T, Holma M, Rytsälä H, Isometsä E. Do antidepressants change personality? A five-year observational study. Journal of Affective Disorders. 2012;142(1–3):200–207. doi: 10.1016/j.jad.2012.04.026. [DOI] [PubMed] [Google Scholar]
- *.Karademas EC, Tsaousis I. The relationship of patient and spouse personality to cardiac patients’ health: Two observational studies of mediation and moderation. Annals of Behavioral Medicine. 2014;47(1):79–91. doi: 10.1007/s12160-013-9523-5. [DOI] [PubMed] [Google Scholar]
- Kasch KL, Rottenberg J, Arnow BA, Gotlib IH. Behavioral activation and inhibition systems and the severity and course of depression. Journal of Abnormal Psychology. 2002;111(4):589–597. doi: 10.1037/0021-843X.111.4.589. [DOI] [PubMed] [Google Scholar]
- Kashdan TB. Social anxiety spectrum and diminished positive experiences: Theoretical synthesis and meta-analysis. Clinical Psychology Review. 2007;27(3):348–365. doi: 10.1016/j.cpr.2006.12.003. [DOI] [PubMed] [Google Scholar]
- Kaviani H, Gray JA, Checkley SA, Raven PW, Wilson GD, Kumari V. Affective modulation of the startle response in depression: Influence of the severity of depression, anhedonia, and anxiety. Journal of Affective Disorders. 2004;83(1):21–31. doi: 10.1016/j.jad.2004.04.007. [DOI] [PubMed] [Google Scholar]
- Kendall AD, Zinbarg RE, Mineka S, Bobova L, Prenoveau JM, Revelle W, Craske MG. Prospective associations of low positive emotionality with first onsets of depressive and anxiety disorders: Results from a 10-wave latent trait-state modeling study. Journal of Abnormal Psychology. 2015:1–11. doi: 10.1037/abn0000105. [DOI] [PMC free article] [PubMed] [Google Scholar]
- Kendler KS, Gatz M, Gardner CO, Pedersen NL. Personality and major depression: A Swedish longitudinal, population-based twin study. Archives of General Psychiatry. 2006;63(10):1113–1120. doi: 10.1001/archpsyc.63.10.1113. [DOI] [PubMed] [Google Scholar]
- Kendler KS, Myers J. The genetic and environmental relationship between major depression and the five-factor model of personality. Psychological Medicine. 2010;40(05):801–806. doi: 10.1017/S0033291709991140. [DOI] [PubMed] [Google Scholar]
- Kessler RC, Chiu WT, Demler O, Merikangas KR, Walters EE. Prevalence, severity, and comorbidity of 12-month DSM-IV disorders in the National Comorbidity Survey Replication. Archives of General Psychiatry. 2005;62(6):617–627. doi: 10.1001/archpsyc.62.6.617. [DOI] [PMC free article] [PubMed] [Google Scholar]
- *.Keyes CLM, Dhingra SS, Simoes EJ. Change in level of positive mental health as a predictor of future risk of mental illness. American Journal of Public Health. 2010;100(12):2366–2371. doi: 10.2105/AJPH.2010.192245. [DOI] [PMC free article] [PubMed] [Google Scholar]
- Klein DF. Endogenomorphic depression: A conceptual and terminological revision. Archives of General Psychiatry. 1974;31(4):447–454. doi: 10.1001/archpsyc.1974.01760160005001. [DOI] [PubMed] [Google Scholar]
- Klein DN, Kotov R, Bufferd SJ. Personality and depression: Explanatory models and review of the evidence. Annual Review of Clinical Psychology. 2011;7:269–295. doi: 10.1146/annurev-clinpsy-032210-104540. [DOI] [PMC free article] [PubMed] [Google Scholar]
- *.Klimstra TA, Akse J, Hale WW, Raaijmakers QAW, Meeus WHJ. Longitudinal associations between personality traits and problem behavior symptoms in adolescence. Journal of Research in Personality. 2010;44(2):273–284. doi: 10.1016/j.jrp.2010.02.004. [DOI] [Google Scholar]
- Kotov R, Gamez W, Schmidt F, Watson D. Linking “big” personality traits to anxiety, depressive, and substance use disorders: A meta-analysis. Psychological Bulletin. 2010;136(5):768–821. doi: 10.1037/a0020327. [DOI] [PubMed] [Google Scholar]
- Kraemer HC, Kazdin AE, Offord DR, Kessler RC, Jensen PS, Kupfer DJ. Coming to terms with the terms of risk. Archives of General Psychiatry. 1997;54(4):337–343. doi: 10.1001/archpsyc.1997.01830160065009. [DOI] [PubMed] [Google Scholar]
- Kraemer HC, Stice E, Kazdin A, Offord D, Kupfer D. How do risk factors work together? Mediators, moderators, and independent, overlapping, and proxy risk factors. American Journal of Psychiatry. 2001;158(6):848–856. doi: 10.1176/appi.ajp.158.6.848. [DOI] [PubMed] [Google Scholar]
- Krueger RF, McGue M, Iacono WG. The higher-order structure of common DSM mental disorders: Internalization, externalization, and their connections to personality. Personality and Individual Differences. 2001;30(7):1245–1259. doi: 10.1016/S0191-8869(00)00106-9. [DOI] [Google Scholar]
- Krueger RF, Tackett JL. Personality and psychopathology: Working toward the bigger picture. Journal of Personality Disorders. 2003;17(2):109–128. doi: 10.1521/pedi.17.2.109.23986. [DOI] [PubMed] [Google Scholar]
- Kuykendall L, Tay L, Ng V. Leisure engagement and subjective well-being: A meta-analysis. Psychological Bulletin. 2015;141(2):364–403. doi: 10.1037/a0038508. [DOI] [PubMed] [Google Scholar]
- Lahey BB. Public health significance of neuroticism. American Psychologist. 2009;64(4):241–256. doi: 10.1037/a0015309. [DOI] [PMC free article] [PubMed] [Google Scholar]
- *.Langer JK, Weisman JS, Rodebaugh TL, Binder EF, Lenze EJ. Short-term affective recovery from hip fracture prospectively predicts depression and physical functioning. Health Psychology. 2014:30–39. doi: 10.1037/hea0000111. [DOI] [PMC free article] [PubMed] [Google Scholar]
- *.Lengua LJ. Associations among emotionality, self-regulation, adjustment problems, and positive adjustment in middle childhood. Journal of Applied Developmental Psychology. 2003;24(5):595–618. doi: 10.1016/j.appdev.2003.08.002. [DOI] [PMC free article] [PubMed] [Google Scholar]
- Lipsey MW, Wilson DB. Practical meta-analysis. Vol. 49. Thousand Oaks, CA: Sage Publications; 2001. [Google Scholar]
- Locascio JJ. The cross-lagged correlation technique: Reconsideration in terms of exploratory utility, assumption specification and robustness. Educational and Psychological Measurement. 1982;42(4):1023–1036. doi: 10.1177/001316448204200409. [DOI] [Google Scholar]
- *.Loh JMI, Schutte NS, Thorsteinsson EB. Be happy: The role of resilience between characteristic affect and symptoms of depression. Journal of Happiness Studies. 2014;15(5):1125–1138. doi: 10.1007/s10902-013-9467-2. [DOI] [Google Scholar]
- *.Lonigan CJ, Phillips BM, Hooe ES. Relations of positive and negative affectivity to anxiety and depression in children: Evidence from a latent variable longitudinal study. Journal of Consulting and Clinical Psychology. 2003;71(3):465–481. doi: 10.1037/0022-006X.71.3.465. [DOI] [PubMed] [Google Scholar]
- Malouff JM, Thorsteinsson EB, Schutte NS. The relationship between the five-factor model of personality and symptoms of clinical disorders: A meta-analysis. Journal of Psychopathology and Behavioral Assessment. 2005;27(2):101–114. doi: 10.1007/s10862-005-5384-y. [DOI] [Google Scholar]
- *.Marques M, Bos S, Soares MJ, Maia B, Pereira AT, Valente J, Azevedo MH. Is insomnia in late pregnancy a risk factor for postpartum depression/depressive symptomatology? Psychiatry Research. 2011;186(2):272–280. doi: 10.1016/j.psychres.2010.06.029. [DOI] [PubMed] [Google Scholar]
- *.Mascaro N, Rosen DH. Existential meaning’s role in the enhancement of hope and prevention of depressive symptoms. Journal of Personality. 2005;73(4):985–1013. doi: 10.1111/j.1467-6494.2005.00336.x. [DOI] [PubMed] [Google Scholar]
- McCrae RR, Costa PT., Jr Validation of the five-factor model of personality across instruments and observers. Journal of Personality and Social Psychology. 1987;52(1):81–90. doi: 10.1037/0022-3514.52.1.81. [DOI] [PubMed] [Google Scholar]
- McFarland BR, Klein DN. Emotional reactivity in depression: Diminished responsiveness to anticipated reward but not to anticipated punishment or to nonreward or avoidance. Depression and Anxiety. 2009;26(2):117–122. doi: 10.1002/da.20513. [DOI] [PubMed] [Google Scholar]
- *.McIntosh AM, Bastin ME, Luciano M, Maniega SM, del C Valdés Hernández M, Royle NA, Deary IJ. Neuroticism, depressive symptoms and white-matter integrity in the Lothian Birth Cohort 1936. Psychological Medicine. 2013;43(6):1197–1206. doi: 10.1017/S003329171200150X. [DOI] [PubMed] [Google Scholar]
- McMakin DL, Siegle GJ, Shirk SR. Positive affect stimulation and sustainment (PASS) module for depressed mood: A preliminary investigation of treatment-related effects. Cognitive Therapy and Research. 2011;35(3):217–226. doi: 10.1007/s10608-010-9311-5. [DOI] [PMC free article] [PubMed] [Google Scholar]
- *.Meeks S, Van Haitsma K, Kostiwa I, Murrell SA. Positivity and well-being among community-residing elders and nursing home residents: What is the optimal affect balance? The Journals of Gerontology Series B: Psychological Sciences and Social Sciences. 2012;67(4):460–467. doi: 10.1093/geronb/gbr135. [DOI] [PMC free article] [PubMed] [Google Scholar]
- *.Mezulis A, Simonson J, McCauley E, Vander Stoep A. The association between temperament and depressive symptoms in adolescence: Brooding and reflection as potential mediators. Cognition & Emotion. 2011;25(8):1460–1470. doi: 10.1080/02699931.2010.543642. [DOI] [PMC free article] [PubMed] [Google Scholar]
- Mineka S, Watson D, Clark LA. Comorbidity of anxiety and unipolar mood disorders. Annual Review of Psychology. 1998;49:377–412. doi: 10.1146/annurev.psych.49.1.377. [DOI] [PubMed] [Google Scholar]
- Monroe SM, Anderson SF. Depression: The shroud of heterogeneity. Current Directions in Psychological Science. 2015;24(3):227–231. doi: 10.1177/0963721414568342. [DOI] [Google Scholar]
- Moos RH, Cronkite RC. Symptom-based predictors of a 10-year chronic course of treated depression. Journal of Nervous and Mental Disease. 1999;187(6):360–368. doi: 10.1097/00005053-199906000-00005. Retrieved from http://www.ncbi.nlm.nih.gov/pubmed/10379723. [DOI] [PubMed] [Google Scholar]
- Morris BH, Bylsma LM, Rottenberg J. Does emotion predict the course of major depressive disorder? A review of prospective studies. British Journal of Clinical Psychology. 2009;48(3):255–273. doi: 10.1348/014466508X396549. [DOI] [PubMed] [Google Scholar]
- *.Naragon-Gainey K, Gallagher MW, Brown TA. Stable “trait” variance of temperament as a predictor of the temporal course of depression and social phobia. Journal of Abnormal Psychology. 2013;122(3):611–623. doi: 10.1037/a0032997. [DOI] [PMC free article] [PubMed] [Google Scholar]
- Naragon-Gainey K, Watson D. Consensually defined facets of personality as prospective predictors of change in depression symptoms. Assessment. 2014;21(4):387–403. doi: 10.1177/1073191114528030. [DOI] [PubMed] [Google Scholar]
- Naragon-Gainey K, Watson D, Markon KE. Differential relations of depression and social anxiety symptoms to the facets of extraversion/positive emotionality. Journal of Abnormal Psychology. 2009;118(2):299–310. doi: 10.1037/a0015637. [DOI] [PMC free article] [PubMed] [Google Scholar]
- *.O’Neill SC, Cohen LH, Tolpin LH, Gunthert KC. Affective reactivity to daily interpersonal stressors as a prospective predictor of depressive symptoms. Journal of Social and Clinical Psychology. 2004;23(2):172–194. doi: 10.1521/jscp.23.2.172.31015. [DOI] [Google Scholar]
- Oswald FL, Mitchell G, Blanton H, Jaccard J, Tetlock PE. Predicting ethnic and racial discrimination: A meta-analysis of IAT criterion studies. Journal of Personality and Social Psychology. 2013;105(2):171–192. doi: 10.1037/a0032734. [DOI] [PubMed] [Google Scholar]
- Ozer DJ, Benet-Martinez V. Personality and the prediction of consequential outcomes. Annual Review of Psychology. 2006;57:401–421. doi: 10.1146/annurev.psych.57.102904.190127. [DOI] [PubMed] [Google Scholar]
- *.Parrish BP, Cohen LH, Laurenceau JP. Prospective relationship between negative affective reactivity to daily stress and depressive symptoms. Journal of Social and Clinical Psychology. 2011;30(3):270–296. doi: 10.1521/jscp.2011.30.3.270. [DOI] [Google Scholar]
- Pizzagalli DA. Depression, stress, and anhedonia: Toward a synthesis and integrated model. Annual Review of Clinical Psychology. 2014;10:393–423. doi: 10.1146/annurev-clinpsy-050212-185606. [DOI] [PMC free article] [PubMed] [Google Scholar]
- Pizzagalli DA, Iosifescu D, Hallett LA, Ratner KG, Fava M. Reduced hedonic capacity in major depressive disorder: Evidence from a probabilistic reward task. Journal of Psychiatric Research. 2008;43(1):76–87. doi: 10.1016/j.jpsychires.2008.03.001. [DOI] [PMC free article] [PubMed] [Google Scholar]
- *.Poon CYM, Knight BG. Parental emotional support during emerging adulthood and Baby Boomers’ well-being in midlife. International Journal of Behavioral Development. 2013;37(6):498–504. doi: 10.1177/0165025413498217. [DOI] [Google Scholar]
- *.Poulin MJ, Silver RC, Gil-Rivas V, Holman EA, McIntosh DN. Finding social benefits after a collective trauma: Perceiving societal changes and well-being following 9/11. Journal of Traumatic Stress. 2009;22(2):81–90. doi: 10.1002/jts.20391. [DOI] [PubMed] [Google Scholar]
- *.Prenoveau JM. Doctoral dissertation. University of California, Los Angeles; Los Angeles, CA: 2009. Stability of and structural relations among anxiety, depression, neuroticism, and extraversion during adolescence: Results from a 3-year longitudinal latent variable study. ProQuest Information & Learning database. [Google Scholar]
- Radloff LS. The CES-D scale: A self-report depression scale for research in the general population. Applied Psychological Measurement. 1977;1(3):385–401. doi: 10.1177/014662167700100306. [DOI] [Google Scholar]
- Rawal A, Collishaw S, Thapar A, Rice F. ‘The risks of playing it safe’: A prospective longitudinal study of response to reward in the adolescent offspring of depressed parents. Psychological Medicine. 2013;43(1):27–38. doi: 10.1017/S0033291712001158. [DOI] [PubMed] [Google Scholar]
- *.Reddy MK. Doctoral dissertation. Northern Illinois University; DeKalb, IL: 2010. Coping as a mediator in the prospective relationship between personality and PTSD symptoms in Operation Iraqi Freedom (OIF) combat veterans. ProQuest Information & Learning database. [Google Scholar]
- Roberts BW, DelVecchio WF. The rank-order consistency of personality traits from childhood to old age: A quantitative review of longitudinal studies. Psychological Bulletin. 2000;126(1):3–25. doi: 10.1037/0033-2909.126.1.3. [DOI] [PubMed] [Google Scholar]
- *.Robinson-Whelen S, Tada Y, MacCallum RC, McGuire L, Kiecolt-Glaser JK. Long-term caregiving: What happens when it ends? Journal of Abnormal Psychology. 2001;110(4):573–584. doi: 10.1037/0021-843X.110.4.573. [DOI] [PubMed] [Google Scholar]
- *.Robison EJ, Shankman SA, McFarland BR. Independent associations between personality traits and clinical characteristics of depression. Journal of Nervous and Mental Disease. 2009;197(7):476–483. doi: 10.1097/NMD.0b013e3181aad5fc. [DOI] [PMC free article] [PubMed] [Google Scholar]
- Rogosa D. A critique of cross-lagged correlation. Psychological Bulletin. 1980;88(2):245. doi: 10.1037/0033-2909.88.2.245. [DOI] [Google Scholar]
- Rorsman B, Grasbeck A, Hagnell O, Isberg PE, Otterbeck L. Premorbid personality traits and psychosomatic background factors in depression: The Lundby Study 1957–1972. Neuropsychobiology. 1993;27(2):72–79. doi: 10.1159/000118956. [DOI] [PubMed] [Google Scholar]
- Rosenthal R, DiMatteo MR. Meta-analysis: Recent developments in quantitative methods for literature reviews. Annual Review of Psychology. 2001;52:59–82. doi: 10.1146/annurev.psych.52.1.59. [DOI] [PubMed] [Google Scholar]
- Rottenberg J, Kasch KL, Gross JJ, Gotlib IH. Sadness and amusement reactivity differentially predict concurrent and prospective functioning in major depressive disorder. Emotion. 2002;2(2):135–146. doi: 10.1037/1528-3542.2.2.135. [DOI] [PubMed] [Google Scholar]
- Ruiz MA, Pincus AL, Schinka JA. Externalizing pathology and the five-factor model: A meta-analysis of personality traits associated with antisocial personality disorder, substance use disorder, and their co-occurrence. Journal of Personality Disorders. 2008;22(4):365–388. doi: 10.1521/pedi.2008.22.4.365. [DOI] [PubMed] [Google Scholar]
- Ruscio AM, Khazanov GK. Anxiety and Depression. In: DeRubeis RJ, Strunk DR, editors. Oxford Handbook of Mood Disorders. New York, NY: Oxford University Press; 2016. [Google Scholar]
- *.Salsman JM, Segerstrom SC, Brechting EH, Carlson CR, Andrykowski MA. Posttraumatic growth and PTSD symptomatology among colorectal cancer survivors: A 3-month longitudinal examination of cognitive processing. Psychooncology. 2009;18(1):30–41. doi: 10.1002/pon.1367. [DOI] [PMC free article] [PubMed] [Google Scholar]
- Shankman SA, Klein DN. The relation between depression and anxiety: An evaluation of the tripartite, approach-withdrawal and valence-arousal models. Clinical Psychology Review. 2003;23(4):605–637. doi: 10.1016/S0272-7358(03)00038-2. [DOI] [PubMed] [Google Scholar]
- Shankman SA, Klein DN, Tenke CE, Bruder GE. Reward sensitivity in depression: A biobehavioral study. Journal of Abnormal Psychol. 2007;116(1):95–104. doi: 10.1037/0021-843X.116.1.95. [DOI] [PubMed] [Google Scholar]
- Simon GE, Perlis RH. Personalized medicine for depression: Can we match patients with treatments? American Journal of Psychiatry. 2010;167(12):1445–1455. doi: 10.1176/appi.ajp.2010.09111680. [DOI] [PMC free article] [PubMed] [Google Scholar]
- Sloan DM, Strauss ME, Wisner KL. Diminished response to pleasant stimuli by depressed women. Journal of Abnormal Psychology. 2001;110(3):488–493. doi: 10.1037/0021-843X.110.3.488. [DOI] [PubMed] [Google Scholar]
- Smit F, Beekman A, Cuijpers P, de Graaf R, Vollebergh W. Selecting key variables for depression prevention: Results from a population-based prospective epidemiological study. Journal of Affective Disorders. 2004;81(3):241–249. doi: 10.1016/j.jad.2003.08.007. [DOI] [PubMed] [Google Scholar]
- *.Smith LE, Greenberg JS, Seltzer MM. Social support and well-being at mid-life among mothers of adolescents and adults with autism spectrum disorders. Journal of autism and developmental disorders. 2012;42(9):1818–1826. doi: 10.1007/s10803-011-1420-9. [DOI] [PMC free article] [PubMed] [Google Scholar]
- Sowislo JF, Orth U. Does low self-esteem predict depression and anxiety? A meta-analysis of longitudinal studies. Psychological Bulletin. 2013;139(1):213–240. doi: 10.1037/a0028931. [DOI] [PubMed] [Google Scholar]
- Spielberger CD. State-Trait Anxiety Inventory: Bibliography. 2nd. Palo Alto, CA: Consulting Psychologists Press; 1989. [Google Scholar]
- *.Spinhoven P, Roelofs K, Hovens JG, Elzinga BM, van Oppen P, Zitman FG, Penninx BW. Personality, life events and the course of anxiety and depression. European Journal of Personality. 2011;25(6):443–452. doi: 10.1002/per.808. [DOI] [PubMed] [Google Scholar]
- Stanton K, Watson D. Positive and negative affective dysfunction in psychopathology. Social and Personality Psychology Compass. 2014;8(9):555–567. doi: 10.1111/spc3.12132. [DOI] [Google Scholar]
- *.Takahashi Y, Ozaki K, Roberts BW, Ando J. Can low Behavioral Activation System predict depressive mood?: An application of non-normal structural equation modeling. Japanese Psychological Research. 2012;54(2):170–181. doi: 10.1111/j.1468-5884.2011.00492.x. [DOI] [Google Scholar]
- Tang TZ, DeRubeis RJ, Hollon SD, Amsterdam J, Shelton R, Schalet B. Personality change during depression treatment: A placebo-controlled trial. Archives of General Psychiatry. 2009;66(12):1322–1330. doi: 10.1001/archgenpsychiatry.2009.166. [DOI] [PMC free article] [PubMed] [Google Scholar]
- Tanner-Smith EE, Wilson SJ, Lipsey MW. The comparative effectiveness of outpatient treatment for adolescent substance abuse: A meta-analysis. Journal of Substance Abuse Treatment. 2013;44(2):145–158. doi: 10.1016/j.jsat.2012.05.006. [DOI] [PMC free article] [PubMed] [Google Scholar]
- Terrin N, Schmid CH, Lau J, Olkin I. Adjusting for publication bias in the presence of heterogeneity. Statistics in Medicine. 2003;22(13):2113–2126. doi: 10.1002/sim.1461. [DOI] [PubMed] [Google Scholar]
- Treadway MT, Buckholtz JW, Schwartzman AN, Lambert WE, Zald DH. Worth the ‘EEfRT’? The effort expenditure for rewards task as an objective measure of motivation and anhedonia. PloS One. 2009;4(8):e6598. doi: 10.1371/journal.pone.0006598. [DOI] [PMC free article] [PubMed] [Google Scholar]
- Treadway MT, Zald DH. Reconsidering anhedonia in depression: Lessons from translational neuroscience. Neuroscience and Biobehavioral Reviews. 2011;35(3):537–555. doi: 10.1016/j.neubiorev.2010.06.006. [DOI] [PMC free article] [PubMed] [Google Scholar]
- Tugade MM, Fredrickson BL. Resilient individuals use positive emotions to bounce back from negative emotional experiences. Journal of Personality and Social Psychology. 2004;86(2):320–333. doi: 10.1037/0022-3514.86.2.320. [DOI] [PMC free article] [PubMed] [Google Scholar]
- *.Van Dijk D, Seger-Guttmann T, Heller D. Life-threatening event reduces subjective well-being through activating avoidance motivation: A longitudinal study. Emotion. 2013;13(2):216–225. doi: 10.1037/a0029973. [DOI] [PubMed] [Google Scholar]
- *.Vanhalst J, Klimstra TA, Luyckx K, Scholte RH, Engels RC, Goossens L. The interplay of loneliness and depressive symptoms across adolescence: Exploring the role of personality traits. Journal of Youth and Adolescence. 2012;41(6):776–787. doi: 10.1007/s10964-011-9726-7. [DOI] [PubMed] [Google Scholar]
- *.Verstraeten K, Vasey MW, Raes F, Bijttebier P. Temperament and risk for depressive symptoms in adolescence: mediation by rumination and moderation by effortful control. Journal of Abnormal Child Psychology. 2009;37(3):349–361. doi: 10.1007/s10802-008-9293-x. [DOI] [PubMed] [Google Scholar]
- *.Vliegen N, Casalin S, Luyten P, Docx R, Lenaerts M, Tang E, Kempke S. Hospitalization-based treatment for postpartum depressed mothers and their babies: Rationale, principles, and preliminary follow-up data. Psychiatry: Interpersonal and Biological Processes. 2013;76(2):150–168. doi: 10.1521/psyc.2013.76.2.150. [DOI] [PubMed] [Google Scholar]
- *.Voelz ZR, Gencoz F, Gencoz T, Pettit JW, Perez M, Joiner TE., Jr Patterns of hemispheric perceptual asymmetries: Left hemispatial biases predict changes in anxiety and positive affect in undergraduate women. Emotion. 2001;1(4):339–347. doi: 10.1037/1528-3542.1.4.339. [DOI] [PubMed] [Google Scholar]
- von Hippel PT. The heterogeneity statistic I2 can be biased in small meta-analyses. BMC Medical Research Methodology. 2015;15(1):35–42. doi: 10.1186/s12874-015-0024-z. [DOI] [PMC free article] [PubMed] [Google Scholar]
- Wardenaar KJ, Giltay EJ, van Veen T, Zitman FG, Penninx B. Symptom dimensions as predictors of the two-year course of depressive and anxiety disorders. Journal of Affective Disorders. 2012;136(3):1198–1203. doi: 10.1016/j.jad.2011.11.037. [DOI] [PubMed] [Google Scholar]
- Watson D. Differentiating the mood and anxiety disorders: A quadripartite model. Annual Review of Clinical Psychology. 2009;5:221–247. doi: 10.1146/annurev.clinpsy.032408.153510. [DOI] [PubMed] [Google Scholar]
- Watson D, Clark LA. Unpublished manuscript. University of Iowa; Iowa City, IA: 1994. Manual for the positive and negative affect schedule (expanded form) [Google Scholar]
- Watson D, Clark LA, Stasik SM. Emotions and the emotional disorders: A quantitative hierarchical perspective. International Journal of Clinical and Health Psychology. 2011;11(3):429–442. [Google Scholar]
- Watson D, Gamez W, Simms LJ. Basic dimensions of temperament and their relation to anxiety and depression: A symptom-based perspective. Journal of Research in Personality. 2005;39(1):46–66. doi: 10.1016/j.jrp.2004.09.006. [DOI] [Google Scholar]
- Watson D, Naragon-Gainey K. On the specificity of positive emotional dysfunction in psychopathology: Evidence from the mood and anxiety disorders and schizophrenia/schizotypy. Clinical Psychology Review. 2010;30(7):839–848. doi: 10.1016/j.cpr.2009.11.002. [DOI] [PMC free article] [PubMed] [Google Scholar]
- Watson D, Naragon-Gainey K. Personality, emotions, and the emotional disorders. Clinical Psychological Science. 2014;2(4):422–442. doi: 10.1177/2167702614536162. [DOI] [PMC free article] [PubMed] [Google Scholar]
- Watson D, Stasik SM, Ellickson-Larew S, Stanton K. Extraversion and psychopathology: A facet-level analysis. Journal of Abnormal Psychology. 2015:432–446. doi: 10.1037/abn0000051. [DOI] [PubMed] [Google Scholar]
- Watson D, Weber K, Assenheimer JS, Clark LA, Strauss ME, McCormick RA. Testing a tripartite model: I. Evaluating the convergent and discriminant validity of anxiety and depression symptom scales. Journal of Abnormal Psychology. 1995;104(1):3–14. doi: 10.1037/0021-843X.104.1.3. [DOI] [PubMed] [Google Scholar]
- Watson D, Wiese D, Vaidya JG, Tellegen A. The two general activation systems of affect: Structural findings, evolutionary considerations, and psychobiological evidence. Journal of Personality and Social Psychology. 1999;76(5):820–838. doi: 10.1037/0022-3514.76.5.820. [DOI] [Google Scholar]
- *.Weinstein SM, Mermelstein RJ, Hankin BL, Hedeker D, Flay BR. Longitudinal patterns of daily affect and global mood during adolescence. Journal of Research on Adolescence. 2007;17(3):587–600. doi: 10.1111/j.1532-7795.2007.00536.x. [DOI] [PMC free article] [PubMed] [Google Scholar]
- *.Weiss A, Sutin AR, Duberstein PR, Friedman B, Bagby RM, Costa PT., Jr The personality domains and styles of the five-factor model are related to incident depression in Medicare recipients aged 65 to 100. The American Journal of Geriatric Psychiatry. 2009;17(7):591–601. doi: 10.1097/JGP.0b013e31819d859d. [DOI] [PMC free article] [PubMed] [Google Scholar]
- *.Wetter EK, Hankin BL. Mediational pathways through which positive and negative emotionality contribute to anhedonic symptoms of depression: A prospective study of adolescents. Journal of Abnormal Child Psychology. 2009;37(4):507–520. doi: 10.1007/s10802-009-9299-z. [DOI] [PMC free article] [PubMed] [Google Scholar]
- Workshop Proceedings. NIMH Research Domain Criteria (RDoC) Project Positive Valence Systems Domain workshop. Rockville, Maryland: 2011. Jun, [Google Scholar]
- World Health Organization. The world health report, 2002: Reducing the risks, promoting healthy life. 2002 Retrieved from Geneva, Switzerland: http://www.who.int/whr/2002/en/whr02_en.pdf?ua=1.
- *.Yang HJ, Chiu YJ, Soong WT, Chen WJ. The roles of personality traits and negative life events on the episodes of depressive symptoms in nonreferred adolescents: A 1-year follow-up study. Journal of Adolescent Health. 2008;42(4):378–385. doi: 10.1016/j.jadohealth.2007.09.017. [DOI] [PubMed] [Google Scholar]
- *.Zdanowicz N, Lepiece B, Tordeurs D, Jacques D, Reynaert C. Predictability of levels of physical and mental health in adults and adolescents: A 2 years longitudinal study. Paper presented at the Medicinska Naklada; Zagreb, Croatia. 2012. http://www.ncbi.nlm.nih.gov/pubmed/22945179. [PubMed] [Google Scholar]
- Zinbarg RE, Uliaszek AA, Adler JM. The role of personality in psychotherapy for anxiety and depression. Journal of Personality. 2008;76(6):1649–1688. doi: 10.1111/j.1467-6494.2008.00534.x. [DOI] [PubMed] [Google Scholar]
Associated Data
This section collects any data citations, data availability statements, or supplementary materials included in this article.