

Gaal et al. examined the relative positions of the ribosomal RNA operons in space. The results show that E. coli bacterial chromosome folding in three dimensions is not dictated entirely by genetic position but rather includes functionally related, genetically distant loci that come into close proximity, with rRNA operons forming a structure reminiscent of the eukaryotic nucleolus.
Keywords: bacterial chromosome structure, rRNA operons, nucleolus, long-distance chromosomal interactions, ParB-CFP and YFP fusions
Abstract
The spatial organization of DNA within the bacterial nucleoid remains unclear. To investigate chromosome organization in Escherichia coli, we examined the relative positions of the ribosomal RNA (rRNA) operons in space. The seven rRNA operons are nearly identical and separated from each other by as much as 180° on the circular genetic map, a distance of ≥2 million base pairs. By inserting binding sites for fluorescent proteins adjacent to the rRNA operons and then examining their positions pairwise in live cells by epifluorescence microscopy, we found that all but rrnC are in close proximity. Colocalization of the rRNA operons required the rrn P1 promoter region but not the rrn P2 promoter or the rRNA structural genes and occurred with and without active transcription. Non-rRNA operon pairs did not colocalize, and the magnitude of their physical separation generally correlated with that of their genetic separation. Our results show that E. coli bacterial chromosome folding in three dimensions is not dictated entirely by genetic position but rather includes functionally related, genetically distant loci that come into close proximity, with rRNA operons forming a structure reminiscent of the eukaryotic nucleolus.
The Escherichia coli chromosome is a single ∼4.6-million-base-pair (bp) circular DNA molecule with a contour length of ∼1.5 mm, ∼1000-fold longer than the bacterial cell. One operon of ∼5 kb (the length of a ribosomal RNA [rRNA] operon) in theory could stretch the entire length of the bacterial cell if it were present as B-form DNA without compaction. How the chromosome is compacted and folded to form the bacterial nucleoid has been the subject of intense investigation in recent years, in part because it has implications for genome integrity, cell division, gene expression, and antibiotic resistance.
Unlike the eukaryotic nucleus, the bacterial nucleoid is not physically separated from the cytoplasm by a membrane. However, like the eukaryotic chromosome, the bacterial chromosome appears to be highly organized, changes with the cell cycle, and responds to nutritional conditions (Thanbichler and Shapiro 2006; Dorman 2013; Jin et al. 2013; Dame and Tark-Dame 2016). This has led to characterizations of the nucleoid as a complex and evolving but coherent object whose intrinsic mechanical features govern its structure (Fisher et al. 2013).
In one model, the E. coli chromosome is described as a condensed body consisting of a compressed linear array with oriC at the center and the two ends of the array connected by an elongated ter region (Wang et al. 2006; Wiggins et al. 2010). In a second model, the left and right arms of the chromosome are folded together with oriC at one end and ter at the other end of the filament (Youngren et al. 2014). In a third model, the chromosome is organized into four macrodomains and two nonstructured regions with a locus able to interact only with another locus in the same macrodomain or with a locus in the nonstructured regions, resulting in genetic and spatial separation between different parts of the chromosome (Espéli and Boccard 2006; Espeli et al. 2008). The models are not mutually exclusive, and certain models could be more applicable to certain times, growth conditions, or bacterial species.
How specific DNA loci are arranged within these broad general outlines remains to be determined. The positions of individual loci in space are dynamic (Espeli et al. 2008), but systematic, genome-wide cytological analyses of both the E. coli and Caulobacter crescentus chromosomes concluded that the linear order of genes in space recapitulates the genetic map (Viollier et al. 2004; for review, see Wang and Rudner 2014). The linear array has been pictured as a “bottlebrush” in which interwound loops extrude from a central nucleoid scaffold (Le et al. 2013; Wang and Rudner 2014). The ter macrodomain is organized by the MatP and YfbV proteins (Thiel et al. 2012), but the identities of the short- and long-range interactions that might organize other parts of the chromosome remain unclear. DNA-binding proteins such as SeqA, SlmA, MukB, and H-NS have been proposed to be important for nucleoid organization by contributing to the interactions between different loci (Wang and Rudner 2014; Dame Tark-Dame 2016).
Our interest in E. coli chromosome structure emerged from our long-term focus on the mechanisms responsible for ribosome synthesis and its control (Paul et al. 2004). rRNA synthesis rates are coordinated with the cell's translational capacity following nutritional shifts such as amino acid starvation. The primary signal molecules responsible for adjusting ribosome synthesis rates to changing nutritional conditions are ppGpp, an “alarmone” whose synthesis is induced by uncharged transfer RNAs (tRNAs) in the ribosomal A site (Paul et al. 2004; Potrykus and Cashel 2008; Ross et al. 2016), and the concentration of the initial NTP responsible for forming the rRNA transcript (Murray et al. 2003).
When cells grow rapidly in rich medium, the majority of the cell's RNA polymerase (RNAP) is engaged in transcribing rRNA in order to produce the large number of ribosomes needed to meet the cell's translational requirements. Conversely, when cells grow slowly, there is much less rRNA transcription in order to shift the cell's utilization of nutritional resources to other priorities (Paul et al. 2004). The combined effects on rRNA promoters of various regulators—including ppGpp, NTPs, Fis (a nucleoid-associated protein that activates rrn P1 promoters), and other factors—account for the correlation between growth rate and ribosome synthesis rates, and these factors can compensate for each other in mutants lacking individual regulators (Paul et al. 2004).
A complete understanding of the control of ribosome synthesis depends on identification of not only the cis-acting sites and the trans-acting factors responsible for regulation but also the cellular locations of these events in space and time. In theory, changes in the spatial locations or organization of the rRNA operons could accompany or even contribute to the changes in rRNA synthesis rates that result from changes in nutritional and environmental conditions.
In eukaryotes, the nucleolus is the site for rRNA synthesis and assembly of the translation machinery. It can be made from hundreds or thousands of rRNA genes often arrayed in tandem but sometimes from arrays on multiple chromosomes that colocalize (Pederson 2011; McStay 2016). It is a complex network of macromolecules that can make up as much as 25% of the volume of the nucleus. The nucleolus is thought to have evolved to maximize the efficiency of ribosome synthesis and ribosome maturation by forming at a specific location in the chromosome, the NOR (nucleoid-organizing region). The NOR and the nucleolus remain active subjects of investigation in eukaryotic cell biology (McStay 2016).
Several reports in recent years have speculated that there might be nucleolus-like structures in bacteria (e.g., Lewis et al. 2000; Cabrera and Jin 2003; Endesfelder et al. 2013; Jin et al. 2013). Fluorescence-labeled “transcription foci” were observed in fast-growing strains encoding fusions of GFP to RNAP, correlating with the high numbers of RNAP molecules expected to be engaged in transcribing rRNA under these conditions. Consistent with the idea that at least some of these fluorescent foci represented rRNA operons, their intensities declined in starved or slowly growing cells. Superresolution imaging showed that RNAPs formed clusters that occupied specific regions of the nucleoid under the conditions examined; i.e., at fast growth rates when there are large numbers of RNAPs actively transcribing rRNA operons (Bratton et al. 2011; Bakshi et al. 2013; Endesfelder et al. 2013; Stracy et al. 2015). However, such studies directly addressed only the locations of RNAP and not the positions of the different rRNA operons. Since detection depended on the presence of high numbers of RNAPs, no information was obtained about the positions of the rDNA at low growth rates when rRNA transcription was low.
In contrast to previous studies, we took a direct approach to address whether rRNA operons are in close proximity in space. Using recombineering and counterselection approaches, we inserted sites for different fluorescent DNA-binding proteins adjacent to the different rRNA operons as well as many other genetic loci. We then compared the relative positions of rRNA operons and other genes pairwise in live cells.
We show here that most of the rRNA operons are in close proximity in space. The physical separation between six of the seven rRNA operons (all except rrnC) is in the range of ∼80 to ∼130 nm independent of the genetic distance between them (in kilobases). Our data suggest that E. coli rRNA operons form a structure reminiscent of a eukaryotic nucleolus. The promoter region is necessary and sufficient for this “colocalization” of rRNA operons, but, surprisingly, the formation and persistence of the nucleolus-like structure do not depend on formation of an open transcription initiation complex (RPO) or active transcription. We speculate that this structure facilitates ribosome assembly, as has been proposed in eukaryotes, and that it also contributes to folding of the bacterial chromosome.
Results
Relative positions of rRNA operons in space in living cells
There are seven nearly identical rRNA operons in E. coli, dispersed in the origin of replication-proximal half of the chromosome (rrnA, rrnB, rrnC, rrnD, rrnE, rrnG, and rrnH; for historical reasons, there is no rrnF). Each operon contains a 16S, 23S, and at least one 5S rRNA gene as well as one, two, or three tRNA genes (Keener and Nomura 1996). The positions of the seven rRNA operons are displayed schematically on the genetic map in Figure 1A. These and other loci examined here are superimposed on the proposed locations of the E. coli macrodomains (see above) in Supplemental Figure S1.
Figure 1.
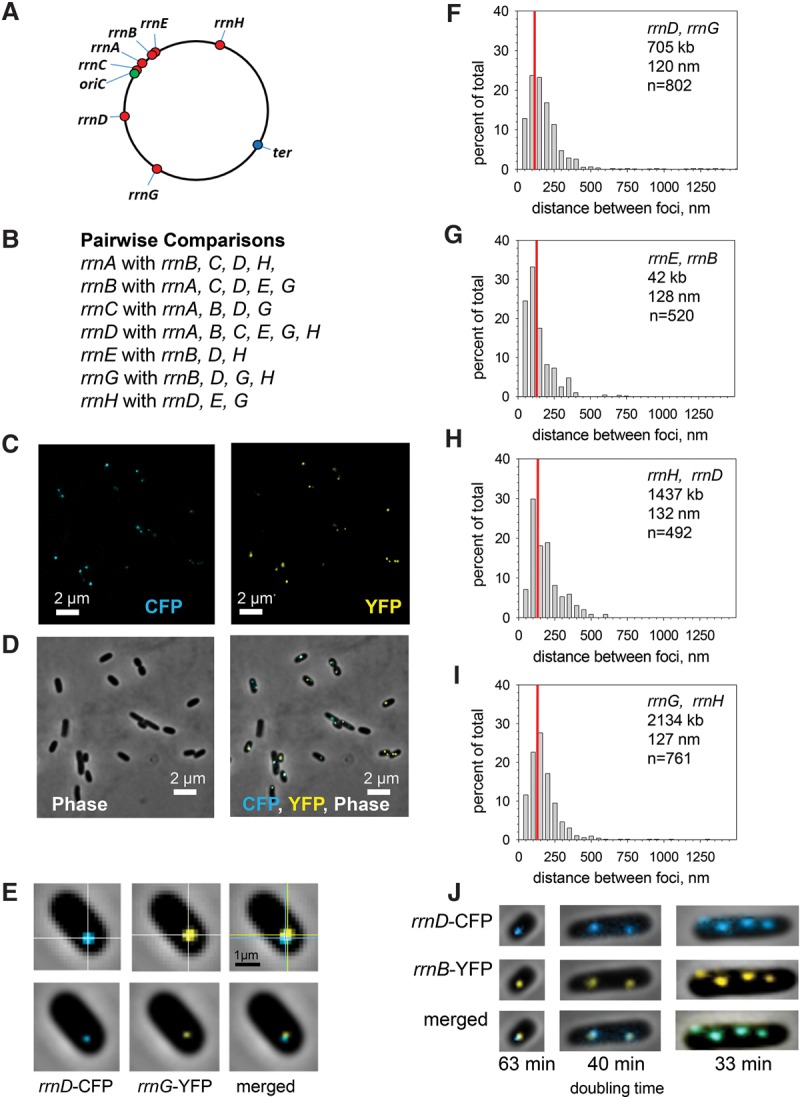
rRNA operons are in close proximity in space. (A) Locations of rRNA operons on the E. coli genetic map. (B) The rRNA operon pairs examined. Each operon was examined pairwise with at least three other rRNA operons. See Table 1 for a complete set of the rRNA and non-rRNA loci examined. (C) Field of fluorescent cells (RLG11975) containing ParB-CFP (cyan fluorescent protein) bound adjacent to rrnD (left) and ParB-YFP (yellow fluorescent protein) adjacent to rrnG (right). Cells were grown in EZ-rich defined medium at 30°C and analyzed in mid-log phase. (D, left) The same field examined by phase contrast. (Right) The same field with fluorescent images superimposed on the phase contrast image. (E, top row) Representative cell from the population shown in C and D containing unprocessed images of an rrnD-CFP, rrnG-YFP pair. For illustration only, the intersection of the white lines indicates the position of the centroid. Centroids were determined as described in the Materials and Methods. (Bottom row) Same cell as above, but images were smoothed to illustrate the position of the centroid. (F) Distribution of the measured distances between CFP and YFP foci: rrnD, rrnG (RLG11975). (Throughout this work, the CFP fusion is listed first, and the YFP fusion is listed second.) The data are grouped in 50-nm bins for purposes of illustration. The red line represents the position of the median. In some graphs, the median appears to be offset because of binning, but this does not influence its numerical value. The genetic distance (separation between operons in kilobases), physical distance (separation between the measured CFP and YFP centroids in nanometers), and the number of cells measured (n) are indicated. Distributions for all of the rRNA operon pairs that are not shown in Figure 1 (except those containing rrnC) are in Supplemental Figure S2. Pairs containing rrnC are in Figure 2 and Supplemental Figure S5. (G) Distribution of the measured distances between the CFP and YFP foci: rrnE, rrnB (RLG10650). (H) Distribution of the measured distances between the CFP and YFP foci: rrnH, rrnD (RLG10668). (I) Distribution of the measured distances between the CFP and YFP foci: rrnG, rrnH (RLG11977). (J) rrnD, rrnB (RLG11507). (Left) Cells were grown in MOPS minimal medium with glucose (doubling time 63 min; one chromosome per cell). (Middle) Cells grown in EZ-rich glucose defined medium (40 min; one or two chromosomes per cell). (Right) Cells grown in LB complex medium (33 min; as many as four chromosomes per cell).
In order to examine the relative positions of the rRNA operons in space, we adapted a previously described system using two different ParB homologs, each of which binds to a different DNA sequence (parS site) inserted next to an rRNA operon (Nielsen et al. 2006). The ParB protein that binds to one of these sites was fused to cyan fluorescent protein (CFP), and the ParB that binds to the other parS site was fused to yellow fluorescent protein (YFP). The ParB derivatives do not recognize the host par sites used for bacterial chromosome partitioning, and the ParB mutants that were used did not retain their partitioning functions. The ParB-CFP and ParB-YFP proteins were expressed from the same plasmid, and their emission patterns were examined by epifluorescence microscopy. In order to measure the spatial separation between rRNA operons, we merged the digital images of the operons examined pairwise at the appropriate wavelengths for CFP and YFP (see the Materials and Methods).
Each rRNA operon was examined pairwise in EZ-rich defined glucose medium (doubling time 40 min at 30°C) with at least three other rRNA operons (Fig. 1B; Table 1), allowing calculation of their relative positions. Fluorescence images (without any image processing) of a representative field of cells containing both rrnD-CFP and rrnG-YFP are shown in Figure 1C. A phase contrast image of the same field is shown in Figure 1D (left), and the superimposed fluorescence and phase contrast images are shown in Figure 1D (right). Figure 1E shows a representative cell from this rrnD-CFP, rrnG-YFP population. Unprocessed CFP, YFP, and merged images are shown in the top row of Figure 1E. The calculated centers of fluorescence of the observed foci are shown at the intersection of the white cross-hairs (centroids) (see the Materials and Methods). For illustration, the centroids are also pictured as smoothed dots on the images in the bottom row of Figure 1E. Figure 1F shows the distances between the rrnD-CFP and rrnG-YFP operons as a distribution of measurements of pairs from 802 cells based on the distances between the calculated centroids of the two foci (see the Materials and Methods). Distributions of measured distances between three other representative rRNA operon pairs are shown in Figure 1, G–I. Additional examples of measured rRNA operon pairs are in Supplemental Figure S2.
Table 1.
Genetic distances (in kilobases) and measured physical distances (in nanometers) between foci
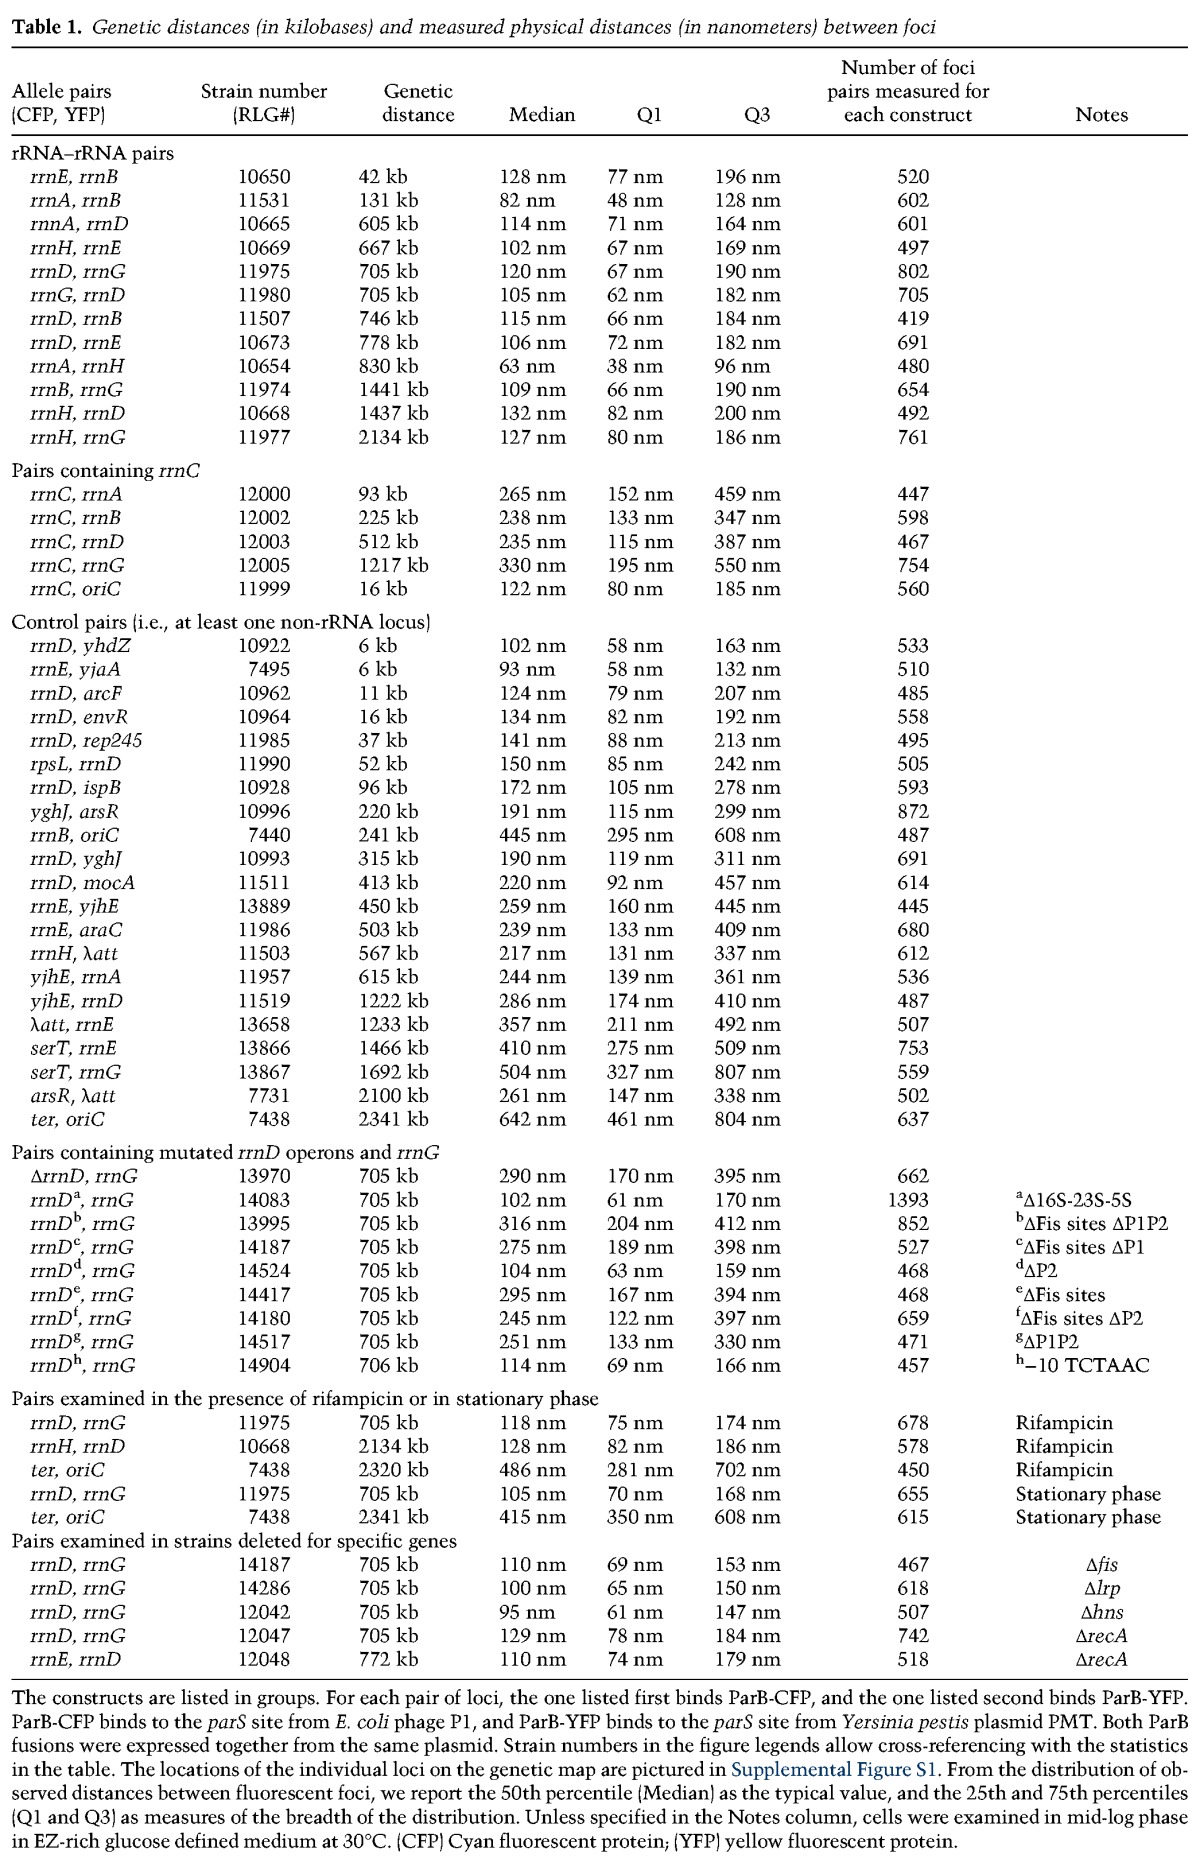
The constructs are listed in groups. For each pair of loci, the one listed first binds ParB-CFP, and the one listed second binds ParB-YFP. ParB-CFP binds to the parS site from E. coli phage P1, and ParB-YFP binds to the parS site from Yersinia pestis plasmid PMT. Both ParB fusions were expressed together from the same plasmid. Strain numbers in the figure legends allow cross-referencing with the statistics in the table. The locations of the individual loci on the genetic map are pictured in Supplemental Figure S1. From the distribution of observed distances between fluorescent foci, we report the 50th percentile (Median) as the typical value, and the 25th and 75th percentiles (Q1 and Q3) as measures of the breadth of the distribution. Unless specified in the Notes column, cells were examined in mid-log phase in EZ-rich glucose defined medium at 30°C. (CFP) Cyan fluorescent protein; (YFP) yellow fluorescent protein.
The median distances between the complete set of rRNA operons (in nanometers) is shown in Table 1 along with the genetic distances between the rRNA loci (in kilobases), the number of cells examined (n), and the inner and outer quartiles of the observed distributions. The genetic distances between rRNA operon pairs ranged from 42 kb (rrnB, rrnE) to 2134 kb (rrnG, rrnH), a separation of ∼180° on the circular representation of the E. coli chromosome (Fig. 1A). This genetic separation is similar in kilobases to that between the origin and terminus of replication (oriC, ter; 2320 kb). Notably, the physical separation between the rRNA operons that were closest together (rrnB, rrnE) (Fig. 1G) and farthest apart (rrnG, rrnH) (Fig. 1I) were virtually identical (128 nm and 127 nm, respectively). In fact, six of the seven rRNA operons (i.e., all except rrnC, which is discussed below) were located very close to each other in space (63–132 nm) in spite of their widely dispersed locations on the genetic map. In contrast, non-rRNA locus pairs were much further apart in space (see below).
Because it has been reported that ParB proteins bind at the parS site and spread out from the nucleation site, we tested whether ParB affected expression of an rrnB P1 promoter-lacZ fusion whose transcription start site was 80 bp downstream from a parS site. As shown in Supplemental Table S2 and its legend, binding of ParB does not spread to the promoter region or this is insufficient to interfere with transcription. We conclude that ParB binding is unlikely to be perturbing the system. We also measured the effect of ParB on antibiotic resistance of a nearby kanamycin or tetracycline resistance cassette. Again, at standard antibiotic concentrations, little or no effect of ParB binding was detected on antibiotic resistance (data not shown).
DNA movement could account for part of the apparent distance separating rRNA operons
The bacterial chromosome is dynamic (Espeli et al. 2008). Therefore, we asked whether movement of two foci during the time required to measure their relative positions could account for the ∼100-nm separation between the rRNA operons. The time needed to switch filters and collect two images of the same cell was ≤1 sec (see the Materials and Methods). Tracking of single loci with time indicated that the median distance traveled by the YFP focus formed at rrnE was 84 nm/sec ± 24 nm/sec and that the median distance traveled by the CFP focus at rrnD was 69 nm/sec ± 14 nm/sec (Supplemental Fig. S3). In both cases, movement appeared to be random.
The distance traveled per second places a boundary on the precision with which we can conclude that two foci are in the same place at the same time. Because this distance is almost as great as the measured distances separating six of the seven rRNA operons, two foci that appear to be separated by ∼100 nm could, in theory, occupy the same space at the same time, but their positions might have changed during the time required to record the images. Thus, the apparent separation between the rRNA operons could represent the actual separation in space between rRNA loci, or the loci could fully overlap in space. However, two loci could also move further apart during the time required for creating the images.
Our methods allow us to measure the relative positions of centroid pairs to a precision of ∼100 nm; i.e., ∼5% of the long axis and ∼10% of the short axis of an average cell. In any case, the genetically distant rRNA operon focus pairs are much closer together than their genetic locations would predict. However, our use of the term “colocalization” is not meant to imply that the two foci necessarily interact physically. Colocalization could result from physical interaction of the operons or independent positioning of the rRNA loci at the same location.
The number of chromosomes does not influence the apparent distance between rRNA operons on the same chromosome
E. coli chromosome replication takes ∼40 min, but cell division times in rich medium can be substantially shorter than this. To ensure segregation of a complete chromosome to each daughter cell, new rounds of replication are initiated before the previous round finishes. Therefore, depending on the nutritional conditions of the culture, cells can contain four or even more copies of individual loci.
Under the culture conditions used in Figure 1 (EZ-rich glucose defined medium), cells generally had either one or two rrnB-CFP and rrnD-YFP foci, although a few had as many as four (Fig. 1J). For illustration, the representative images chosen in Figure 1, E–I, contained a single pair of rRNA foci. However, measurements of the distances between rRNA operons were made on all cells with discrete fluorescent foci. Images of rRNA operon pairs in cells with one, two, or four pairs of fluorescent foci are shown in Figure 1J. Independent of the number of foci per cell, foci of the same color were separated, whereas CFP and YFP focus pairs were in close proximity. We interpret these results to mean that newly replicated chromosomes separate quickly, and rapid chromosome segregation may prevent potential interactions between rRNA operons on different chromosomes in the same cell.
We also asked whether the separation between rRNA operon pairs differed quantitatively in the subsets of the population with one pair of foci versus two pairs of foci (Supplemental Fig. S4A,B). The cells with one or two pairs had almost identical median distances between rRNA operons, and the distributions were very similar.
Newly replicated sister chromatids stay together for a short time before a completed new chromosome segregates into what will become the daughter cell (Joshi et al. 2011). Occasionally, we observed uneven numbers of CFP and YFP foci (e.g., Supplemental Fig. S4C). Consistent with the interpretation that the extra focus had just replicated and was in the process of segregating to a new position in the cell, the extra focus always resulted from the parS site that was closer to the origin of replication.
rrnC does not colocalize with other rRNA operons
We measured the distances between rrnC and four other rRNA operons (rrnD, rrnA, rrnB, and rrnG) (Table 1; Fig. 2A,B; Supplemental Fig. S5A,B). These distances (235-, 265-, 238-, and 330-nm median separation, respectively) were much greater than the median distances for rRNA operon pairs, not including rrnC (63–132 nm) (Table 1; Fig. 1; Supplemental Fig. S2). Because rrnC is only ∼16 kb from the origin of replication (oriC), we also measured the rrnC–oriC median separation. Not surprisingly, rrnC and oriC were close in space (∼122 nm) (Fig. 2C). In contrast, rrnB did not colocalize with oriC (254 kb; 445 nm apart) (Fig. 2D). Taken together, these results suggest that the mechanism responsible for bringing the six non-rrnC rRNA operons into close proximity is overridden by the mechanism that controls oriC position during the cell cycle.
Figure 2.
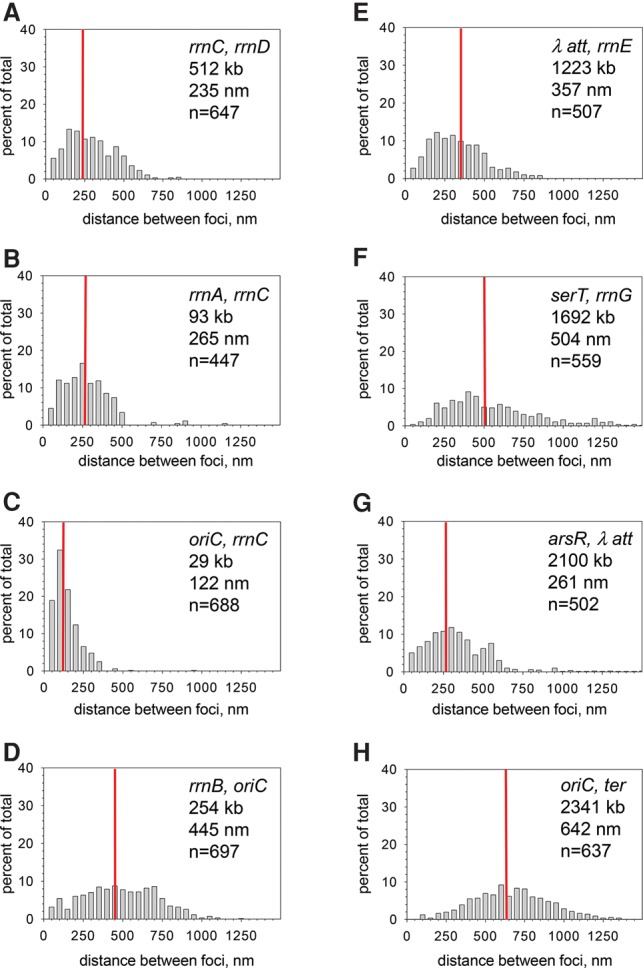
rrnC and non-rRNA loci do not colocalize with the other rRNA operons. Each panel shows the distribution of measured distances between CFP and YFP foci. See the legend for Figure 1 for details. (A) rrnC, rrnD (RLG12003). (B) rrnA, rrnC (RLG12000). Other rRNA operons pairs containing rrnC are in Supplemental Figure S5. (C) oriC, rrnC (RLG11999). (D) rrnB, oriC (RLG7440). (E) λatt, rrnE (RLG13658). (F) serT, rrnG (RLG13867). (G) arsR, λatt (RLG1314). (H) oriC, ter (RLG7438).
Non-rRNA loci do not colocalize with rRNA operons or other non-rRNA loci
We tested several rRNA operons for colocalization with non-rRNA loci (Table 1; Fig. 2E,F; Supplemental Figs. S5C–H). We also tested loci at increasing genetic distances downstream from the parS site adjacent to the rrnD P1 promoter. Foci created by inserting a parS site at yhdZ, 6 kb downstream (adjacent to the rrnD transcription terminators) (Supplemental Fig. S5C); at arcF, 11 kb downstream (Table 1); at envR, 16 kb downstream (Table 1); or at rep245, 35 kb downstream (Table 1) were not statistically distinguishable from the parS site adjacent to the rrnD P1 promoter (P > 0.05) (see the Materials and Methods). However, as the genetic separation between rrnD and the downstream loci increased to 52 kb (rpsL) (Supplemental Fig. S5D), 96 kb (ispB) (Supplemental Fig. S5E), 315 kb (yghJ) (Supplemental Fig. S5F), 413 kb (mocA) (Supplemental Fig. S5G), or 1222 kb (yaeF) (Supplemental Fig. S5H), the spatial separations from rrnD were statistically significant (P < 0.05).
Interestingly, serT, coding for a serine tRNA, did not colocalize with rrnG (1692 kb and 504 nm apart) (Fig. 2F). If this tRNA gene is typical of other tRNA genes, then not all stable RNA genes colocalize with the six non-rrnC rRNA operons. Some other non-rRNA loci were also examined as pairs with rRNA operons or each other (Fig. 2E–H; Table 1). None of these pairs colocalized. The separation of oriC from ter in space (Fig. 2H) has been reported previously (Nielsen et al. 2006).
It is conceivable that the position of the parS site inserted just upstream of the rRNA operon was not representative of the position of the entire operon. As noted above, the positions of the foci formed by parS sites adjacent to the rrnD promoters were indistinguishable from those formed adjacent to the terminators 6 kb downstream (rrnD-CFP, yhdZ-YFP) (Supplemental Fig. S5C). The same result was obtained for rrnE-CFP and a focus formed by a parS site 6 kb downstream (yjaA-YFP) (Table 1). We conclude that the parS site just upstream of the promoter is representative of the beginning and end of the operon. However, future experiments will be needed to determine whether other parts of the operon also colocalize with the promoter and terminator regions.
Cis-acting DNA sequences required for colocalization: the rrn P1 promoter region is necessary and sufficient
We next tested whether the genomic context of a natural rRNA operon rather than the rRNA operon itself was responsible for its colocalization with other rRNA operons. Starting with an intact rrnD operon with an adjacent parS site (Fig. 1F), we removed the DNA sequences from just upstream of the rrnD promoters to just downstream from the transcription terminators (i.e., from 397 bp upstream of the rrnD P1 transcription start site to 2 bp downstream from terminator T2), leaving the parS site intact (Fig. 3A). Whereas the median distance between the intact rrnD operon and the intact rrnG operon was 120 nm (Fig. 1F), deletion of the entire rrnD operon, leaving the adjacent parS site in place, resulted in a median separation of 290 nm (ΔrrnD) (Fig. 3A). We conclude that chromosomal context is insufficient to explain rRNA operon colocalization.
Figure 3.
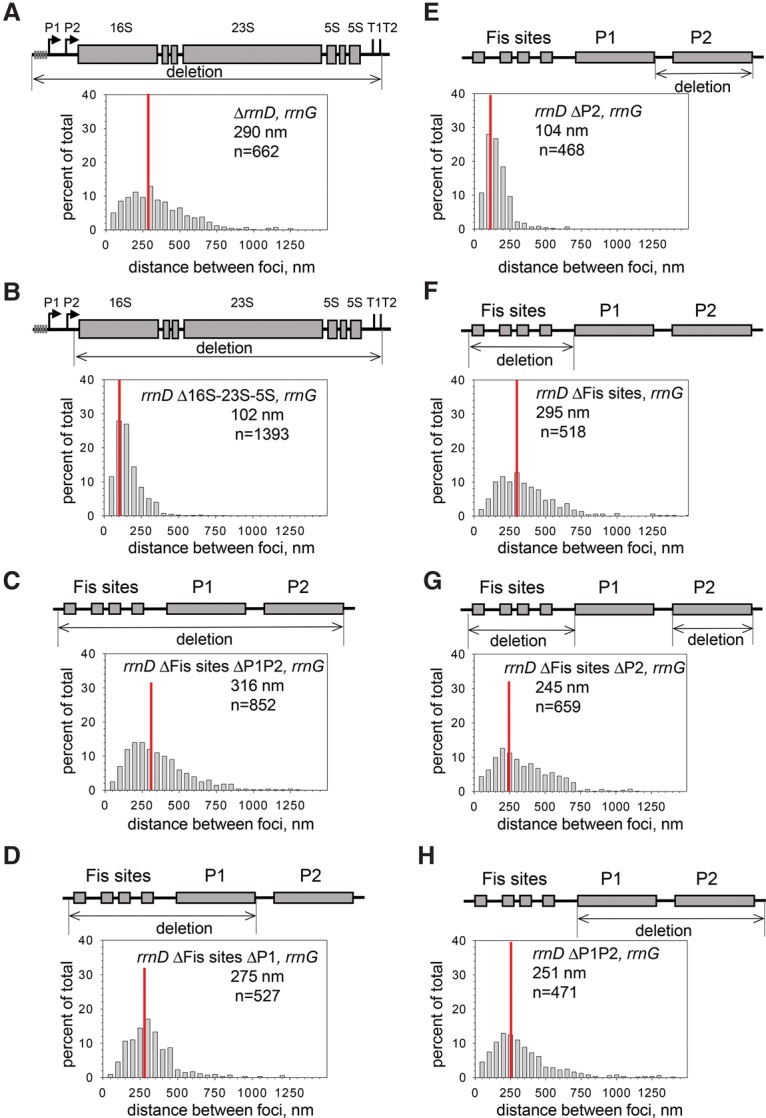
Cis-acting requirements for rRNA operon colocalization. In each panel, the foci were formed by ParB-CFP bound adjacent to a mutant rrnD operon, and ParB-YFP bound adjacent to a wild-type rrnG operon. For comparison, the distribution of distances for the wild-type rrnD–rrnG operon pair is shown in Figure 1F (RLG11975): median separation 120 nm. Growth conditions were the same as in Figure 1 (log phase, EZ-rich glucose defined medium). (A) Complete operon deletion (ΔrrnD; RLG13970). Deletion is from 397 bp upstream of the rrnD P1 transcription start site (TSS) to 2 bp downstream from terminator T2, leaving the ParS site intact. (B) Deletion of rrnD structural genes (Δ16S-23S-5S; RLG14083). Deletion is from 2 bp downstream from rrnD P2 TSS to 2 bp downstream from terminator T2, leaving the parS site and the promoters intact. (C) Deletion of rrnD promoters, including Fis sites (ΔFis sites ΔP1P2; RLG13995). Deletion is from 397 bp upstream of the P1 TSS to 2 bp downstream from the P2 TSS. (D) Deletion of Fis sites and the P1 promoter (ΔFis sites ΔP1; RLG14187). Deletion is from −397 to +1 with respect to the P1 TSS. (E) Deletion of the P2 promoter (ΔP2; RLG14524). Deletion is from −107 to +2 with respect to the P2 TSS. (F) Deletion of Fis sites (ΔFis sites; RLG14417). Deletion is from −397 to −60 with respect to the P1 TSS. (G) Deletion of Fis sites and the P2 promoter (ΔFis ΔP2; RLG14180). Deletion is from −397 to −60 with respect to the P1 TSS and from −107 to +2 with respect to the P2 TSS. (H) Deletion of the P1 and P2 promoters (ΔP1ΔP2; RLG14517). Deletion is from −60 upstream of the P1 TSS to +2 downstream from the P2 TSS.
We next dissected the rrnD operon to determine which parts were responsible for its colocalization with other rRNA operons. Removal of the structural genes had little effect on colocalization (median distance between ΔrrnD 16S–23S–5S and rrnG was 102 nm) (Fig. 3B). Like the other six rRNA operons in E. coli, rrnD has two promoters, P1 and P2, and rrnD P1 is activated by binding of the transcription factor Fis to sites upstream of the promoter (Hirvonen et al. 2001). Removal of the entire promoter region, leaving the structural genes intact, eliminated colocalization (ΔFisΔP1ΔP2; 316 nm) (Fig. 3C).
Removal of the Fis sites and the rrnD P1 promoter, leaving the rrnD P2 region intact (ΔFisΔP1) (Fig. 3D), also eliminated colocalization (the median rrnD–rrnG distance was 275 nm, essentially the same as deletion of the entire operon). Deletion of only the rrnD P2 region did not affect colocalization (ΔP2; 104 nm) (Fig. 3E). Since the rrnD P1–P2 region was necessary (Fig. 3C) and sufficient (Fig. 3B) and the rrnD P2 region was dispensable (Fig. 3E), we conclude that the P1 region is responsible for colocalization.
Therefore, constructs were tested in which different parts of the rrnD P1 region were eliminated: The regions containing the Fis sites (ΔFis sites; 295 nm) (Fig. 3F), the Fis sites and P2 (ΔFisΔP2; 245 nm) (Fig. 3G), or the P1 and P2 promoters but leaving the Fis sites intact (ΔP1ΔP2; 251 nm) (Fig. 3H) all decreased colocalization. Assuming that rrnD is characteristic of other rRNA operons, we conclude that the P1 promoter combined with the region containing the Fis sites is responsible for colocalization.
rRNA operons are in close physical proximity independent of their transcription activities
In rapid exponential growth, rRNA operons are among the most highly expressed transcription units in the E. coli cell. Direct observation by transmission electron microscopy showed that at least 65 RNAPs are present on a single operon and that multiple operons are expressed coordinately (French and Miller 1989). Thus, our observation that the promoter region is necessary and sufficient for colocalization of rRNA operons invited the hypothesis that active transcription by RNAPs was responsible. To test this model, we treated cells with rifampicin, an inhibitor of transcription, and measured the distances between rRNA operon pairs. Rifampicin binds adjacent to the RNAP active site, preventing RNA chain growth beyond 2–3 nucleotides (nt) (Feklistov et al. 2008), thereby freezing the initial RNAP and excluding additional RNAPs from accessing the rRNA promoter (Ohlsen and Gralla 1992). RNA chains longer than 2–3 nt before rifampicin addition continue transcription until reaching the terminator. Because rRNA chain growth is ∼42 nt/sec (Gotta et al. 1991), RNAPs finish transcription of an rRNA operon in ∼2 min (5000 nt/42 nt/sec = 119 sec).
After rifampicin addition, cells containing the rrn-CFP and YFP fusions were visualized at various times from 10 to 45 min to ensure that the elongating RNAPs had cleared the rRNA operons. The nucleoid in the rifampicin-treated cells appeared expanded when examined by DAPI staining (Fig. 4A,B), as reported previously (Cabrera and Jin 2003). The distances between pairs of rRNA operons were essentially the same in cells treated with rifampicin for different times and in the untreated cells (for the rrnD, rrnG pair, cf. Figs. 4C and 1F, 118 nm and 120 nm, respectively; for the rrnD, rrnH pair, cf. Figs. 4D and 1E, 128 and 132 nm, respectively). Non-rRNA operon pairs (e.g. oriC and ter) did not colocalize with or without rifampicin (Figs. 4E, 2H, 486 nm and 642 nm, respectively).
Figure 4.
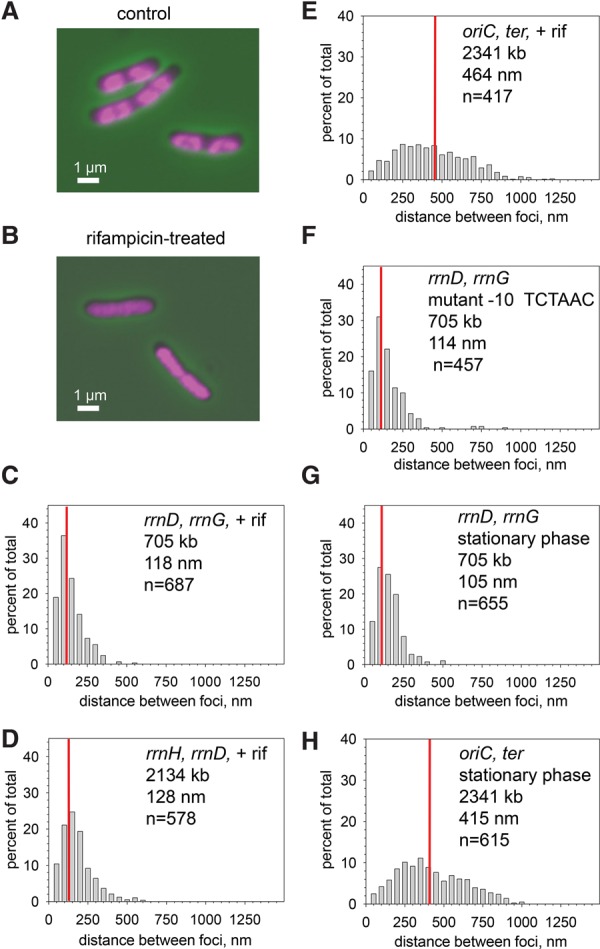
Active transcription is unnecessary to bring rRNA operons into close proximity. (A) DAPI-stained cells (RLG11975) in the absence of rifampicin. (B) DAPI-stained cells (RLG11975) in the presence of 100 μg/mL rifampicin for 30 min. Note nucleoid expansion, suggesting that the drug treatment affected nucleoid structure. (C) rrnD, rrnG with rifampicin (RLG11975). Compare with the rrnD, rrnG pair without rifampicin (Fig. 1F). (D) rrnH, rrnD with rifampicin (RLG10668). Compare with Figure 1H. (E) oriC, ter with rifampicin. The same pair without rifampicin is shown in Figure 2H. (F) rrnD −10 hexamer mutant, rrnG (RLG14904). Compare with the wild-type rrnD, rrnG pair in Figure 1F. (G) rrnD, rrnG in stationary phase (RLG11975). Compare with log-phase cells (Fig. 1F). (H) oriC, ter in stationary phase (RLG7438). Compare with log-phase cells (Fig. 2H).
As a second measure of the independence of active transcription and rRNA operon colocalization, we next measured an rRNA operon pair in which the chromosomal rrnD P1 promoter was inactivated by mutation (since the P1 promoter was required for colocalization, whereas the P2 promoter was not) (see above). The P1 promoter contained a −10 hexamer in which the two most important base pairs for open complex formation, the second and sixth positions, were mutated to unfavorable bases (TATAAT to TCTAAC) (Feklistov and Darst 2011). Consistent with the model that RNAP activity is not responsible for colocalization, the rrnD-CFP, rrnG-YFP distance was unaffected (120 nm for the wild type vs. 114 nm for the operon with the mutant promoter) (Figs. 1F, 4F).
As a third indicator that high transcription activity was not responsible for rRNA operon colocalization, we measured the median rrnD–rrnG distance in stationary-phase cells. rRNA promoter activity was very weak in stationary phase (Murray et al. 2003), but the separation between the two rRNA operons was essentially the same as in exponentially growing cells (105 nm in Fig. 4G vs. 120 nm in log phase in Fig. 1F). Although the short length of stationary-phase cells limits the potential separation between rRNA focus pairs theoretically possible compared with that in exponentially growing cells, the separation of oriC and ter (415 nm) was easily detectable under these conditions (Fig. 4H), suggesting that the short length of stationary-phase cells does not explain colocalization of rRNA operons in stationary phase. Taken together, our results strongly suggest that the forces responsible for colocalization of rRNA operons are not dependent on high expression of rRNA operons (i.e., high numbers of RNAPs).
Previously reported rRNA promoter-binding factors are not required for bringing rRNA operons into close proximity
In addition to RNAP, three transcription factors have been reported to bind site-specifically to the E. coli rRNA promoter region, Fis, Lrp, and H-NS (Ross et al. 1990; Hirvonen et al. 2001; Dame et al. 2002; Pul et al. 2007). Each has been reported to influence chromosome structure (Skoko et al. 2006; Bouffartigues et al. 2007; Hadizadeh et al. 2012), making these factors candidates for contributors to rRNA operon colocalization. However, the median distances separating rrnD and rrnG did not increase in the Δfis, Δlrp, and Δhns strains: 110, 100, and 95 nm, respectively, in the mutant strains (Fig. 5A–C) compared with 120 nm in the wild-type strain (Fig. 1F). Nevertheless, it is possible that some or all of these factors play a role in colocalization but that some degree of redundancy allows the structure to remain in the absence of some of its components.
Figure 5.
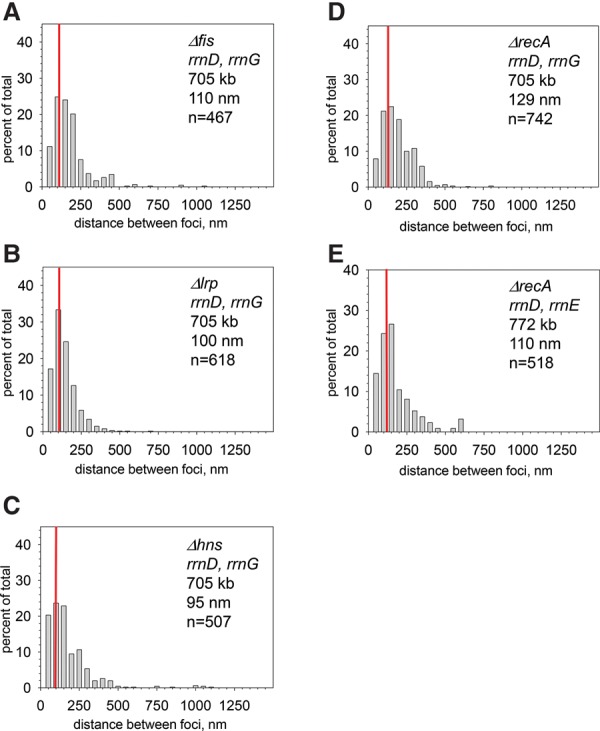
rRNA operons colocalize in strains lacking Fis, Lrp, H-NS, or RecA. Same conditions as in Figure 1 (details in Table 1). (A) rrnD, rrnG Δfis (RLG14187). Compare with Figure 1F. (B) rrnD, rrnG Δlrp (RLG14286). Compare with Figure 1F. (C) rrnD, rrnG Δhns (RLG12042). Compare with Figure 1F. (D) rrnD, rrnG ΔrecA (RLG12047). Compare with Figure 1F. (E) rrnD, rrnE ΔrecA strain (RLG12048). Compare with Supplemental Figure S2D.
RecA is not required for rRNA operon colocalization
The RecA protein is required for bringing together homologous DNA sequences for recombinational repair. As a test for a role of homologous pairing to bring the rRNA operons into close proximity, we compared the distances between two pairs of rRNA operons in cells lacking the recA locus. The median distances between rrnD and rrnG and between rrnD and rrnE were unaffected by the absence of recA (cf. 129-nm and 110-nm median separation, respectively, in Fig. 5D,E and 120 nm and 106 nm for rrnD–rrnG and rrnD–rrnE in cells containing wild-type recA in Fig. 1F; Supplemental Fig. S2). Consistent with the absence of a requirement for recA for colocalization, the rrnD promoter region colocalized with rrnG even when the rrnD structural genes were removed (Fig. 3B). Taken together, these results indicate that homologous pairing is unlikely to be responsible for bringing rRNA operons into close proximity.
Discussion
The major results reported here are as follows: (1) rRNA operons come into close proximity in live E. coli cells even though they are as much as 180° apart on the E. coli genetic map. (2) Generalizing from our results with the rrnD operon, the rrn P1 promoter region accounts for colocalization. (3) Transcription is not responsible for bringing rRNA operons into close proximity. (4) The spatial separation between non-rRNA loci generally correlates with the genetic distance between them.
Figure 6A is a cartoon depicting connections between six of the seven rRNA operons (all except rrnC). We showed experimentally by measuring the 11 different rrn–rrn pairs listed at the right of the cartoon that each of these six rRNA operons is in close proximity to at least three other rRNA operons (excluding rrnC). Because representatives of all six were included in the operons tested pairwise, we conclude that each of the six is in close proximity to the other five rRNA operons. In contrast, rrnC colocalizes only with oriC.
Figure 6.
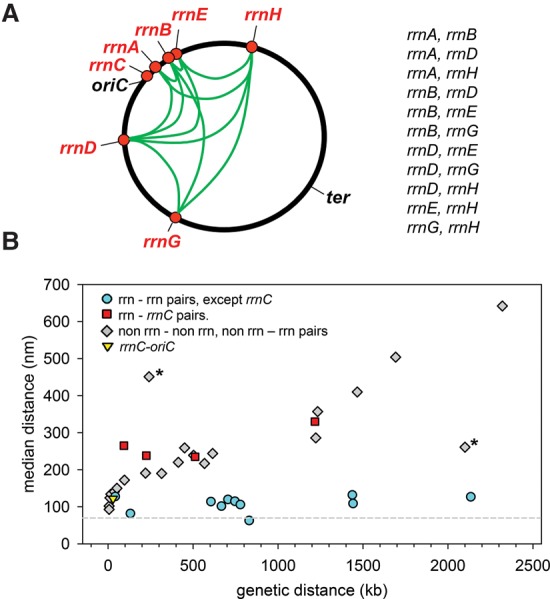
rRNA–rRNA pairs deviate from a general pattern in which physical distance between loci increases with genetic distance. (A) Cartoon depicting colocalization of rRNA operons other than rrnC. The rRNA operon pairs measured are listed at the right of the cartoon. (B) Graph showing genetic and physical distances between all locus pairs tested (Table 1). Physical distances separating locus pairs in nanometers are plotted on the Y-axis versus the genetic distances separating locus pairs in kilobases on the X-axis. (Filled cyan circles) Pairs in which both loci are rRNA operons other than rrnC; (filled red squares) rRNA operon–rrnC pairs; (filled gray diamonds) one or both members of the pair are not rRNA operons; (filled yellow triangle) rrnC–oriC. The pairs whose genetic and physical separation were less or more than their genetic separation predicted are denoted by asterisks (see the Discussion).
Four of the seven rRNA operons (rrnA, rrnB, rrnC, and rrnE) are in the Ori macrodomain (Supplemental Fig. S1A), whereas rrnD and rrnH are in the nonstructured left (NSL) and nonstructured right (NSR) macrodomains, respectively, and rrnG is in the left macrodomain (Espéli and Boccard 2006). Identification of the proteins, RNAs, and/or forces responsible for mediating colocalization of the rRNA operons could provide important insights into the formation and maintenance of macrodomains and the interactions between them.
The origin and terminus of replication divide the E. coli genome into two halves, referred to as replichores. rrnD and rrnG are in the replichore that is replicated counterclockwise, and the other five rRNA operons are in the replichore that is replicated clockwise (Dorman 2013). Our results indicate that colocalization of rRNA operons crosses not only macrodomain but also replichore boundaries. Cross-replichore interactions have also been reported in the C. crescentus (Le et al. 2013) and Bacillus subtilis (Wang et al. 2015) genomes. However, those interactions appear to be based on distance from the origin of replication rather than a shared function of the interacting gene pairs.
The spatial separation between non-rRNA loci correlates with the genetic distance between them
The discontinuity between the separation of rRNA operon pairs compared with other loci was apparent when the physical distances between loci were plotted on the Y-axis versus the genetic distances between loci on the X-axis (Fig. 6B). In contrast, the distances between non-rRNA locus pairs (or between pairs of one rRNA locus and a non-rRNA locus) generally increased with the genetic distance between them (Fig. 6B, filled gray diamonds), consistent with previous studies on C. crescentus loci (Viollier et al. 2004).
Two locus pairs deviated from the correlation between genetic and physical separation, although not nearly as dramatically as the rRNA operon pairs. arsR and λatt were closer together (261 nm) than their genetic separation (2100 kb) predicted, and rrnB and oriC were further apart (445 nm) than their genetic separation (241 kb) predicted. Although these pairs (denoted by asterisks in Fig. 6B) did not colocalize, like the rRNA locus pairs, they suggest that the correlation between genetic and physical separation of chromosomal loci is not absolute. We speculate that there could be other examples of long-distance locus-specific colocalization in addition to those involving rRNA operons.
The measured distances between foci were determined in two dimensions. However, parS sites that came close to each other in the X and Y planes potentially could have been well separated from each other on the Z-axis. We suspect that some small fraction of the foci that appeared to be close together in space could have derived from pairs that were actually well separated on the Z-axis. We also note that the lack of synchrony and the absence of normalization for cell length could have contributed to the width of the distributions; i.e., differences in the stage of the cell cycle for individual cells at the time when measurements were taken could theoretically have broadened the measured distributions.
Other models
Although a molecular description of the nucleolus-like structure is beyond the scope of this study, our results demonstrate that the rrnD P1 promoter region (and, by extrapolation, other rrn P1 promoters) is required for formation and/or maintenance of this structure even though rRNA transcription is not responsible. In previous wide-field studies using RNAP-GFP fusions, it was observed that the fluorescent RNAP foci disappeared, and RNAPs became evenly distributed when rRNA transcription was reduced or inhibited (Cabrera and Jin 2003). Similarly, inhibition of rRNA transcription in single-molecule studies resulted in more evenly distributed RNAPs (Endesfelder et al. 2013). Therefore, it was proposed that a nucleolus-like structure might be created by high numbers of RNAPs engaged in rRNA synthesis. Likewise, in theory, macromolecular crowding resulting from high amounts of rRNA transcription could bring rRNA operons into close proximity passively by sequestering them in a part of the cell where such large assemblies could be accommodated (Marenduzzo et al. 2006). Although our data do not support the conclusion that large numbers of RNAPs bring rRNA operons together in space either actively or passively, we have not ruled out a role for some other kind of entropy-driven process that leads to rRNA operon colocalization.
In theory, rRNA operon clustering could result from an overall chromosome structure that has evolved to bring the regions where the rRNA operons reside into close proximity. We do not favor this model because a parS site adjacent to the rrnD operon did not colocalize with rrnG when the rrnD P1 promoter was removed, but all other flanking regions were retained (Fig. 3).
We also do not favor the model that their strong sequence similarity brings the rRNA operons into close proximity, since colocalization was recA-independent. However, sequence homogenization between rRNA gene sequences far apart on the bacterial chromosome does imply that interactions between them can occur on evolutionary time scales (Liao 2000; Hashimoto et al. 2003).
Interactions between bacterial rRNA operons have not been detected by chromosome capture approaches that use cross-linking and next-generation sequencing to identify interactions between DNA sequences in growing cells (e.g., Cagliero et al. 2013; Dekker et al. 2013; Le et al. 2013; M Laub, pers. comm.; D Rudner, pers. comm.). However, what we refer to as close spatial proximity could still mean that the rRNA operons are as far apart as ∼100 nm in space, the resolution limit in our studies. It is possible that the rRNA operons are still too far apart physically for detection by cross-linking techniques.
Potential complex-bridging rRNA operons
As indicated above, the rrn P1 promoter region is the only cis-acting determinant required for colocalization (Fig. 3). However, our data do not prove that there are physical interactions between the rrn P1 promoter regions, only that they colocalize. They could serve as scaffolds for assembly of some large complex that physically connects the rRNA operons, or the complex could form only because the scaffolds are excluded from other locations. In either case, since colocalization occurred even in the presence of rifampicin, the complex could contain at most only one molecule of RNAP per promoter. Furthermore, the complex could not resemble an open complex, since colocalization occurred even with an rRNA promoter lacking the two most critical nucleotides in the −10 hexamer for open complex formation (Fig. 4D). Since both the RNAP-binding region in rrnD P1 and the region containing the Fis sites were required, the potential structure would most likely be a higher-order complex containing a single RNAP from each contributing promoter region and other trans-acting macromolecules that bind to, or derive from, the region near or within the Fis sites. We note that noncoding RNAs play a critical role in nucleolus assembly and function in human cells (McStay 2016). Identification of trans-acting participants responsible for colocalization remains a challenge for the future.
Materials and methods
Strain constructions
Strains are described in Table 1 and the figure legends. Constructions were based on a previously described method (Nielsen et al. 2006) in E. coli VH1000, a ΔlacZ MG1655 derivative described previously (RLG3499) (Gaal et al. 1997). Briefly, parS sites (binding sites for ParB-GFP derivatives) were inserted at the positions shown in Supplemental Figure S1 by double-stranded recombineering (Thomason et al. 2007) using the primers listed in Supplemental Table S1. DNA fragments were amplified from genomic DNA from strain RLG7419 (FHC2973) (Nielsen et al. 2006) with primer pairs containing 40–45 nt of homology with the intended chromosomal site of insertion followed by 20–22 nt of homology with the parS-kanamycin (kan) or parS-chloramphenicol (cam) antibiotic resistance cassette. Recombineering functions were induced from plasmid pSIM6 in recipient cells, DNA was introduced by electroporation, and cells were allowed to recover after electroporation in the absence of selection for 6–8 h before plating on the appropriate antibiotic (kan or cam). Purified colonies lacking the temperature-sensitive pSIM6 plasmid were obtained by growth of the selection plates at 37°C. The site of insertion was verified by PCR using primers flanking the position of insertion. In the constructs in which a parS site was adjacent to an rRNA operon, the downstream end of parS was 250–500 bp upstream of the rrn P1 transcription start site, depending on the operon (see Supplemental Table S1 for exact location).
Two different versions of parS sites and cognate ParB proteins were used: one derived from phage P1, and the other derived from plasmid PMT. parS sites were created sequentially in the same strain by recombineering before transformation with the plasmid expressing the ParB fusion proteins. The ParB fusions to CFP or YFP contained an N-terminal deletion that eliminated partition function while retaining DNA-binding activity (Nielsen et al. 2006). When the identities of the parS sites were switched so that the same rRNA operon bound the other ParB protein, the results were the same (e.g., Table 1; Fig. 1F; Supplemental Fig. S2H). The ParB fusions were coexpressed without induction from plasmid pFHC2973 (Nielsen et al. 2006). The plasmid was always kept under antibiotic selection (100 µg/mL ampicillin or carbenicillin).
Deletions of the entire rrnD operon (Fig. 3) or portions of it were created by replacing the deleted sequence with either a tetracycline resistance cassette (amplified from RLG6341) or the same kan resistance cassette described above. DNA fragments for recombineering were amplified using the primers listed in Supplemental Table S1. rrnD constructs in which the tetracycline resistance cassette replaced the structural genes also contained a kan resistance cassette upstream of the promoter region, as described above (Supplemental Table S1). When constructs were made by both methods (i.e., with a tetracycline or kan resistance cassette inserted in place of the deleted region), both constructs resulted in identical localization of the fluorescent focus.
The rrnD P1 promoter construct in which the −10 hexamer was mutated at the two most-conserved positions (Fig. 4F) was created by recombineering using a two-step procedure. Briefly, the rrnD P1 promoter (−40+1) in strain RLG11975 was replaced by the cat-sacB cassette (amplified from RLG10405=NC397) (Svenningsen et al. 2005) with selection for growth on cam, resulting in strain RLG13602. An rrnD P1 promoter fragment with two substitutions in the −10 hexamer (−40+1; TCTAAC), assembled by annealing overlapping single-stranded oligonucleotides (nontemplate strand −80+1 and template strand −40+40) and extending both strands with Sequenase (USB), was then introduced into strain RLG13602 to replace the cat-sacB cassette, with selection for growth on 5% (w/v) sucrose. The resulting strain (RLG14904) was tested for the loss of cam resistance and verified by sequencing. Primers used for these constructions are in Supplemental Table S1.
Precise deletions of the fis, lrp, hns, and recA genes (and replacement with antibiotic resistance cassettes) were created by double-stranded recombineering in the strain forming a CFP focus at rrnD and a YFP focus at rrnG using primers listed in Supplemental Table S1. In each case, a tetracycline resistance cassette replaced the gene, starting precisely at the translation initiation codon and ending with the stop codon.
Microscopy
Cells were grown overnight at 30°C with shaking in 2 mL of EZ-rich glucose defined medium (TekNova). Two-hundred microliters of the overnight culture was diluted into 10 mL of the same medium or the same medium without amino acids (defined minimal medium) and grown with aeration to OD600 ∼ 0.4, or, where indicated, cells were grown into stationary phase. Cells were spotted onto slides with agarose pads (MP Biomedicals) as described (Levin 2002). After 10–15 min, a coverslip was added, and the cells were examined immediately. As described below, the time required for completion of CFP image collection, switching the filter, and YFP image collection was ∼1 sec.
In order to visualize foci simultaneously at two chromosomal locations marked by CFP and YFP fusions, cells were examined with a Nikon TI inverted epifluorescence microscope first under visible illumination by phase contrast and then in quick succession at 480 nm and 535 nm for CFP and YFP, respectively. CFP and YFP fusions were photographed with exposure times typically of 200–400 msec, depending on the brightness of the sample. The delay between the two exposures was kept as short as possible without movement of the filter cube. The dichroic mirror used was suitable for both wavelengths, facilitating superposition. The total time required for the two exposures and changing the excitation and emission filters between exposures was ≤1 sec.
Custom-made software (available on request) running under Matlab was developed to identify cells with fluorescent foci (>95% of the cell population), calculate the centroids of the foci, and calculate the distances between the closest pairs fluorescing with different colors. Centroids were determined by fitting Gaussian curves to the fluorescent intensities and identifying the maxima. Although the software automated the selection process and the distance measurements, each of the 400–800 cells used to construct each distribution was approved manually. The median distances and the inner quartile ranges were computed using Excel. The measured distances between focus pairs were distributed into 50-nm bins for purposes of illustration using SigmaPlot. Sometimes the median (represented on the distributions by a vertical red line) appears slightly offset from the center of the distribution because of the sizes of the bins. However, the bin size is arbitrary, and this does not influence the median value of the distribution. Statistical significance of measured distances between focus pairs was determined using the Mann-Whitney U-test, which is preferable to a t-test for nonnormally distributed populations.
For time-lapse examination of individual foci, cells were imaged at intervals of 1 sec (Supplemental Fig. S3). Displacements of single fluorescent foci (from fusions with either YFP or CFP) during successive 1-sec intervals were measured and plotted as straight lines (Bakshi et al. 2013).
Supplementary Material
Acknowledgments
We thank W. Ross, J. Weisshaar, M. Laub, D. Rudner, and A. Kapanidis for comments on the manuscript; R. Dalrymple for help with Supplemental Figure S3; S.H. Hong for an initial version of the analysis software; O. Espeli, F. Boccard, D. Rudner, and M. Laub for sharing unpublished information; and F. Hansen for sharing plasmids and strains. This work was supported by National Institutes of Health R37 GM37048 to R.L.G., and undergraduate fellowships to A.V. and A.S.
Footnotes
Supplemental material is available for this article.
Article is online at http://www.genesdev.org/cgi/doi/10.1101/gad.290312.116.
References
- Bakshi S, Dalrymple RM, Li W, Choi H, Weisshaar JC. 2013. Partitioning of RNA polymerase activity in live Escherichia coli from analysis of single-molecule diffusive trajectories. Biophys J 105: 2676–2686. [DOI] [PMC free article] [PubMed] [Google Scholar]
- Bouffartigues E, Buckle M, Badaut C, Travers A, Rimsky S. 2007. H-NS cooperative binding to high-affinity sites in a regulatory element results in transcriptional silencing. Nat Struct Mol Biol 14: 441–448. [DOI] [PubMed] [Google Scholar]
- Bratton BP, Mooney RA, Weisshaar JC. 2011. Spatial distribution and diffusive motion of RNA polymerase in live Escherichia coli. J Bacteriol 193: 5138–5146. [DOI] [PMC free article] [PubMed] [Google Scholar]
- Cabrera JE, Jin DJ. 2003. The distribution of RNA polymerase in Escherichia coli is dynamic and sensitive to environmental cues. Mol Microbiol 50: 1493–1505. [DOI] [PubMed] [Google Scholar]
- Cagliero C, Grand RS, Jones MB, Jin DJ, O'Sullivan JM. 2013. Genome conformation capture reveals that the Escherichia coli chromosome is organized by replication and transcription. Nucleic Acids Res 41: 6058–6071. [DOI] [PMC free article] [PubMed] [Google Scholar]
- Dame RT, Tark-Dame M. 2016. Bacterial chromatin: converging views at different scales. Curr Opin Cell Biol 40: 60–65. [DOI] [PubMed] [Google Scholar]
- Dame RT, Wyman C, Wurm R, Wagner R, Goosen N. 2002. Structural basis for H-NS-mediated trapping of RNA polymerase in the open initiation complex at the rrnB P1 promoter. J Biol Chem 77: 2146–2150. [DOI] [PubMed] [Google Scholar]
- Dekker J, Marti-Renom MA, Mirny LA. 2013. Exploring the three-dimensional organization of genomes: interpreting chromatin interaction data. Nat Rev Genet 14: 390–403. [DOI] [PMC free article] [PubMed] [Google Scholar]
- Dorman CJ. 2013. Genome architecture and global gene regulation in bacteria: making progress towards a unified model? Nat Rev Microbiol 11: 349–355. [DOI] [PubMed] [Google Scholar]
- Endesfelder U, Finan K, Holden SJ, Cook PR, Kapanidis AN, Heilemann M. 2013. Multiscale spatial organization of RNA polymerase in Escherichia coli. Biophys J 105: 172–181. [DOI] [PMC free article] [PubMed] [Google Scholar]
- Espéli O, Boccard F. 2006. Organization of the Escherichia coli chromosome into macrodomains and its possible functional implications. J Struct Biol 156: 304–310. [DOI] [PubMed] [Google Scholar]
- Espeli O, Mercier R, Boccard F. 2008. DNA dynamics vary according to macrodomain topography in the E. coli chromosome. Mol Microbiol 68: 1418–1427. [DOI] [PubMed] [Google Scholar]
- Feklistov A, Darst SA. 2011. Structural basis for promoter-10 element recognition by the bacterial RNA polymerase σ subunit. Cell 147: 1257–1269. [DOI] [PMC free article] [PubMed] [Google Scholar]
- Feklistov A, Mekler V, Jiang Q, Westblade LF, Irschik H, Jansen R, Mustaev A, Darst SA, Ebright RH. 2008. Rifamycins do not function by allosteric modulation of binding of Mg2+ to the RNA polymerase active center. Proc Natl Acad Sci 105: 14820–14825. [DOI] [PMC free article] [PubMed] [Google Scholar]
- Fisher JK, Bourniquel A, Witz G, Weiner B, Prentiss M, Kleckner N. 2013. Four-dimensional imaging of E. coli nucleoid organization and dynamics in living cells. Cell 153: 882–895. [DOI] [PMC free article] [PubMed] [Google Scholar]
- French SL, Miller OL Jr. 1989. Transcription mapping of the Escherichia coli chromosome by electron microscopy. J Bacteriol 171: 4207–4216. [DOI] [PMC free article] [PubMed] [Google Scholar]
- Gaal T, Bartlett MS, Ross W, Turnbough CL Jr, Gourse RL. 1997. Transcription regulation by initiating NTP concentration: rRNA synthesis in bacteria. Science 278: 2092–2097. [DOI] [PubMed] [Google Scholar]
- Gotta SL, Miller OL Jr, French SL. 1991. rRNA transcription rate in Escherichia coli. J Bacteriol 173: 6647–6649. [DOI] [PMC free article] [PubMed] [Google Scholar]
- Hadizadeh YN, Guet CC, Johnson RC, Marko JF. 2012. Variation of the folding and dynamics of the Escherichia coli chromosome with growth conditions. Mol Microbiol 86: 1318–1333. [DOI] [PMC free article] [PubMed] [Google Scholar]
- Hashimoto JG, Stevenson BS, Schmidt TM. 2003. Rates and consequences of recombination between rRNA operons. J Bacteriol 5: 966–972. [DOI] [PMC free article] [PubMed] [Google Scholar]
- Hirvonen CA, Ross W, Wozniak CE, Marasco E, Anthony JR, Aiyar SE, Newburn VH, Gourse RL. 2001. Contributions of UP elements and the transcription factor FIS to expression from the seven rrn P1 promoters in Escherichia coli. J. Bacteriol 183: 6305–6314. [DOI] [PMC free article] [PubMed] [Google Scholar]
- Jin DJ, Cagliero C, Zhou YN. 2013. Role of RNA polymerase and transcription in the organization of the bacterial nucleoid. Chem Rev 113: 8662–8682. [DOI] [PMC free article] [PubMed] [Google Scholar]
- Joshi MC, Bourniquel A, Fisher J, Ho BT, Magnan D, Kleckner N, Bates D. 2011. Escherichia coli sister chromosome separation includes an abrupt global transition with concomitant release of late-splitting intersister snaps. Proc Natl Acad Sci 108: 2765–2770. [DOI] [PMC free article] [PubMed] [Google Scholar]
- Keener J, Nomura M. 1996. Regulation of ribosome biosynthesis. In Escherichia coli and Salmonella typhimurium: cellular and molecular biology. (ed. Neidhardt FC, et al. ), pp. 1417–1431. ASM Press, Washington DC. [Google Scholar]
- Le TB, Imakaev MV, Mirny LA, Laub MT. 2013. High-resolution mapping of the spatial organization of a bacterial chromosome. Science 342: 731–734. [DOI] [PMC free article] [PubMed] [Google Scholar]
- Levin PA. 2002. Light microscopy techniques for bacterial cell biology. In Methods in microbiology: molecular cellular microbiology, Vol. 31. (ed. Sansonetti P, Zychlinsky A), pp. 115–132. Academic Press Ltd, London. [Google Scholar]
- Lewis PJ, Thaker SD, Errington J. 2000. Compartmentalization of transcription and translation in Bacillus subtilis. EMBO J 19: 710–718. [DOI] [PMC free article] [PubMed] [Google Scholar]
- Liao D. 2000. Gene conversion drives within genic sequences: concerted evolution of ribosomal RNA genes in bacteria and archaea. J Mol Evol 1: 305–3017. [DOI] [PubMed] [Google Scholar]
- Marenduzzo D, Micheletti C, Cook PR. 2006. Entropy-driven genome organization. Biophys J 90: 3712–3721. [DOI] [PMC free article] [PubMed] [Google Scholar]
- McStay B. 2016. Nucleolar organizer regions: genomic ‘dark matter’ requiring illumination. Genes Dev 30: 1598–1610. [DOI] [PMC free article] [PubMed] [Google Scholar]
- Murray HD, Schneider DA, Gourse RL. 2003. Control of rRNA expression by small molecules is dynamic and nonredundant. Mol Cell 12: 125–134. [DOI] [PubMed] [Google Scholar]
- Nielsen HJ, Ottesen JR, Youngren B, Austin SJ, Hansen FG. 2006. The Escherichia coli chromosome is organized with the left and right chromosome arms in separate cell halves. Mol Microbiol 62: 331–338. [DOI] [PubMed] [Google Scholar]
- Ohlsen KL, Gralla JD. 1992. Melting during steady-state transcription of the rrnB P1 promoter in vivo and in vitro. J Bacteriol 174: 6071–6075. [DOI] [PMC free article] [PubMed] [Google Scholar]
- Paul BJ, Ross W, Gaal T, Gourse RL. 2004. rRNA transcription in Escherichia coli. Annu Rev Genet 38: 749–770. [DOI] [PubMed] [Google Scholar]
- Pederson T. 2011. The nucleolus. Cold Spring Harb Perspect Biol 3: a000638. [DOI] [PMC free article] [PubMed] [Google Scholar]
- Potrykus K, Cashel M. 2008. (p)ppGpp: still magical? Annu Rev Microbiol 62: 35–51. [DOI] [PubMed] [Google Scholar]
- Pul U, Wurm R, Wagner R. 2007. The role of LRP and H-NS in transcription regulation: involvement of synergism, allostery, and macromolecular crowding. J Mol Biol 366: 900–915. [DOI] [PubMed] [Google Scholar]
- Ross W, Thompson JF, Newlands JT, Gourse RL. 1990. E. coli Fis protein activates ribosomal RNA transcription in vitro and in vivo. EMBO J 9: 3733–3742. [DOI] [PMC free article] [PubMed] [Google Scholar]
- Ross W, Sanchez-Vazquez P, Chen AY, Lee JH, Burgos HL, Gourse RL. 2016. ppGpp binding to a site at the RNAP-DksA interface accounts for Its dramatic effects on transcription initiation during the stringent response. Mol Cell 62: 811–823. [DOI] [PMC free article] [PubMed] [Google Scholar]
- Skoko D, Yoo D, Bai H, Schnurr B, Yan J, McLeod SM, Marko JF, Johnson RC. 2006. Mechanism of chromosome compaction and looping by the Escherichia coli nucleoid protein Fis. J Mol Biol 364: 777–798. [DOI] [PMC free article] [PubMed] [Google Scholar]
- Stracy M, Lesterlin C, Garza de Leon F, Uphoff S, Zawadzki P, Kapanidis AN. 2015. Live-cell superresolution microscopy reveals the organization of RNA polymerase in the bacterial nucleoid. Proc Natl Acad Sci 112: E4390–E4399. [DOI] [PMC free article] [PubMed] [Google Scholar]
- Svenningsen SL, Costantino N, Court DL, Adhya S. 2005. On the role of Cro in prophage induction. Proc Natl Acad Sci 102: 4465–4469. [DOI] [PMC free article] [PubMed] [Google Scholar]
- Thanbichler M, Shapiro L. 2006. Chromosome organization and segregation in bacteria. J Struct Biol 156: 292–303. [DOI] [PubMed] [Google Scholar]
- Thiel A, Valens M, Vallet-Gely I, Espéli O, Boccard F. 2012. Long-range chromosome organization in E. coli: a site-specific system isolates the Ter macrodomain. PLoS Genetics 8: e1002672. [DOI] [PMC free article] [PubMed] [Google Scholar]
- Thomason L, Court DL, Bubunenko M, Costantino N, Wilson H, Datta S, Oppenheim A. 2007. Recombineering: genetic engineering in bacteria using homologous recombination. Curr Protoc Mol Biol 78: 1.16.1–1.16.24. [DOI] [PubMed] [Google Scholar]
- Viollier PH, Thanbichler M, McGrath PT, West L, Meewan M, McAdams HH, Shapiro L. 2004. Rapid and sequential movement of individual chromosomal loci to specific subcellular locations during bacterial DNA replication. Proc Natl Acad Sci 101: 9257–9262. [DOI] [PMC free article] [PubMed] [Google Scholar]
- Wang X, Rudner DZ. 2014. Spatial organization of bacterial chromosomes. Curr Opin Microbiol 22: 66–72. [DOI] [PMC free article] [PubMed] [Google Scholar]
- Wang X, Liu X, Possoz C, Sherratt DJ. 2006. The two Escherichia coli chromosome arms locate to separate cell halves. Genes Dev 20: 1727–1731. [DOI] [PMC free article] [PubMed] [Google Scholar]
- Wang X, Le TB, Lajoie BR, Dekker J, Laub MT, Rudner DZ. 2015. Condensin promotes the juxtaposition of DNA flanking its loading site in Bacillus subtilis. Genes Dev 29: 1661–1675. [DOI] [PMC free article] [PubMed] [Google Scholar]
- Wiggins PA, Cheveralls KC, Martin JS, Lintner R, Kondev J. 2010. Strong intranucleoid interactions organize the Escherichia coli chromosome into a nucleoid filament. Proc Natl Acad Sci 107: 4991–4995. [DOI] [PMC free article] [PubMed] [Google Scholar]
- Youngren B, Nielsen HJ, Jun S, Austin S. 2014. The multifork Escherichia coli chromosome is a self-duplicating and self-segregating thermodynamic ring polymer. Genes Dev 28: 71–84. [DOI] [PMC free article] [PubMed] [Google Scholar]
Associated Data
This section collects any data citations, data availability statements, or supplementary materials included in this article.