Abstract
The molecular determinants of lung cancer risk remain largely unknown. Airway epithelial cells are prone to assault by risk factors and are considered to be the primary cell type involved in the field of cancerization. To investigate risk-associated changes in the bronchial epithelium proteome that may offer new insights into the molecular pathogenesis of lung cancer, proteins were identified in the airway epithelial cells of bronchial brushing specimens from risk-stratified individuals by shotgun proteomics. Differential expression of selected proteins was validated by parallel reaction monitoring mass spectrometry in an independent set of individual bronchial brushings. We identified 2,869 proteins, of which 312 proteins demonstrated a trend in expression. Pathway analysis revealed enrichment of carbohydrate metabolic enzymes in high-risk individuals. Glucose consumption and lactate production were increased in human bronchial epithelial BEAS2B cells treated with cigarette smoke condensate for 7 months. Increased lipid biosynthetic capacity and net reductive carboxylation were revealed by metabolic flux analyses of [U-13C5] glutamine in this in vitro model, suggesting profound metabolic reprogramming in the airway epithelium of high-risk individuals. These results provide a rationale for the development of potentially new chemopreventive strategies and selection of patients for surveillance programs.
Individuals at higher risk for developing lung cancer exhibit overexpression of metabolic enzymes in the airway epithelium, suggesting metabolic reprogramming.
Introduction
It has been difficult to predict whether and when an individual might develop lung cancer, and the molecular underpinnings of the process remain poorly understood. Exposure to carcinogens, genetic predisposition, and tissue microenvironment contribute to the acquisition of multiple molecular aberrations simultaneously. Multiple efforts, including some from our laboratory, have led to the characterization of epigenetic (1, 2), genomic (3), transcriptomic (4, 5), and proteomic (6–8) changes that contribute to the tumorigenic process in the field of cancerization, the bronchial epithelium, of individuals at risk for lung cancer. However, limited information exists about the proteomic determinants of transformation of the bronchial epithelium. To investigate the mechanisms leading to the transformative events in the normal airway epithelium, we tested the hypothesis that changes at the protein level may integrate the results of many molecular battles that the epithelium is fighting to preserve homeostasis and prevent the deregulation of key and early determinants of tumor development.
Therefore, we performed an in-depth proteomic analysis of the airway epithelium using multidimensional liquid chromatography–tandem mass spectrometry (LC-MS/MS) to identify proteins that could provide new insights into the pathogenesis of lung cancer and stratify at-risk individuals. We observed proteomic changes that are consistent with the Warburg effect, previously described in tumor cells (9, 10) and recognized as a hallmark of cancer (11), occurring in the cytologically normal bronchial epithelial cells of at-risk individuals, implicating metabolic reprogramming at the earliest phases of the pathogenesis of lung cancer. Based on the results of the shotgun proteomic analysis, we validated selected candidates in an independent set of risk-stratified individual bronchial brushing specimens by parallel reaction monitoring mass spectrometry (PRM MS) (12). The PRM MS analysis demonstrated evidence of metabolic reprogramming in the airway epithelium of high-risk individuals. We validated this metabolic reprogramming in an in vitro model by exposing human bronchial epithelial cells to cigarette smoke condensate (CSC). We used stable isotope-resolved metabolomics to trace the fate of 13C from labeled glutamine in airway epithelial cells and confirmed metabolic dysregulation by metabolic flux analysis. This comprehensive study of proteomic alterations in airway epithelium in individuals at different risk for lung cancer uncovers dramatic metabolic reprogramming happening early in the pathogenesis of this lethal disease.
Results
Proteome of the bronchial airway epithelium in individuals at risk for lung cancer.
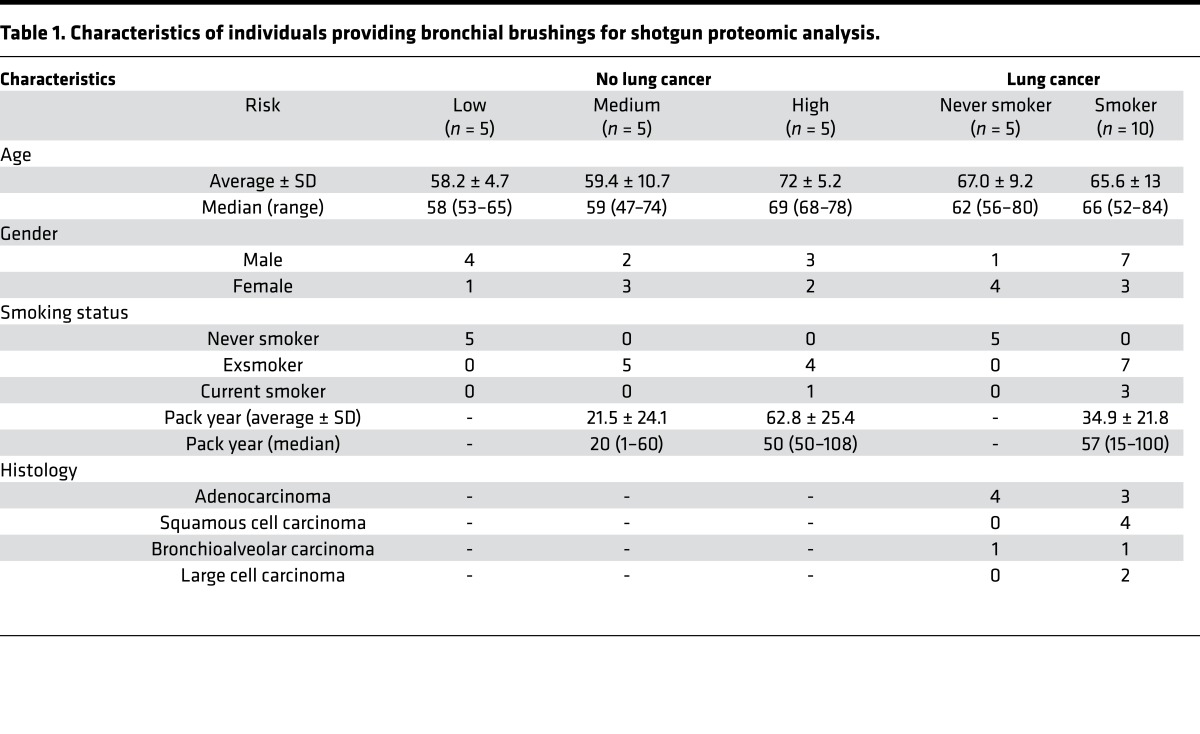
To determine the nature of the proteomic alterations associated with increasing risk for lung cancer development, we first identified 2,869 proteins in the bronchial brushing specimens of risk-stratified individuals (Table 1 and Supplemental Table 1; supplemental material available online with this article; doi:10.1172/jci.insight.88814DS1) by LC-MS/MS-based shotgun proteomic analysis (13). The data set is available through the UCSD Center for Computational Mass Spectrometry, MassIVE accession number MSV000080236, and ProteomeXchange, accession number PXD005116 (http://massive.ucsd.edu/ProteoSAFe/status.jsp?task=3a436be6beca4c47919de6a863b08f21). Three groups of five pooled bronchial brushings per group, consisting of more than 97% bronchial epithelial cells (Supplemental Figure 1) (4, 5), from individuals without lung cancer were categorized as low, medium, or high risk using a lung cancer screening risk assessment tool (14). Bronchial brushings from 5 never smokers and 10 current and exsmokers from individuals with lung cancer were also used to generate a bronchial airway proteomic data set representative of individuals with and without disease. All subsequent analyses were performed with proteomics data from individuals without lung cancer. The number of proteins identified separately in low-, medium-, and high-risk groups was 2,116, 1,949, and 2,771, respectively (Supplemental Table 2 and 3). In low-, medium-, and high-risk groups, 49%, 48%, and 61% proteins, respectively, were identified in all three technical replicates. Out of 2,869 identified proteins, 1,469 proteins were identified in all risk groups. To identify significantly dysregulated proteins among risk groups, we performed the Jonckheere-Terpstra trend test. Normalized spectral counts were used as a quantitative measure of protein abundance. There were 312 significantly dysregulated proteins (trend P < 0.05), out of which 237 demonstrated increasing trends and 75 demonstrated decreasing trends (Supplemental Table 4).
Table 1. Characteristics of individuals providing bronchial brushings for shotgun proteomic analysis.
Identification of dysregulated proteins in the airway epithelium of individuals at risk for lung cancer.
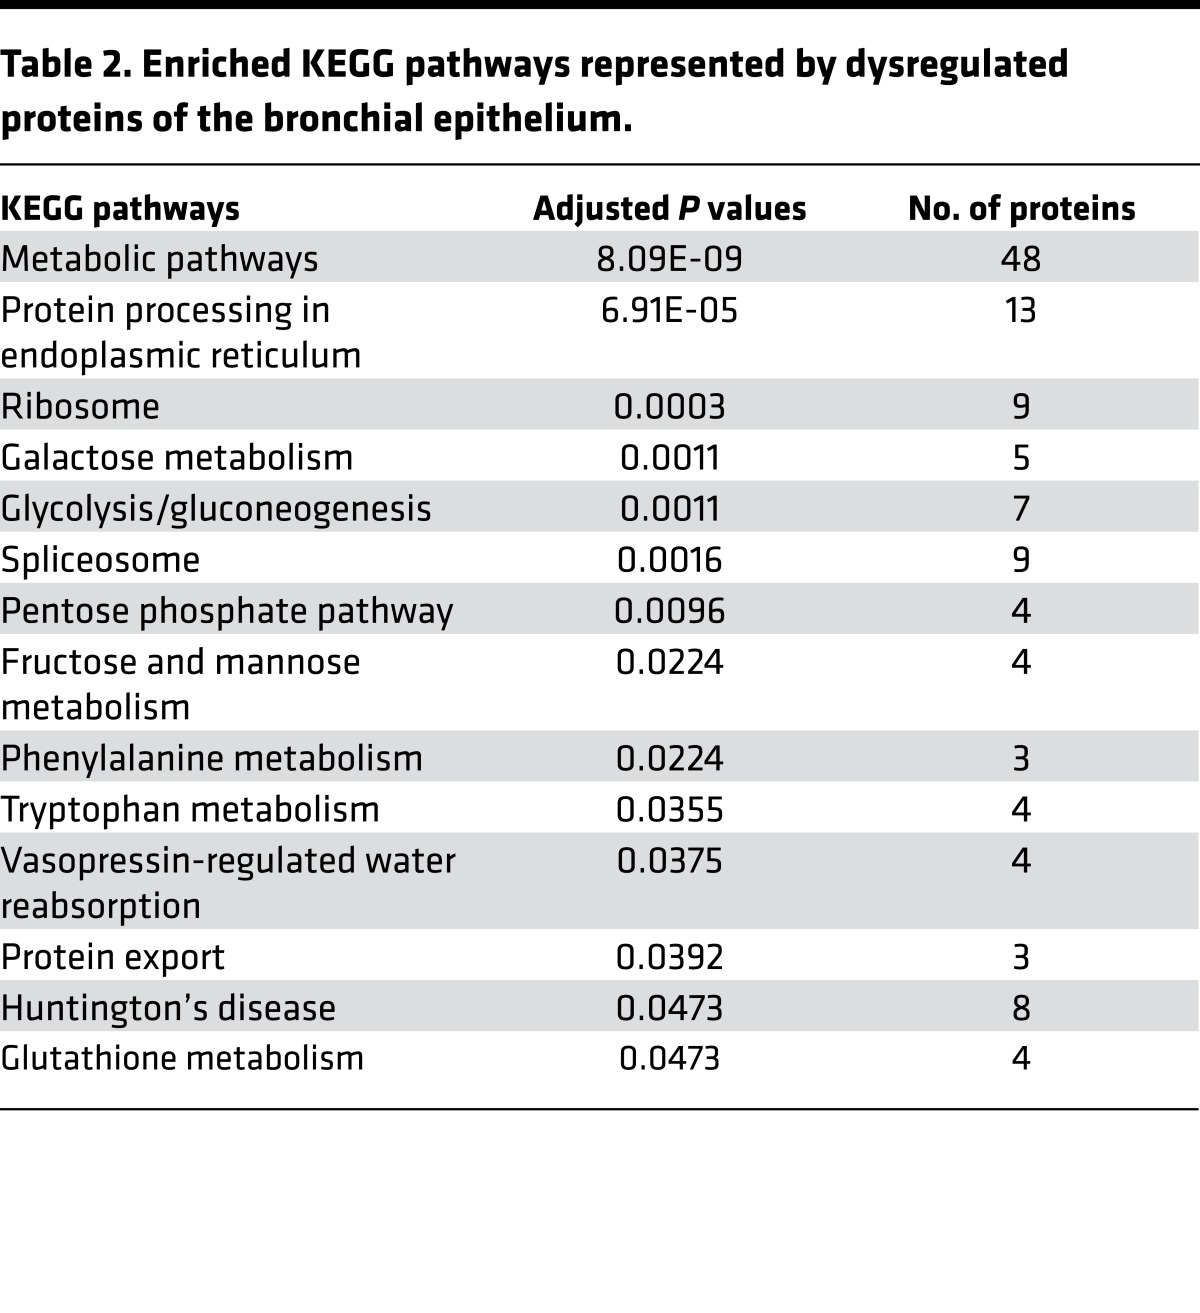
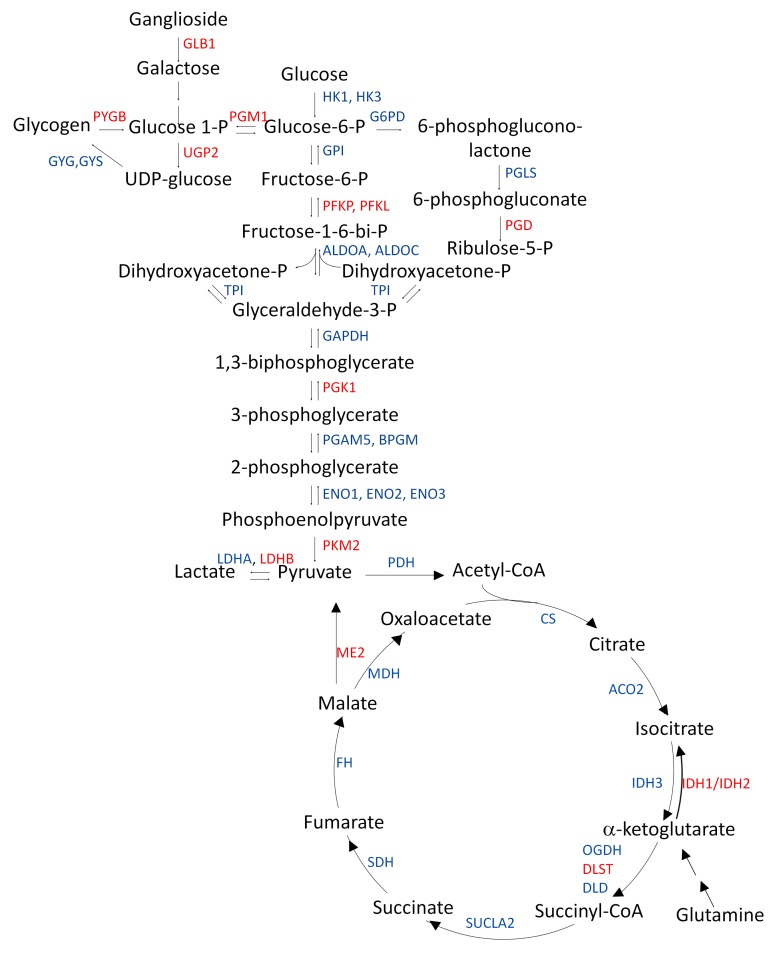
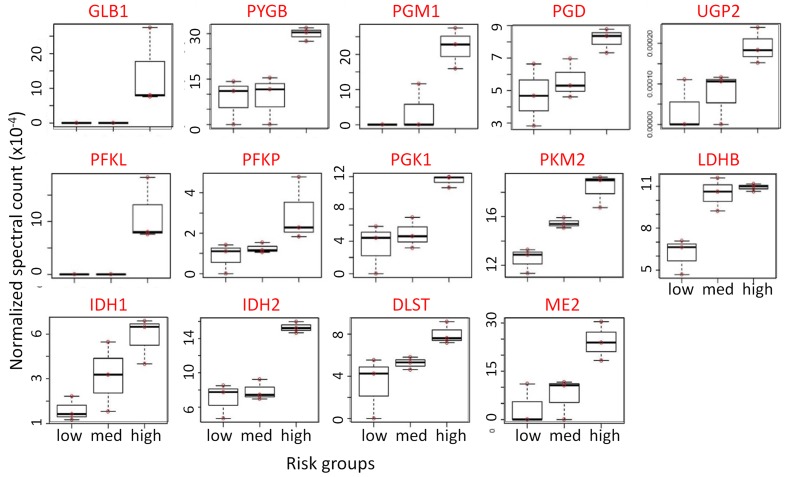
To understand the biological relevance of the alterations in the bronchial epithelium proteome, pathway analysis was performed on 312 genes corresponding to the proteins identified based on normalized spectral counts using WEB-based Gene SeT AnaLysis Toolkit (Webgestalt) (15). As shown in Table 2 and Supplemental Table 5, Kyoto Encyclopedia of Genes and Genomes (KEGG) pathway analysis with 312 dysregulated proteins revealed rewiring of multiple metabolic pathways. Interestingly, enzymes of the glycolytic pathway, TCA cycle, pentose phosphate pathway, and galactose and glycogen metabolism were overexpressed, suggesting early events of likely metabolic reprogramming in the cytologically normal bronchial epithelium of individuals at risk for lung cancer (Figure 1). Results of the trend test demonstrated significantly increasing trends of GLB1, PYGB, PGM1, PGD, UGP2, PFKL, PFKP, PGK1, PKM2, LDHB, IDH1, IDH2, DLST, and ME2 from low-risk groups to high-risk groups (Figure 2). This is the first evidence to our knowledge for a profound metabolic reprogramming in the field of cancerization that we believe represents very early molecular events in lung tumorigenesis.
Table 2. Enriched KEGG pathways represented by dysregulated proteins of the bronchial epithelium.
Figure 1. Proteomic changes in carbohydrate metabolic enzyme expression in the bronchial brushings of individuals at high risk for lung cancer.
All enzymes shown as gene symbols (blue and red) were detected by shotgun proteomic (LC-MS/MS) analysis of cytologically normal airway epithelial cells from individuals at low, medium, and high risk for lung cancer. Equal amounts of protein (20 μg) were pooled from each bronchial brushing lysate of each of the low-risk (n = 5), medium-risk (n = 5), and high-risk (n = 5) groups to create a 100-μg pooled protein lysate. Jonckheere-Terpstra trend analysis was performed with the risk groups using normalized spectral count obtained from LC-MS/MS data. Gene symbols of overexpressed enzymes are shown in red and gene symbols shown in blue are not overexpressed. Jonckheere-Terpstra trend analysis was performed with the risk groups using normalized spectral count obtained from LC-MS/MS data.
Figure 2. Overexpression of proteins regulating metabolic pathways in the airway epithelium of high-risk individuals.
Increasing trend of expression of carbohydrate metabolic enzymes in cytologically normal airway epithelial cells from low-, medium-, and high-risk groups for lung cancer. Equal amounts of protein (20 μg) were pooled from each bronchial brushing lysate of each of the low-risk (n = 5), medium-risk (n = 5), and high-risk (n = 5) groups to create a 100-μg pooled protein lysate. Jonckheere-Terpstra trend analysis was performed with the risk groups using normalized spectral count obtained from LC-MS/MS data. Top row: enzymes involved in glycogenolysis and galactose supply that feeds glucose into glycolysis and the pentose phosphate pathway. Middle row: glycolytic pathway enzymes. Bottom row: TCA cycle enzymes.
Validation of dysregulated metabolic enzymes by PRM MS in an independent set of bronchial brushings.
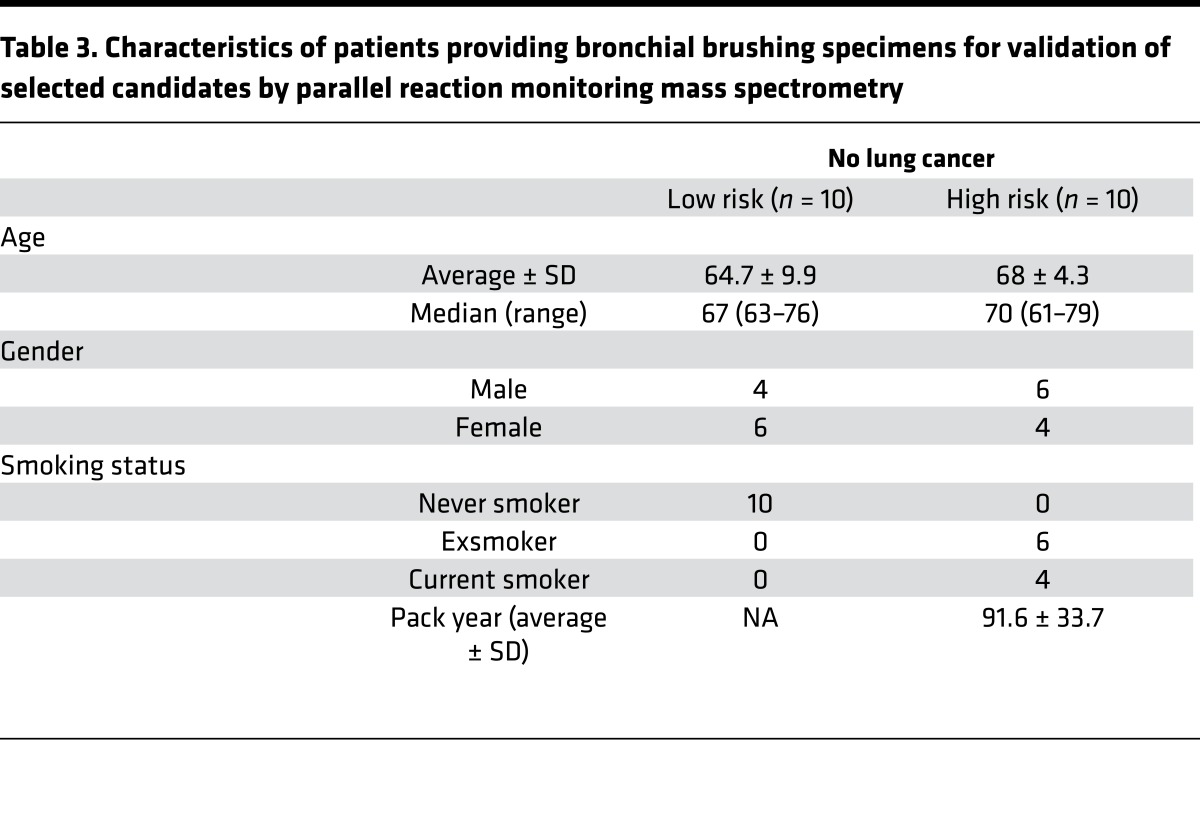
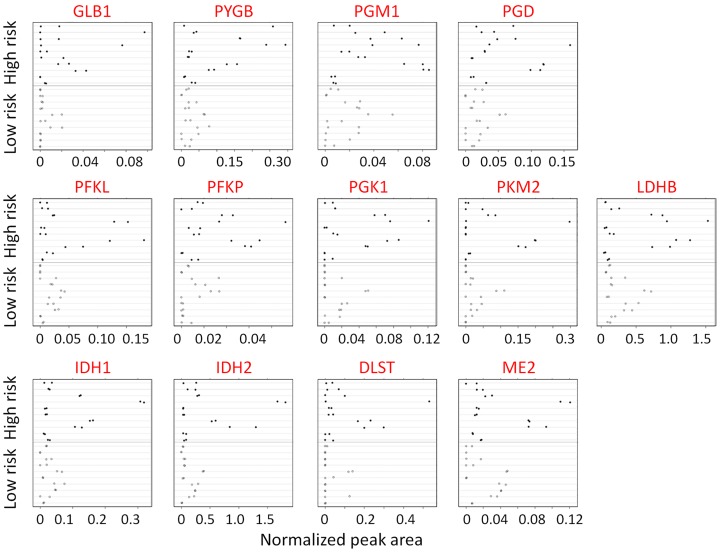
These original findings were validated in an independent set of 20 individual bronchial brushings from 10 individuals at low risk for lung cancer and from 10 individuals at high risk for lung cancer (Table 3). Of the 312 significantly dysregulated proteins, 35 were selected for validation based on the strength of the trend analysis and their biological relevance. An additional 7 enzymes, although not significantly dysregulated by shotgun proteomics, were also tested (Supplemental Table 6) because of relevance to the carbohydrate metabolic pathways. PRM MS analysis using two or more labeled peptides (12)(Supplemental Table 7) validated overexpression of PGD, GLB1, PYGB, PGM1, PFKP, and DLST in the high-risk group compared with the low-risk group (P < 0.05) (Figure 3 and Supplemental Table 8). The overexpression of IDH1, PGK1, IDH2, and PKM2 in the high-risk group was close to statistical significance. Although the expression of LDHA and G6PD did not demonstrate a significant trend in the shotgun analysis, these enzymes were substantially overexpressed in the high-risk individuals by PRM MS analysis (Supplemental Figure 2). In these cases, the biological significance perhaps outweighs the statistical significance. In addition, one of the major enzymes of fatty acid synthesis, FASN, and enzymes of nonoxidative phase of pentose phosphate pathway, TALDO and TKT, demonstrated marked overexpression in both shotgun and PRM MS analyses.
Table 3. Characteristics of patients providing bronchial brushing specimens for validation of selected candidates by parallel reaction monitoring mass spectrometry.
Figure 3. Validation of protein expression by quantitative measurements of carbohydrate metabolic enzyme expression by PRM MS in an independent set of individual bronchial brushings.
Each sample was analyzed on a Q-Exactive mass spectrometer using an acquisition method that combined a full-scan SIM event followed by 14 PRM scans. Two replicates of each specimen from low-risk individuals (n = 10) were compared with those of the high-risk individuals (n = 10). Likelihood ratio test based on mixed effect model. Top row: enzymes involved in glycogenolysis and galactose supply that feeds glucose into glycolysis and the pentose phosphate pathway. Middle row: glycolytic pathway enzymes. Bottom row: TCA cycle enzymes.
We further validated the risk-associated proteomic changes in metabolic enzymes found in our trend analysis by determining the gene expression levels of the metabolic enzymes in available transcriptomic data from airway epithelium of healthy never smokers and current smokers (4, 16) as well as smokers with and without lung cancer (17, 18). GLB1, IDH1, IDH2, and PGD were overexpressed (P < 0.05) in the cytologically normal airway epithelium of current smokers compared with never smokers. PYGB, PGM1, and UGP2 were overexpressed in the cytologically normal airway epithelium from the mainstem bronchus of smokers with lung cancer compared with smokers without lung cancer in at least one of two previously published cohorts (17, 19) (Supplemental Table 9). Taken together, these results strongly suggest alterations of the metabolic enzymes supporting aerobic glycolysis, the activation of fatty acid synthase and pentose phosphate pathway in the airway epithelium of high-risk individuals.
In vitro modeling of chronic cigarette smoke exposure in human bronchial epithelial cells and evidence for metabolic reprogramming by 13C flux analysis.
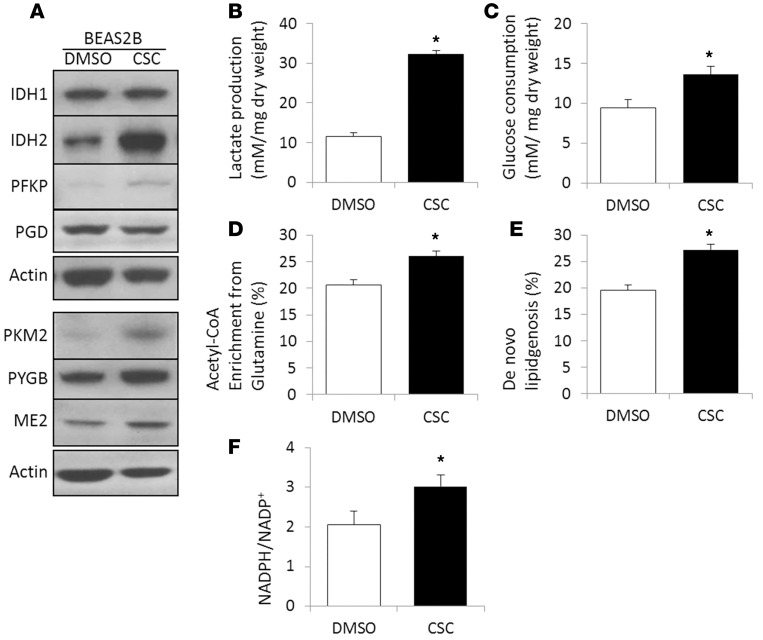
To recapitulate the metabolic reprogramming found in the airway brushings of high-risk individuals, we performed quantitative metabolic flux analysis of human bronchial epithelial cells exposed to CSC. Because long-term treatment with CSC mimics chronic tobacco smoking exposure (20), we exposed human bronchial epithelial BEAS2B cells to increasing concentrations of CSC (20 μg/ml to 120 μg/ml) for 7 months. First, overexpression of selected carbohydrate metabolic enzymes was confirmed by Western blotting. As shown in Figure 4A and Supplemental Figure 3, expression of IDH1, IDH2, ME2, PFKP, PKM2, and PYGB was upregulated in our in vitro model. Second, to investigate functional indicators of metabolic reprogramming, we measured lactate production and glucose consumption in long-term CSC-treated BEAS2B cells and observed increased lactate production and glucose uptake (Figure 4, B and C). These results indicate that metabolic reprogramming occurs in the high-risk epithelium before evidence of malignant transformation.
Figure 4. Chronic exposure of the human bronchial epithelial BEAS2B cell line to increasing concentrations (20–120 μg/ml) of CSC for 7 months in vitro induces metabolic reprogramming.
(A) Overexpression of carbohydrate metabolic enzymes by Western blotting. (B) Lactate production and (C) glucose consumption were measured by the YSI 2300 STAT Plus Analyzer. (D) Fractional acetyl-CoA enrichment and (E) the fraction of newly synthesized palmitate were determined by isotopomer spectral analysis of palmitate after 24 hours of labeling with [U-13C5] glutamine. The complete isotopolog distribution of palmitate is provided in the Supplemental Materials. (F) NADPH/NADP+ ratio measured by the NADP/NADPH-Glo assay kit (Promega). The results are represented as the mean ± SEM. CSC, cigarette smoke condensate. *P < 0.05, Student’s t test.
In addition to increased glycolytic flux, we observed increased incorporation of 13C from [U-13C5]glutamine into lipogenic acetyl-CoA and increased de novo lipogenesis by isotopomer spectral analysis (ISA) in long-term CSC-treated cells, further supporting the concept of metabolic reprogramming in the high-risk epithelium (Figure 4, D and E). Evidence of increased biosynthetic activities came from a 50% higher NADPH/NADP+ ratio measured in long-term CSC-treated cells (Figure 4F) and overexpression of NADPH-generating enzymes G6PD, PGD, MTHFD1, and IDH (Figure 2, Supplemental Table 4, and Supplemental Figure 2) in response to oxidative stress imposed by risk factors.
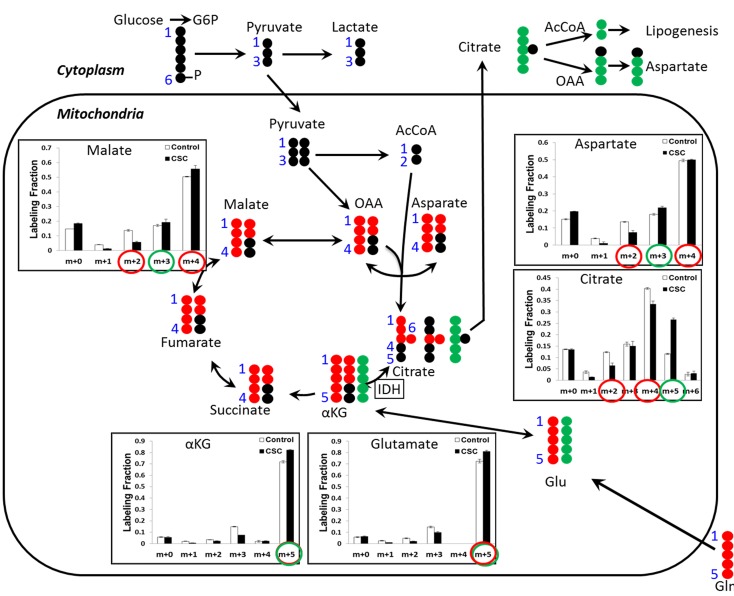
Because FASN, IDH1, and IDH2 were overexpressed in the epithelium of high-risk individuals, we hypothesized that glutamine anaplerosis may provide increased lipogenic acetyl-CoA through net reductive carboxylation flux from α-ketoglutarate into citrate and ultimately into acetyl CoA. To distinguish between glutamine metabolism via TCA cycle in the forward oxidative direction and reverse reductive carboxylation direction, we used [U-13C5]glutamine to trace the flow of glutamine carbon into citrate (Figure 5). We observed increased abundance of M+5 citrate, indicative of reductive carboxylation, and decreased abundance of M+2 and M+4 citrate, indicative of glutamine oxidation. Therefore, these observations in long-term CSC-treated BEAS2B cells demonstrate a shift from oxidative to reductive TCA cycle metabolism.
Figure 5. Evidence of increased glutamine metabolism through reductive carboxylation in response to CSC treatment.
Intracellular metabolites from DMSO- or CSC-treated BEAS2B cells cultured in dialyzed FBS were extracted, and 13C labeling from [U-13C5]-glutamine was analyzed by GC-MS. Mass isotopolog distributions of selected TCA cycle intermediates were measured after 24 hours of labeling with [U-13C5]glutamine. CSC, cigarette smoke condensate. αKG, α-ketoglutarate; OAA, oxaloacetate. The results are represented as the mean ± SEM. P < 0.05, Student’s t test.
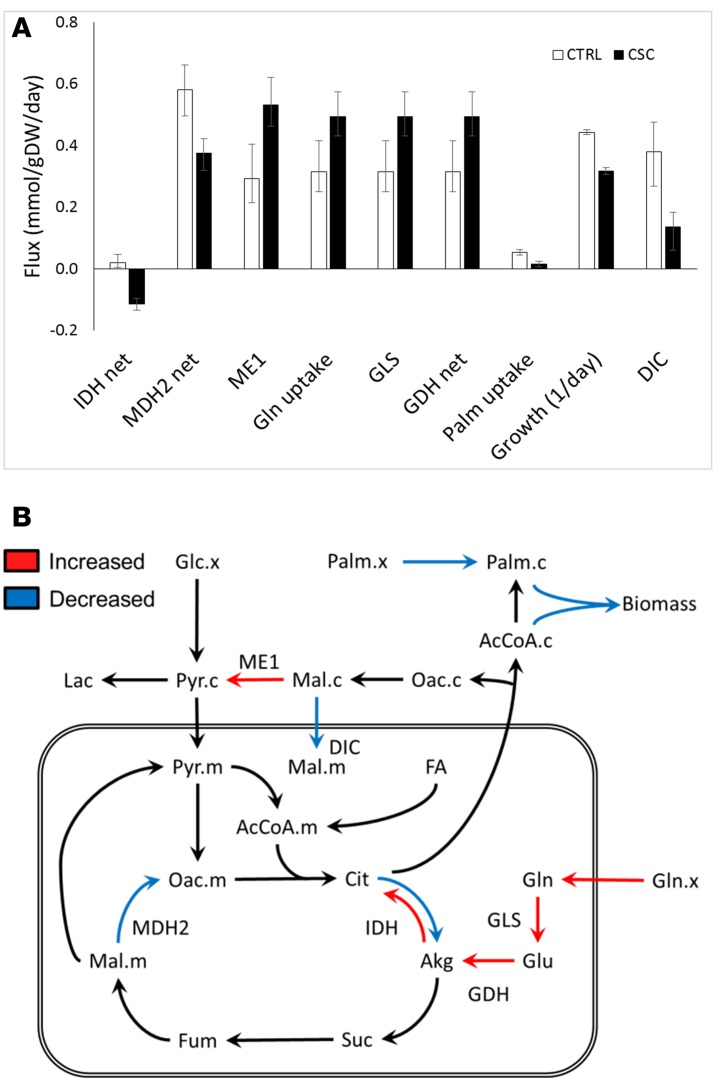
Metabolic alterations in CSC-treated BEAS2B cells were further assessed using the INCA software package (21) to enable quantitative flux analysis based on the available 13C labeling measurements. A complete reversal of the net IDH flux from the oxidative to the reductive direction was observed in CSC-treated cells (Figure 6). This switch was driven by increased glutamine consumption and a trend toward reduced pyruvate and fatty acid oxidation. Despite slower growth, CSC-treated cells synthesized palmitate at a rate similar to that of control cells. This discrepancy required the addition of an external source of cellular palmitate to the isotopomer model in order to reconcile the 13C labeling data to the measured growth rates. It is possible that the external source of palmitate could have been imported from the culture medium or recycled from storage lipids. As a result, the flux analysis indicated that a significantly higher fraction of cellular palmitate was derived from de novo lipogenesis in CSC-treated cells compared with control cells, consistent with the ISA results (Figure 4E). Finally, the analysis revealed an increase in flux through cytosolic malic enzyme (ME1) in response to CSC treatment. ME1 is a source of cytosolic NADPH, which is required for both reductive carboxylation through IDH1 and palmitate biosynthesis. Consequently, malate was diverted away from the mitochondria, and its conversion to oxaloacetate by MDH2 was also reduced. Overall, 13C flux analysis confirmed extensive reprogramming of TCA cycle and the anaplerotic and lipogenic metabolism in response to chronic CSC treatment (Figure 6).
Figure 6. Significant metabolic alterations detected by 13C flux analysis of CSC-treated cells.
(A) Metabolic fluxes were estimated using the INCA software package by regression of experimentally determined MIDs from 13C-labeling measurements and cellular growth rates. All model fits were overdetermined by 94 measurements. Flux estimation was repeated a minimum of 10 times from random initial values. Flux units are shown in units of mmol/gDW/d, except for growth rate, which is shown as 1/d. Error bars indicate 95% confidence intervals. CSC, cigarette smoke condensate; DIC, dicarboxylate ion carrier. (B) 13C metabolic flux analysis reveals metabolic reprogramming in CSC-treated cells. The red and blue arrows indicate fluxes that were significantly altered by CSC treatment relative to controls (α = 0.05). Red arrows indicate flux increases, and blue arrows indicate flux decreases. The IDH flux switched from the oxidative direction to the reductive direction in response to CSC treatment. Akg, α-ketoglutarate; Glc, glucose; FA, fatty acids; Fum, fumarate; Lac, lactate; Mal, malate; Oac, oxaloacetate; Palm, palmitate; Pyr, pyruvate; Suc, succinate. Suffixes indicate compartmentation: c, cytosolic; m, mitochondrial; x, external. Metabolites without suffixes are assumed to be present in only a single compartment or equilibrated across compartments.
Discussion
In this study, we discovered proteomic and metabolic changes in the airway epithelium at risk for developing lung cancer. Our results provide evidence for a dramatic metabolic reprogramming in the field of cancerization. The evidence is substantiated by quantitative proteomic analysis in primary airway epithelial cells and by metabolic flux studies performed in an in vitro bronchial airway epithelial cell culture model of chronic tobacco exposure. Although altered metabolism accompanies many disease states, in cancer, regulated alterations of metabolism are often a consequence of tumorigenic mutations and epigenetic alterations essential for malignant transformation (22). Yet, the timing of this metabolic reprogramming during lung cancer development remained so far elusive. The results we report here lead us to hypothesize that these metabolic derangements may contribute to the earliest molecular events involved in lung tumorigenesis. This hypothesis warrants formal testing.
This study interrogates deeply the proteome of the airway epithelium of individuals at different risk for lung cancer. As proteomics links genotype to phenotypes, this approach complements previous reports of gene expression (4, 5) and epigenetic (23) or copy number alterations (24) in this patient population. Our findings demonstrated carbohydrate and lipid metabolism reprogramming as a result of the effects of risk factors, including age, smoking history, and genetics, on the airway epithelium.
From our proteomic analysis, we performed Webgestalt pathway analysis using 312 significantly dysregulated proteins. Among the top 10 pathways enriched from KEGG analysis, carbohydrate metabolic pathways dominated the findings (Table 2) and 48 metabolic enzymes of the 312 significantly altered proteins were dysregulated in the bronchial epithelial cells (Supplemental Table 5). We validated these results in an in vitro model of long-term CSC exposure and described the occurrence of the Warburg effect in the cytologically normal bronchial epithelial cells from at-risk individuals. The overexpression of metabolic enzymes had been reported at the transcription level in the at-risk airway epithelium of smokers (4, 16). Upregulation of GLB1, PYGB, PFKL, PGK1, LDHB, IDH1, IDH2, and ME2 in smokers without lung cancer already suggested carbohydrate metabolic reprogramming in the bronchial epithelial cells. Our results provided proteomic and functional evidence for metabolic reprogramming in the field of cancerization, including increased biosynthetic ability by upregulation of the pentose phosphate pathway and lipogenic enzymes. Reprogramming of the pentose phosphate pathway was indicated by the overexpression of G6PD (Supplemental Figure 2) and PGD (Figure 2 and Supplemental Table 8), an observation that may be mediated by strong NRF2 activation (25, 26). The pentose phosphate pathway plays a role in supplying NADPH for lipid biosynthesis and nucleotide building blocks. In this study, a higher NADPH/NADP+ ratio (Figure 4F) and the overexpression of NADPH-generating enzymes PGD, MTHFD1, and IDH2 in response to oxidative stress imposed by tobacco smoke suggests an adaptive phenomenon. To maintain redox balance, the intracellular NADPH level is crucial (27, 28). NADPH production from folate metabolism, one of the major sources of NADPH in the cell, is substantiated by the overexpression of MTHFD1 (Supplemental Table 4) in the high-risk group.
To confirm and further characterize the metabolic dysregulation happening in the airway epithelium of high-risk individuals, we modeled long-term tobacco smoke exposure with CSC in vitro using human bronchial epithelial BEAS2B cells and measured lactate and glucose concentrations in culture supernatant after 24 hours. Significantly enhanced lactate production and glucose consumption in CSC-treated cells in vitro raises questions about the possible role of carbohydrate metabolic enzymes in lung cancer development (Figure 4, B and C). Overexpression of glycolytic enzymes, including LDH, PFKP, and PKM2, in these cells indicates a phenomenon consistent with the Warburg effect. Moreover, the potential of glycogen and ganglioside as possible sources of glucose in high-risk individuals is supported by the overexpression of GLB1, PGM1, and PYGB, which produces glucose-6-phosphate to feed into the glycolytic pathway. Previously, we reported significant activation of the phosphoinositide 3-kinase signaling pathway in a genomic signature of cytologically normal airway epithelial cells (29), and regulation of multiple steps of glycolysis by Akt was reported earlier (30). Whether these metabolic changes have any causative effect on the transformation of normal bronchial epithelial cells to dysplastic and finally malignant cells, as Otto Warburg postulated more than half century ago (9, 10), remains to elucidated.
Our observations were not limited to carbohydrate metabolism. We found that overexpression of ME2 catalyzes the conversion of malate, a TCA cycle intermediate, to pyruvate. Overexpression of ME2 thus may assist the fatty acid biosynthetic pathway in obtaining pyruvate and acetyl-CoA. Furthermore, overexpression of the key lipogenic enzyme FASN in this study, as shown by shotgun proteomics analysis (Supplemental Table 4) and by PRM MS (Supplemental Figure 2), corroborates the upregulation of lipid biosynthetic pathways. Overexpression of alcohol and aldehyde metabolic enzymes ALDH1A1, ALDH3A1, and AKR1B10 in lung tumor tissues was reported by our group and other investigators (31, 32). In this study, these enzymes were overexpressed in the cytologically normal bronchial epithelium of individuals at-risk for lung cancer (Supplemental Figure 2 and Supplemental Table 4). Previously, we also reported overexpression of acyl-CoA-binding protein/diazepam binding inhibitor in lung cancer tissues, indicating perturbation of lipid metabolism in lung cancer (7, 33).
Finally, we applied stable isotope-resolved metabolomics to trace the fate of 13C from uniformly labeled glutamine in airway epithelial cells exposed to chronic CSC or control treatments. Rewiring of glutamine utilization in response to CSC treatment was demonstrated by increased incorporation of glutamine carbon into citrate and lipogenic acetyl-CoA, concomitant with overexpression of IDH, suggesting a shift from oxidative to reductive TCA cycle metabolism. This shift was most strongly evidenced by the increased abundance of M+5 citrate and decreased abundances of M+2 and M+4 citrate isotopologs (Figure 5). It is important to note that M+5 citrate must have been derived from M+5 glutamine, rather than condensation of M+1 acetyl-CoA with M+4 oxaloacetate, since the palmitate mass isotopolog distribution (MID) indicates that the vast majority of labeled acetyl-CoA was M+2 enriched (Supplemental Excel File 1).
Without performing quantitative flux analysis, it is difficult to distinguish reversible IDH flux from net reductive carboxylation flux based on citrate and palmitate labeling measurements alone (34). Therefore, we applied a comprehensive isotopomer model to regress fluxes from the experimentally determined MIDs and cellular growth rates. This analysis confirmed that the net IDH flux switched from the oxidative to the reductive direction in response to CSC treatment of BEAS2B cells (Figure 6). The flux modeling also revealed that CSC-treated cells relied on de novo lipogenesis to supply nearly all of the palmitate required for new cell growth, whereas control-treated cells relied heavily on preexisting (i.e., unlabeled) sources of palmitate that were presumably scavenged from the medium or from internal lipid stores (Figure 6). These findings further support the conclusion that reprogramming of glutamine metabolism plays a specific role in fueling enhanced lipid biosynthesis by these cells.
It is significant that the proteomic analysis indicated overexpression of both IDH1 (cytosolic) and IDH2 (mitochondrial) isoforms in at-risk patients, which correlates with the shift to reductive carboxylation observed in the in vitro study. However, it was not possible to resolve the individual contributions of IDH1/2 enzymes to the net IDH flux estimated by isotopomer modeling without including additional assumptions that either (a) restrict the directionality of the IDH1 or IDH2 flux or (b) enforce directional channeling of citrate between cytosol and mitochondria (e.g., as proposed by Jiang et al., ref. 35). Therefore, the reported IDH flux represents the net contribution of both mitochondrial and cytosolic isoforms. The isotopomer model also did not explicitly balance NADPH, since not all sources/sinks of NADPH could be resolved using the available measurements. We were therefore unable to rigorously identify the source of NADPH that fueled reductive IDH flux in CSC-treated cells. It is possible that ME1 or G6PD/6PGD enzymes could supply cytosolic NADPH required to drive the IDH1 reaction toward isocitrate (35). This hypothesis is consistent with the increase in ME1 flux observed in CSC-treated cells (Figure 6) and the increases in expression of pentose phosphate pathway enzymes identified in at-risk patients. Alternatively, ME2 could supply mitochondrial NADPH to drive the IDH2 reaction toward isocitrate, but this flux was only slightly elevated in CSC-treated cells. It is important to note that the magnitudes of both ME1 and ME2 fluxes were larger than the net reductive IDH flux observed in CSC-treated cells, so either enzyme could potentially provide the stoichiometric amounts of NADPH required to fuel reductive carboxylation in this context.
The proteomic study also has limitations. The proteome of the large airway epithelium of risk-stratified individuals was compared between high and low risk based on a risk assessment tool that is imperfect, with an overall accuracy around 75% (14). The data set was generated by LC-MS/MS shotgun proteomics by combining equal amounts of protein from 5 bronchial brushings, a methodological requirement, given the small amount of protein obtained from each bronchial brushing specimen. However, we were able to validate our results by PRM MS in an independent set of individual bronchial brushings from participants from our cohort with matched risk assessment. Finally, in this paper, we have not demonstrated evidence that metabolic reprogramming is associated with tumor development, but we are raising this provocative hypothesis in a prospective cohort of high-risk individuals. In conclusion, we discovered multiple aspects of metabolic reprogramming in cytologically normal bronchial epithelial cells obtained from the bronchial brushings of individuals at risk for lung cancer development by in-depth and quantitative proteomic analysis. This large-scale proteomic identification from a complex sample, such as the bronchial brushings obtained noninvasively, brings key mechanistic insights into lung cancer pathogenesis. We postulate that the monitoring of a proteomic signature of metabolic enzymes may narrow down at-risk individuals who are more likely to develop lung cancer and benefit from screening and surveillance programs.
Methods
Study population and collection of bronchial brushing specimens.
Bronchial brushing specimens were collected at the time of bronchoscopy from the main stem bronchus of consented nonsmoking and smoking volunteers at various risks for lung cancer at the Vanderbilt University Medical Center and the Nashville Veteran Affairs Medical Center. Individuals providing bronchial brushing specimens were grouped as low-, medium-, and high-risk groups, each group consisting of 5 individuals, by use of a lung cancer screening tool (14). Never smokers were categorized as low risk, smokers with less than 5% risk of developing lung cancer at 10 years and without chronic obstructive pulmonary disease were categorized as medium risk, while those with more than 5% risk were considered high-risk individuals. Characteristics of the individuals of each group are shown in Table 1 and those of individual subjects in Supplemental Table 1.
Bronchial epithelial cells were obtained by brushings (Bronchoscopy cytology brush, Cook Medical) and collected in normal saline on ice following an established protocol (5). Bronchial brushings cells were centrifuged at 300 g for 5 minutes. Cell pellets were stored in a –80oC freezer after removing supernatant. Bronchial brushings consisted of over 97% normal bronchial epithelial cells in our specimens (Supplemental Figure 1) and those by others (4, 5).
Bronchial brushings were suspended in 200 μl of 50% 2,2,2-trifluoroethanol (Acros Organics) and 50% 50 mM ammonium bicarbonate (Fisher Scientific) (v/v) and homogenized using sonication with three 20-second cycles at 30-second intervals, followed by incubation at 60°C for 1 hour with shaking. After the 1-hour incubation, the sonication cycle was repeated. After the second sonication cycle, the protein concentration was measured using the BCA protein assay (Pierce Biotechnology). Each group was pooled by taking 20 μg from each of the 5 bronchial brushing specimens to create a 100-μg pooled protein lysate. The pooled lysates were reduced with 100 μl of 40 mM tris (2-carboxyethyl) phosphine hydrochloride (Pierce Biotechnology) with 100 mM dithiothreitol (Acros Organics) and incubated at 60°C for 30 minutes with shaking. After cooling, 100 μl of 200 mM iodoacetamide was added and incubated for 20 minutes at room temperature in the dark. Samples were diluted with 600 μl of 50 mM ammonium bicarbonate, and trypsin was added at a ratio of 1:50 (w/w) and digested at 37°C overnight. The resulting peptide mixtures were lyophilized. The lyophilized samples were resuspended in 350 μl of HPLC-grade water, vortexed vigorously for 1 minute, and desalted using Oasis HLB 96-well Elution plates (30 μm, 5 mg, Waters Corp.), which were prewashed with 500 μl of acetonitrile and equilibrated with 750 μl of HPLC-grade water. The flow-through was discarded, the plates were washed with 500 μl of HPLC-grade water, and the peptides were eluted with 80% acetonitrile and dried in vacuo. Samples were stored in the freezer until further analysis.
Peptide fractionation by isoelectric focusing.
Isoelectric focusing of tryptic peptides was adapted from the method of Cargile et al. (36). Tryptic peptides (100 μg) from the digest cell pellet were resuspended in 155 μl of 6 M urea and loaded onto custom ordered 7-cm, pH 3.5–4.5 ZOOM pH Strips (Invitrogen), placed into a ZOOM cassette, and allowed to rehydrate for 1 hour at room temperature. The loaded strips were focused at 21°C on a ZOOM IPG Runner system (Invitrogen) using the following program: step at 175 V for 15 minutes; gradient to 2,000 V over 45 minutes; and held at 2,000 V for 105 minutes. The strips were cut into 15 pieces and placed in separate wells of a 96-well ELISA plate. Peptides were eluted from the strips as follows: 200 μl of 0.1% formic acid for 15 minutes; 200 μl of 50% acetonitrile/0.1% formic acid for 15 minutes; 200 μl of 100% acetonitrile/0.1% formic acid for 15 minutes. Solutions of extracted peptides were combined and evaporated in vacuo, resuspended in 750 μl of 0.1% trifluoroacetic acid, desalted with the Oasis HLB 96-well Elution plates, HLB 96-well 30-μm Elution plates (Waters Corp.), and evaporated in vacuo with a SpeedVac sample concentrator (Thermo Fisher Scientific). Peptides were resuspended in 100 μl of 0.1% formic acid and placed in sample vials prior to LC-MS/MS analysis.
LC-MS/MS analysis.
Peptide fractions were analyzed on a Thermo LTQ XL ion trap mass spectrometer (Thermo Fisher Scientific) equipped with an Eksigent 1D Plus nanoLC pump and AS-1 (SCIEX). A 2-μl injection volume of peptides was separated on a packed capillary tip (Polymicro Technologies, 100 μm × 11 cm) containing Jupiter C18 resin (5 μm, 300 Å, Phenomenex) using an in-line solid-phase extraction column (100 μm × 6 cm) packed with the same C18 resin (using a frit generated with liquid silicate Kasil 1). Mobile phase A consists of 0.1 % formic acid, and mobile phase B consisted of 0.1% formic acid in acetonitrile. A 95-minute gradient was performed with a 15-minute washing period (100 % A) at a flow-rate of 1.5 μl/min to remove residual salt. Following the washing period, the gradient was increased to 25% B by 50 minutes, followed by an increase to 90 % B by 65 minutes, and held for 9 minutes, before being returned to the initial conditions Tandem spectra were acquired using a data-dependent scanning mode in which one full MS scan (m/z 400–2,000) was followed by 5 MS/MS scans. MS/MS scans were acquired in centroid mode using an isolation width of 3 m/z, an activation time of 30 ms, an activation q of 0.250, and 35 % normalized collision energy. One microscan with a maximum ion time of 100 ms and 1,000 ms was used for each MS/MS and full MS scan, respectively. MS/MS spectra were collected using a dynamic exclusion of 60 seconds with a repeat of 1 and repeat duration of 1.
Database searching and statistical analysis of spectral counts.
Tandem spectra were searched against the human RefSeq (release 59; Aug 2010) using the Myrimatch database search algorithm (v 2.1.111) and Pepitome (v 1.0.42) for the spectral library searches (37). The database incorporated both the forward and reversed sequences to allow for determination of FDRs. The searches were performed allowing for static modifications of +57 Da on cysteines (for carbamidomethylation from iodoacetamide) and dynamic modifications of +16 Da on methionines and formation of N-terminal pyroglutamine (-17 Da). Semitryptic peptides were considered in the search parameters. Peptide and fragment ion tolerances were set to ±1.25 m/z and 0.5 Da, respectively. The data were filtered and assembled with the IDPicker algorithm (v. 3.0.460) at 5% peptide FDR, requiring at least two unique peptides (minimum peptide length of 7 amino acids) and 10 spectra per protein in the entire data set (38). These settings resulted in an overall protein FDR of 5%. Spectral count differences between the different risk groups were determined using quasi-likelihood modeling requiring a FDR value of < 0.05 and at least a 4-fold change in spectral counts (39).
Sample preparation for PRM MS.
Ten individual bronchial brushing specimens from each of the low-risk and high-risk groups of an independent set (Table 3) were digested and analyzed by PRM MS for the candidate proteins listed in Supplemental Table 6. Following the same digestion protocol used for the shotgun analysis, each sample was reconstituted to a stock concentration of 1 μg/μl with 0.1% formic acid following digestion and desalting. Prior to analysis, each sample was diluted with an equal volume of 10 fmol/μl of the labeled reference peptide mixture containing three isotopically labeled peptides used for signal normalization (40). The final concentration of the samples was 0.5 μg/ μl and 5 fmol/μl labeled reference peptide.
Liquid chromatography separation.
All peptide separations were performed using an Easy nLC-1000 pump and autosampler system (SCIEX). For each analysis, 2 μl of each sample was injected and loaded onto a PicoFrit capillary column (New Objective, 11 cm × 75 μm) packed in-house with ReproSil-Pur C18 AQ 3-μm resin (New Objective). The peptides were separated using a linear gradient of 2%–35% solvent B (0.1% formic acid in acetonitrile) at a flow rate of 300 nl/min over 40 minutes, followed by an increase to 90% B over 4 minutes and holding at 90% B for 6 minutes before returning to initial conditions of 2% B.
Analyses on a quadrupole-orbitrap instrument.
PRM analyses were performed on a Q-Exactive mass spectrometer (Thermo Fisher Scientific). For ionization, 1,800 V was applied and a 250°C capillary temperature was used. Each sample was analyzed using an acquisition method that combined a full-scan SIM event followed by 14 PRM scans, as triggered by a scheduled inclusion list, with a 4-minute retention time window, containing the precursor ions representing target peptides. The SIM scan event was collected using a m/z 380–1,500 mass selection, an Orbitrap resolution of 17,500 (at m/z 200), a target automatic gain control (AGC) value of 3 × 10⁶, and a maximum injection time of 30 ms. The PRM scan events used an orbitrap resolution of 17,500, an AGC value of 1 × 10⁶, and maximum fill time of 80 ms, with an isolation width of 2 m/z. Fragmentation was performed with a normalized collision energy of 27 eV, and MS/MS scans were acquired with a starting mass of m/z 150.
Data processing.
PRM data analysis was performed using the Skyline software. (41)
Cell culture.
Human bronchial epithelium cell line BEAS2B (ATCC) was maintained in DMEM medium (Fisher Scientific) containing 10% heat-inactivated FBS (Fisher Scientific, catalog 16140071) at 37°C, 100% humidity, and 5% CO2. Cells were tested every 6 months for mycoplasma using the PCR-based MycoAlert PLUS Mycoplasma Detection Kit (Lonza). Cells were treated with increasing concentrations (20–200 μg/ml) of CSC for 7 months in vitro. After 7 months treatment, the expressions of target proteins were tested by Western blotting.
Western blotting.
Cell lysates were prepared using methods described previously (7). Proteins (30 μg per sample) were separated on 4%–20% tris-glycine gels (Fisher Scientific) and transferred to PVDF membranes (Fisher Scientific). The membranes were incubated in Blocker Casein (Thermo Fisher Scientific) primary (1:1,000) and secondary antibodies (1:10,000) as described previously (7). Anti-rabbit and anti-mouse secondary antibodies were purchased from Promega. Primary antibodies used were as follows: IDH1 (clone D2H1, catalog 8137, Cell Signaling), IDH2 (clone D7H6Q, catalog 12652, Cell Signaling), ME2 (rabbit polyclonal, catalog 12399, Cell Signaling), PGD (clone EPR6565, catalog ab129199, abcam), PFKP (rabbit polyclonal, catalog ab118712, abcam), PKM2 (sheep polyclonal, catalog AF7244, R&D Systems), and PYGB (rabbit polyclonal, catalog 12075-1-AP, Proteintech). Blots were visualized with Western Lighting (PerkinElmer). The blots were reprobed with an anti-β actin antibody to correct for protein loading differences. Densitometry data of the bands using ImageJ (NIH) were obtained.
Lactate production and glucose consumption measurement.
Two million BEAS2B cells were seeded in each of the six 10-cm petri dishes. On day 0, the cells were treated with either CSC (Murty Pharmaceuticals Inc.) or DMSO (Sigma-Aldrich) in triplicate, and 1 ml media were collected from each dish after 24 hours. Glucose consumption and lactate production were measured with a dual glucose/lactate analyzer (2300 STAT Plus Glucose and Lactate Analyzer, YSI Life Sciences). Data were normalized to the total protein.
NADPH/NADP measurement.
BEAS2B cells cultured for 7 months with and without CSC were plated (10,000/well) in 50 μl culture medium in a clear bottom black 96-well plate. Cells were lysed in 50 μl base solution with 1% dodecyltrimethyl ammonium bromide (Sigma-Aldrich). For NADP+ measurement, 25 μl 0.4 N HCl was added to each well. The plate was heated at 60°C for 15 minutes. To each well treated with acid, 25 μl Trizma base was added, and to each well without acid treatment, 50 μl HCl/Trizma solution was added. Thereafter, 50 μl NADP/NADPH-Glo detection reagent (Promega) was added to each well, and the plate was incubated for 60 minutes at room temperature. Luminescence was recorded using a luminometer (Promega).
Metabolite extraction and gas chromatography–mass spectrometry analysis of 13C labeling.
The extraction of intracellular metabolites from DMSO- or CSC-treated BEAS2B cells cultured in dialyzed FBS (Sigma-Aldrich) and gas chromatography–mass spectrometry (GC-MS) analysis of 13C labeling from [U-13C5]-glutamine (Cambridge Isotope Laboratories) were performed as described previously (42). Briefly, cell metabolism was quenched by adding 1 ml of precooled methanol (−80°C) to cultured cells in 10-cm dishes. A biphasic extraction was used to separate polar metabolites into a methanol/water phase and lipid metabolites into a chloroform phase. The extraction results in mixing of free metabolites from separate subcellular compartments. Polar metabolites were converted to their tertbutylsilyl derivatives using MBTSTFA + 1% TBDMCS (Thermo Fisher Scientific) (43). Nonpolar extracts were converted to fatty acid methyl esters as described previously (43). Then, 1 μl of each derivatized sample was injected into GC-MS (Agilent 7890A/5975C) equipped with a 30 m HP-5 MS capillary column for analysis of isotopic enrichment. Raw MIDs were corrected for natural isotope abundance as described by Fernandez et al. (44). ISA was used to calculate fractional enrichment of acetyl-CoA and fractional lipid synthesis based on palmitate labeling measurements, as described by Ahn and Antoniewicz (45).
13C metabolic flux analysis.
An isotopomer model was constructed using the INCA software package (21) to enable flux regression from 13C-labeling measurements. The model was based on the work of Vacanti et al. (46). The model provides a detailed description of TCA cycle and anaplerotic and lipogenic pathways but does not attempt to accurately resolve fluxes in glycolysis or pentose phosphate pathways due to limited measurement availability. The complete reaction network and a list of underlying assumptions are provided in the Supplemental Materials. Metabolic fluxes were estimated by regression of experimentally determined MIDs and cellular growth rates. All model fits were overdetermined by 94 measurements. Flux estimation was repeated a minimum of 10 times from random initial values to ensure a global minimum was obtained. All results were subjected to a χ2 statistical test to assess goodness of fit, and accurate 95% confidence intervals were computed for all flux parameters by evaluating the sensitivity of the sum-of-squared residuals to parameter variations (47).
Statistics.
To identify potential protein features from shotgun proteomic data, the Jonckheere-Terpstra trend test (48) was applied to detect monotone trends (either increasing or decreasing) among low-risk, medium-risk, and high-risk groups. Furthermore, to compare the expression difference between the low-risk group and the high-risk group for some candidate proteins identified from the trend analysis, likelihood ratio test based on mixed effect model (49) was applied to correctly handle the correlation structure of the PRM data, which have two repeated measurements for each sample. For both trend test and likelihood ratio test, the FDR controlling procedure was adapted to handle the multiple comparisons issue when testing many proteins simultaneously. Cellular metabolites were compared using the 2-tailed Student’s t test. The results are represented as the mean ± SEM. Differences with P < 0.05 were considered statistically significant. Differences in 13C flux estimates were considered significant when the 95% confidence intervals from two experimental groups failed to overlap.
Study approval.
Bronchial brushing specimens were collected at the time of bronchoscopy from the main stem bronchus of consented nonsmoking and smoking volunteers at the Vanderbilt University Medical Center and the Nashville Veteran Affairs Medical Center. The study was approved by the local institutional review board (Vanderbilt University Medical Center and Veterans Affairs, Tennessee Valley Healthcare System, Nashville, Tennessee Institutional Review Boards), and informed consent was obtained from all individuals at both institutions.
Author contributions
SMJR and PPM conceived and designed the study. SMJR, XJ, LJZ, BKH, MDH, IAT, YZ, and JB performed the experiments and acquired data. SMJR, XJ, LJZ, ML, JQ, RJCS, JB, AS, YS, JDY, DCL, and PPM analyzed and interpreted the data and wrote and reviewed the manuscript. RE reviewed the pathological materials. SMJR and PPM supervised the study.
Supplementary Material
Acknowledgments
This study was supported by the National Institutes of Health (R01CA102353, U01CA152662, and Lung SPORE P50CA90949 to PPM; U01CA152647 to DCL), the Department of Defense (W81XWH-11-2-0161 and CDMRP LC090615P3 to PPM; W81XWH-12-1-0383 to JDY), and the Flight Attendant Medical Research Institute Foundation (YFEL141014 to XJ). We thank Dawn Overstreet and Nancy Winters for their help with sample preparation and MS analysis. We thank Anel Muterspaugh, Sanja Antic, Rena Burns, Priyanka Banerjee, and Brian Colon for their efforts to enroll volunteers and manage the tissue biorepository and clinical information. We thank David Tabb and Bing Zhang for helpful discussions.
Footnotes
ML’s present address is: Center for Proteomics and Bioinformatics, Department of Epidemiology and Biostatistics, School of Medicine, Case Western Reserve University, Cleveland, Ohio, USA.
RJCS’s present address is: Moffitt Cancer Center, Clinical Science Lab, Tampa, Florida, USA.
Conflict of interest: The authors have declared that no conflict of interest exists.
Reference information:JCI Insight. 2016;1(19):e88814. doi:10.1172/jci.insight.88814.
Contributor Information
S.M. Jamshedur Rahman, Email: j.rahman@vanderbilt.edu.
Xiangming Ji, Email: xiangming.ji@vanderbilt.edu.
Ming Li, Email: mxl675@case.edu.
Yong Zou, Email: yong.zou@vanderbilt.edu.
Jun Qian, Email: jun.qian@vanderbilt.edu.
Robbert J.C. Slebos, Email: robbert.slebos@moffitt.org.
Jennifer Beane, Email: jbeane77@gmail.com.
Avrum Spira, Email: aspira@bu.edu.
Yu Shyr, Email: yu.shyr@Vanderbilt.Edu.
Rosana Eisenberg, Email: rosana.eisenberg@Vanderbilt.Edu.
Daniel C. Liebler, Email: daniel.liebler@vanderbilt.edu.
References
- 1.Leng S, et al. 15q12 variants, sputum gene promoter hypermethylation, and lung cancer risk: a GWAS in smokers. J Natl Cancer Inst. 2015;107(5) doi: 10.1093/jnci/djv035. [DOI] [PMC free article] [PubMed] [Google Scholar]
- 2.Xi S, et al. Cigarette smoke mediates epigenetic repression of miR-487b during pulmonary carcinogenesis. J Clin Invest. 2013;123(3):1241–1261. doi: 10.1172/JCI61271. [DOI] [PMC free article] [PubMed] [Google Scholar]
- 3.Hackett NR, et al. Variability of antioxidant-related gene expression in the airway epithelium of cigarette smokers. Am J Respir Cell Mol Biol. 2003;29(3 Pt 1):331–343. doi: 10.1165/rcmb.2002-0321OC. [DOI] [PubMed] [Google Scholar]
- 4.Hackett NR, et al. RNA-Seq quantification of the human small airway epithelium transcriptome. BMC Genomics. 2012;13:82. doi: 10.1186/1471-2164-13-82. [DOI] [PMC free article] [PubMed] [Google Scholar]
- 5.Spira A, et al. Effects of cigarette smoke on the human airway epithelial cell transcriptome. Proc Natl Acad Sci U S A. 2004;101(27):10143–10148. doi: 10.1073/pnas.0401422101. [DOI] [PMC free article] [PubMed] [Google Scholar]
- 6.Steiling K, et al. Comparison of proteomic and transcriptomic profiles in the bronchial airway epithelium of current and never smokers. PLoS One. 2009;4(4):e5043. doi: 10.1371/journal.pone.0005043. [DOI] [PMC free article] [PubMed] [Google Scholar]
- 7.Rahman SM, et al. Lung cancer diagnosis from proteomic analysis of preinvasive lesions. Cancer Res. 2011;71(8):3009–3017. doi: 10.1158/0008-5472.CAN-10-2510. [DOI] [PMC free article] [PubMed] [Google Scholar]
- 8.Rahman SM, et al. Proteomic patterns of preinvasive bronchial lesions. Am J Respir Crit Care Med. 2005;172(12):1556–1562. doi: 10.1164/rccm.200502-274OC. [DOI] [PMC free article] [PubMed] [Google Scholar]
- 9.Warburg O. On respiratory impairment in cancer cells. Science. 1956;124(3215):269–270. [PubMed] [Google Scholar]
- 10.Warburg O. On the origin of cancer cells. Science. 1956;123(3191):309–314. doi: 10.1126/science.123.3191.309. [DOI] [PubMed] [Google Scholar]
- 11.Hanahan D, Weinberg RA. Hallmarks of cancer: the next generation. Cell. 2011;144(5):646–674. doi: 10.1016/j.cell.2011.02.013. [DOI] [PubMed] [Google Scholar]
- 12.Liebler DC, Zimmerman LJ. Targeted quantitation of proteins by mass spectrometry. Biochemistry. 2013;52(22):3797–3806. doi: 10.1021/bi400110b. [DOI] [PMC free article] [PubMed] [Google Scholar]
- 13.Zhang B, et al. Proteogenomic characterization of human colon and rectal cancer. Nature. 2014;513(7518):382–387. doi: 10.1038/nature13438. [DOI] [PMC free article] [PubMed] [Google Scholar]
- 14.Bach PB, et al. Variations in lung cancer risk among smokers. J Natl Cancer Inst. 2003;95(6):470–478. doi: 10.1093/jnci/95.6.470. [DOI] [PubMed] [Google Scholar]
- 15.Wang J, Duncan D, Shi Z, Zhang B. WEB-based Gene SeT AnaLysis Toolkit (WebGestalt): update 2013. Nucleic Acids Res. 2013;41(Web Server issue):W77–W83. doi: 10.1093/nar/gkt439. [DOI] [PMC free article] [PubMed] [Google Scholar]
- 16.Beane J, Sebastiani P, Liu G, Brody JS, Lenburg ME, Spira A. Reversible and permanent effects of tobacco smoke exposure on airway epithelial gene expression. Genome Biol. 2007;8(9):R201. doi: 10.1186/gb-2007-8-9-r201. [DOI] [PMC free article] [PubMed] [Google Scholar]
- 17.Spira A, et al. Airway epithelial gene expression in the diagnostic evaluation of smokers with suspect lung cancer. Nat Med. 2007;13(3):361–366. doi: 10.1038/nm1556. [DOI] [PubMed] [Google Scholar]
- 18.Silvestri GA, et al. A bronchial genomic classifier for the diagnostic evaluation of lung cancer. N Engl J Med. 2015;373(3):243–251. doi: 10.1056/NEJMoa1504601. [DOI] [PMC free article] [PubMed] [Google Scholar]
- 19.Whitney DH, et al. Derivation of a bronchial genomic classifier for lung cancer in a prospective study of patients undergoing diagnostic bronchoscopy. BMC Med Genomics. 2015;8:18. doi: 10.1186/s12920-015-0091-3. [DOI] [PMC free article] [PubMed] [Google Scholar]
- 20.Klein-Szanto AJ, et al. A tobacco-specific N-nitrosamine or cigarette smoke condensate causes neoplastic transformation of xenotransplanted human bronchial epithelial cells. Proc Natl Acad Sci U S A. 1992;89(15):6693–6697. doi: 10.1073/pnas.89.15.6693. [DOI] [PMC free article] [PubMed] [Google Scholar]
- 21.Young JD. INCA: a computational platform for isotopically non-stationary metabolic flux analysis. Bioinformatics. 2014;30(9):1333–1335. doi: 10.1093/bioinformatics/btu015. [DOI] [PMC free article] [PubMed] [Google Scholar]
- 22.DeBerardinis RJ, Thompson CB. Cellular metabolism and disease: what do metabolic outliers teach us? Cell. 2012;148(6):1132–1144. doi: 10.1016/j.cell.2012.02.032. [DOI] [PMC free article] [PubMed] [Google Scholar]
- 23.Belinsky SA, et al. Aberrant promoter methylation in bronchial epithelium and sputum from current and former smokers. Cancer Res. 2002;62(8):2370–2377. [PubMed] [Google Scholar]
- 24.Varella-Garcia M, et al. Spectral karyotyping detects chromosome damage in bronchial cells of smokers and patients with cancer. Am J Respir Crit Care Med. 2007;176(5):505–512. doi: 10.1164/rccm.200609-1329OC. [DOI] [PMC free article] [PubMed] [Google Scholar]
- 25.Singh A, et al. Transcription factor NRF2 regulates miR-1 and miR-206 to drive tumorigenesis. J Clin Invest. 2013;123(7):2921–2934. doi: 10.1172/JCI66353. [DOI] [PMC free article] [PubMed] [Google Scholar]
- 26.Cho HY, Kleeberger SR. Association of Nrf2 with airway pathogenesis: lessons learned from genetic mouse models. Arch Toxicol. 2015;89(11):1931–1957. doi: 10.1007/s00204-015-1557-y. [DOI] [PMC free article] [PubMed] [Google Scholar]
- 27.Fan J, Ye J, Kamphorst JJ, Shlomi T, Thompson CB, Rabinowitz JD. Quantitative flux analysis reveals folate-dependent NADPH production. Nature. 2014;510(7504):298–302. doi: 10.1038/nature13236. [DOI] [PMC free article] [PubMed] [Google Scholar]
- 28.Sabharwal SS, Schumacker PT. Mitochondrial ROS in cancer: initiators, amplifiers or an Achilles’ heel? Nat Rev Cancer. 2014;14(11):709–721. doi: 10.1038/nrc3803. [DOI] [PMC free article] [PubMed] [Google Scholar]
- 29.Gustafson AM, et al. Airway PI3K pathway activation is an early and reversible event in lung cancer development. Sci Transl Med. 2010;2(26):26ra25. doi: 10.1126/scitranslmed.3000251. [DOI] [PMC free article] [PubMed] [Google Scholar]
- 30.Rathmell JC, Fox CJ, Plas DR, Hammerman PS, Cinalli RM, Thompson CB. Akt-directed glucose metabolism can prevent Bax conformation change and promote growth factor-independent survival. Mol Cell Biol. 2003;23(20):7315–7328. doi: 10.1128/MCB.23.20.7315-7328.2003. [DOI] [PMC free article] [PubMed] [Google Scholar]
- 31.Kikuchi T, et al. In-depth proteomic analysis of nonsmall cell lung cancer to discover molecular targets and candidate biomarkers. Mol Cell Proteomics. 2012;11(10):916–932. doi: 10.1074/mcp.M111.015370. [DOI] [PMC free article] [PubMed] [Google Scholar]
- 32.Sullivan JP, et al. Aldehyde dehydrogenase activity selects for lung adenocarcinoma stem cells dependent on notch signaling. Cancer Res. 2010;70(23):9937–9948. doi: 10.1158/0008-5472.CAN-10-0881. [DOI] [PMC free article] [PubMed] [Google Scholar]
- 33.Harris FT, et al. Acyl-coenzyme A-binding protein regulates Beta-oxidation required for growth and survival of non-small cell lung cancer. Cancer Prev Res (Phila) 2014;7(7):748–757. doi: 10.1158/1940-6207.CAPR-14-0057. [DOI] [PMC free article] [PubMed] [Google Scholar]
- 34.Fan J, Kamphorst JJ, Rabinowitz JD, Shlomi T. Fatty acid labeling from glutamine in hypoxia can be explained by isotope exchange without net reductive isocitrate dehydrogenase (IDH) flux. J Biol Chem. 2013;288(43):31363–31369. doi: 10.1074/jbc.M113.502740. [DOI] [PMC free article] [PubMed] [Google Scholar]
- 35.Jiang L, et al. Reductive carboxylation supports redox homeostasis during anchorage-independent growth. Nature. 2016;532(7598):255–258. doi: 10.1038/nature17393. [DOI] [PMC free article] [PubMed] [Google Scholar]
- 36.Cargile BJ, Sevinsky JR, Essader AS, Stephenson JL, Bundy JL. Immobilized pH gradient isoelectric focusing as a first-dimension separation in shotgun proteomics. J Biomol Tech. 2005;16(3):181–189. [PMC free article] [PubMed] [Google Scholar]
- 37.Tabb DL, Fernando CG, Chambers MC. MyriMatch: highly accurate tandem mass spectral peptide identification by multivariate hypergeometric analysis. J Proteome Res. 2007;6(2):654–661. doi: 10.1021/pr0604054. [DOI] [PMC free article] [PubMed] [Google Scholar]
- 38.Zhang B, Chambers MC, Tabb DL. Proteomic parsimony through bipartite graph analysis improves accuracy and transparency. J Proteome Res. 2007;6(9):3549–3557. doi: 10.1021/pr070230d. [DOI] [PMC free article] [PubMed] [Google Scholar]
- 39.Li M, et al. Comparative shotgun proteomics using spectral count data and quasi-likelihood modeling. J Proteome Res. 2010;9(8):4295–4305. doi: 10.1021/pr100527g. [DOI] [PMC free article] [PubMed] [Google Scholar]
- 40.Li J, et al. A bioinformatics workflow for variant peptide detection in shotgun proteomics. Mol Cell Proteomics. 2011;10(5):M110.006536. doi: 10.1074/mcp.M110.006536. [DOI] [PMC free article] [PubMed] [Google Scholar]
- 41.MacLean B, et al. Skyline: an open source document editor for creating and analyzing targeted proteomics experiments. Bioinformatics. 2010;26(7):966–968. doi: 10.1093/bioinformatics/btq054. [DOI] [PMC free article] [PubMed] [Google Scholar]
- 42.Noguchi Y, Young JD, Aleman JO, Hansen ME, Kelleher JK, Stephanopoulos G. Effect of anaplerotic fluxes and amino acid availability on hepatic lipoapoptosis. J Biol Chem. 2009;284(48):33425–33436. doi: 10.1074/jbc.M109.049478. [DOI] [PMC free article] [PubMed] [Google Scholar]
- 43.Young JD, Allen DK, Morgan JA. Isotopomer measurement techniques in metabolic flux analysis II: mass spectrometry. Methods Mol Biol. 2014;1083:85–108. doi: 10.1007/978-1-62703-661-0_7. [DOI] [PubMed] [Google Scholar]
- 44.Fernandez CA, Des Rosiers C, Previs SF, David F, Brunengraber H. Correction of 13C mass isotopomer distributions for natural stable isotope abundance. J Mass Spectrom. 1996;31(3):255–262. doi: 10.1002/(SICI)1096-9888(199603)31:3<255::AID-JMS290>3.0.CO;2-3. [DOI] [PubMed] [Google Scholar]
- 45.Ahn WS, Antoniewicz MR. Parallel labeling experiments with [1,2-(13)C]glucose and [U-(13)C]glutamine provide new insights into CHO cell metabolism. Metab Eng. 2013;15:34–47. doi: 10.1016/j.ymben.2012.10.001. [DOI] [PubMed] [Google Scholar]
- 46.Vacanti NM, et al. Regulation of substrate utilization by the mitochondrial pyruvate carrier. Mol Cell. 2014;56(3):425–435. doi: 10.1016/j.molcel.2014.09.024. [DOI] [PMC free article] [PubMed] [Google Scholar]
- 47.Antoniewicz MR, Kelleher JK, Stephanopoulos G. Determination of confidence intervals of metabolic fluxes estimated from stable isotope measurements. Metab Eng. 2006;8(4):324–337. doi: 10.1016/j.ymben.2006.01.004. [DOI] [PubMed] [Google Scholar]
- 48.Jonckheere AR. A distribution-free k-sample test against ordered alternatives. Biometrika. 1954;41:133–145. [Google Scholar]
- 49. Faraway JJ. Extending the Linear Model with R: Generalized Linear, Mixed Effects and Nonparametric Regression Models. London: Chapman and Hall/CRC; 2006. [Google Scholar]
Associated Data
This section collects any data citations, data availability statements, or supplementary materials included in this article.


