

SUMMARY
Background
Regulatory T cells (Treg) are an essential arm of adaptive immunity not only in tolerance and autoimmunity but also in infectious diseases. In Tuberculosis (TB), it has been suggested that the frequency of Tregs is higher in the blood of TB patients when compared to healthy controls with subsequent decline after treatment. However, with the discovery that FOXP3, the hallmark marker of Tregs, is not exclusive to Tregs and the lack of specific markers for Tregs, it has been a challenge to fully understand the role of Tregs in TB.
Method
We isolated PBMC from smear positive TB patients (TB, N = 13) before and after treatment, latent TB infected participants (LTBI, N = 8), and healthy endemic controls (EC, N = 9) and evaluated the frequency of different populations of Tregs and expression of FOXP3 by flowcytometry using six markers.
Results
The findings in this study showed that the association of Treg frequency with TB disease depends on the phenotypic markers used. While the frequency of CD4+CD25+/hi T cells was higher in TB patients compared to LTBI individuals, there was no difference in the frequency of CD4+CD25+FOXP3+CD127lo Treg among TB, LTBI, or EC. However, delineation of Tregs into active and naïve subsets revealed a significant increase in FOXP3 expression in active primed Tregs (CD4+CD25+FOXP3+CD127loCD45RO+Ki-67+) of TB patients compared to LTBI and EC; and a significantly higher frequency of resting primed (CD45RO+Ki-67−) Treg in QuantiFERON negative EC compared to TB patients. After treatment completion, there was a significant decline in the frequency of active primed Treg, median (IQR) from 12.4% (9.5–21.9) of Tregs to 9.3% (7.0–12.2); P = 0.003 Wilcoxon signed rank test. We conclude that Treg subsets may be differentially regulated and expressed in TB disease, cure, and infection.
Keywords: Tuberculosis, Regulatory T cells, FOXP3
1. Introduction
The natural history of Tuberculosis is closely tied with the hostepathogen interactions and consequent immune responses of the host. Upon exposure to Mycobacterium tuberculosis, a person may remain uninfected, develop active disease (the main source of transmission), or latent infection, which can progress to active disease (re-activation) later on in life and thereby also serves as a reservoir for disease transmission. It is generally thought that an individual with intact immunity will either not become infected or control the infection, whereas those with a weaker immunity are more prone to develop primary TB disease or reactivation. This is clearly demonstrated in HIV infection where host immunity is compromised leading to a 20-fold increase in the risk of contracting TB, a higher rate of mortality from TB, and higher probability of treatment failure and of developing MDR-TB [1]. However, the mechanisms behind protection or disease progression in individuals with apparently intact immunity are not fully understood and this is critical to the development of a more effective vaccine. Although T helper 1 type immune responses have been extensively studied, little attention has been given to how they are regulated. Co-expression of regulatory T cells along with adaptive immune responses may be a crucial determinant of the outcome of TB exposure, infection, and disease.
Regulatory T cells (Tregs), described initially as CD4+CD25+ and later more widely as CD4+CD25+FOXP3+ T cells after being characterized [2], represent 5–10% of the circulating CD4+ T cell population; with only 1–2% being CD4+CD25hi [3]. Their primary function appears to be maintenance of peripheral tolerance, achieved by suppression of self-reactive immune responses. They also limit inflammatory immune response to commensal and pathogenic bacteria in order to minimize tissue pathology. However, with regards to pathogenic bacteria, the latter response may hinder clearance of the pathogen and promote its survival and persistence in the host. So, it is essential that we have a clear understanding of the role Tregs play during infection. Unfortunately, the study of Tregs is impeded by the lack of specific markers to differentiate natural Treg (nTreg), also known as thymus derived Treg (tTreg), which originate and develop in the thymus from peripherally induced Treg (iTreg), which develop from conversion of conventional CD4 T cells into suppressor T cells in the periphery. Although FOXP3 is the prototypic marker of nTreg, essential for their development and function [4,5], it is no longer considered to be exclusive to nTreg because of its expression by peripherally induced regulatory T cells [6] as well as other non-regulatory T cells [7].
The role of Tregs in TB has been investigated by several publications which demonstrated the presence of a higher percentage of CD4+CD25hi and/or CD4+CD25hiFOXP3+ T cells in the blood of TB patients when compared to healthy controls [8–14]. The percentage of these Tregs at disease sites has also been shown to be even higher than in the blood of TB patients [8,9,13,15]. Chen and his group [8] have also shown that the Tregs they described act by a cell-to-cell contact dependent mechanism, which is one of the functional definitions of nTreg. However, there have also been reports where no difference was found in the frequency of CD4+CD25+FOXP3+ Tregs between TB patients and healthy controls [16], when additional markers (CD39 and CD127) were also used, and even reports of a lower frequency of Tregs in TB patients than healthy controls living in a TB endemic area [17]. Based on these conflicting findings, it is difficult to draw a conclusion on the role of Tregs in TB.
Recently, Ki-67 (a protein that is highly expressed in actively dividing cells) and CD45RO (a marker for primed/memory T cells) were shown to assist in defining functional subsets of Tregs in healthy persons and individuals with sarcoidosis or systemic lupus erythematosus (both diseases where T cell dysfunction is thought to play a role) [18]. Therefore, in this study, we used a combination of six markers (Ki-67, CD45RO, CD4, CD25, CD127, FOXP3) to identify and characterize Tregs in TB patients before and after treatment, in persons with LTBI, and in healthy endemic controls.
2. Materials and methods
2.1. Study area and population
This study was conducted in Addis Ababa, Ethiopia from July 2012 to December 2014. Study participants were recruited from ten public health centers. Newly diagnosed pulmonary TB patients with confirmed smear positive result were recruited prior to initiation of anti-TB treatment. TB patients had a follow up visit at 24 weeks, upon completion of multi-drug treatment (MDT) according to DOTS strategy. Household contacts (HHC) were recruited from amongst families of TB patients and included into the study only if they were asymptomatic, had a clear chest X-ray and had been living in the same household as the TB patient for at least six months prior to diagnosis of the patient. As control, apparently healthy participants were recruited from Voluntary Counseling and Testing (VCT) clinics of selected health centers and included in the study if they had a clear chest X-ray and no history, sign or symptoms of TB. All participants were between the age of 18 and 65 and HIV negative. We excluded HIV positive individuals to avoid the associated immunological impairments shown to complicate TB immunology. Blood from all participants and sputum from TB patients was collected at the health center and transported to the Armauer Hansen Research Institute (AHRI) for laboratory investigations. Ethical approval was obtained from the AHRI/ALERT Ethics Review Committee and Ethiopian National Research Ethics Review Committee. All participants gave informed consent prior to recruitment and specimen collection.
2.2. PBMC isolation
Peripheral blood mononuclear cells (PBMC) were isolated from blood collected in heparinized tubes by density gradient centrifugation using Ficoll-Hypaque solution (Amersham). Briefly, blood was layered onto Leucosep tubes (BD) containing 12 ml of Ficoll and centrifuged for 20 min at 1800 rpm. The fluid above the separation membrane of the Leucosep tube which contains the PBMC was transferred into a new tube and washed with phosphate buffered saline (PBS) twice. After the last wash, the pellet was re-suspended in 20% Fetal Calf Serum (FCS, Sigma) in RPMI (Grenier Bio One), counted and frozen in a final solution of 10%DMSO–20%FCS-RPMI at −80 °C using a freezing container. The cells were transferred to liquid nitrogen within the following three days.
2.3. QuantiFERON TB Gold assay
The QuantiFERON TB Gold In-Tube (QFT) test (Cellestis) is a whole blood IFNγ release assay measuring responses to a cocktail of ESAT-6, CFP-10, and TB7.7 (p4) peptide antigens. The assay was performed according to the manufacturer’s instructions using the QuantiFERON TB Gold blood collection tubes (Cellestis, 0590 0301), composed of Nil, TB antigen, and Mitogen tubes and the Quanti-FERON TB Gold ELISA kit (Cellestis, 0594 0201). Optical density was read using Multiskan microplate reader with 450 nm filter and a 620 nm reference filter. The data was analyzed using the Quanti-FERON TB Gold Analysis Software.
2.4. Flowcytometry
Flowcytometry staining was performed on frozen PBMC. PBMC was thawed using 50% FCS in RPMI containing 1:10,000 Benzonase (Invitrogen) and washed twice with FACS buffer (PBS with 1 mM EDTA, 0.1% BSA, and 0.1% Sodium Azide). One million cells were resuspended in FACS buffer and surface staining done by incubating cells with a cocktail of antibodies containing 5 μl CD4 V500 (Clone RPA-T4, BD, Catalog No. 560768), 5 μl CD8 PE (Clone RPA-T8, BD, Catalog No. 555367), 5 μl CD25 PerCP-Cy5.5 (Clone BC96, eBioscience, Catalog No. 45-0259), 5 μl CD45RO PE-Cy7 (Clone UCHL-1, BD, Catalog No. 337168), and 5 μl CD127 BV421 (Clone HIL-7R-M21, BD, Catalog No. 562436). All incubations were done on ice in the dark for 30 min. Cells were then washed twice with PBS and incubated with 400 μl of fixable viability dye-eFluor 780 (eBioscience, Catalog No. 65-0865) diluted 1:1000 in PBS. Cells were then washed twice with FACS buffer and fixed by incubation with 1 ml FOXP3 Fixation/Permeabilization buffer (FOXP3 staining buffer set; eBioscience, Catalog No. 00-5523-00). Cells were washed with Perm buffer and intracellular staining done by incubation with a mix of 5 μl FOXP3 APC (Clone PCH101, eBioscience, Catalog no. 17-4776) and 10 μl Ki-67 FITC (BD, Catalog No. 556026). Cells were then washed with Perm buffer and fixed with 500 μl of 2% paraformaldehyde (PFA). Data was acquired on a BD FACS Canto with Diva software and analyzed using FlowJo (Version 9.4).
2.5. Statistical analysis
Data was analyzed using GraphPad Prism version 6.0 for Windows (GraphPad Software, La Jolla, California, USA, www.graphpad.com). Comparison between study groups was done using the KruskaleWallis test followed by Dunn’s multiple comparisons test. Friedman test followed by Dunn’s multiple comparisons test was used to compare matched data within a group and Wilcoxon signed rank test was used for comparison of before-after treatment data in TB patients. Unless otherwise indicated, data is presented as median (Interquartile range) and a P value of less than 0.05% was taken as a statistically significant difference.
3. Results
3.1. Characteristics of study participants
Smear positive Tuberculosis patients were recruited prior to initiation of chemotherapy and further tests by QFT and culture of sputum performed at AHRI. Participants in the TB Group (N = 13) were all QFT and culture positive at diagnosis and remained QFT positive after completion of 24 weeks of MDT. However, they were all smear negative by 2 months after initiation and at completion of treatment, so cured from TB. The QuantiFERON assay was used to identify and select QFT positive participants from household contacts for the LTBI Group (N = 13). Five of the thirteen participants were excluded from analysis because of poor cell viability (below 70%) when evaluated by viability dye eFluor780. Healthy endemic controls were also tested with QFT assay in order to select QFT negative participants for the healthy endemic control (EC) group (N = 9).
Chest X-rays of latently infected participants and healthy controls had no signs of Tuberculosis disease. The age and sex distribution in the three study groups, body mass index (BMI), and results of the QuantiFERON test are shown in Table 1. BMI in the TB group was lower than LTBI and EC groups.
Table 1.
Characteristics of study participants.
| Group | N | Age, median (range) | Sex
|
BMI, mean | QFT (IU/ml), mean (SD) | |
|---|---|---|---|---|---|---|
| M | F | |||||
| TB | 13 | 21 (18–37) | 8 | 5 | 17.8 | 5.9 (3.3) |
| LTBI | 8 | 31 (26–45) | 3 | 5 | 20.8 | 5.4 (4.3) |
| EC | 9 | 27 (22–39) | 4 | 5 | 21.4 | 0.1 (0.13 |
| P value | <0.05 | <0.001 | ||||
3.2. Definition of regulatory T cells
The frequency of regulatory Tcells was expressed as a percentage of CD4 T cells, which was determined to be of similar frequency among the study groups; 40%, 36%, and 40% in TB, LTBI, and healthy EC respectively. We used the phenotypic markers CD4, CD25, FOXP3, and CD127 to define regulatory T cells by combining them to produce five different cell populations, namely CD4+CD25+, CD4+CD25hi, CD4+CD25+CD127lo, CD4+CD25+FOXP3+, and CD4+CD25+FOXP3+CD127lo. After selecting lymphocytes from a Forward Scatter (FSC) versus Side scatter (SSC) plot, we gated on live cells followed by CD4 T cell selection prior to gating on the different Treg populations shown in Figure 1. When we compared the frequency of these cell populations, we observed a similar hierarchy in the three study groups; the frequency of CD4+CD25hi T cells was significantly lower than CD4+CD25+CD127lo, CD4+CD25+FOXP3+, and CD4+CD25+FOXP3+CD127lo and the frequency of CD4+CD25+CD127lo was the highest (Figure 2A).
Figure 1.

Gating strategy for regulatory T cells. After gating on CD4 T cells, CD25 is plotted against CD4 to identify CD4+CD25+ and CD4+CD25hi T cells (A, left); CD25 is plotted against CD127 to identify CD4+CD25+CD127lo T cells (A, middle); and CD25 is plotted against FOXP3 to identify CD4+CD25+FOXP3+ T cells (A, right). From the latter, a CD127 vs. FOXP3 plot is used to gate on CD127lo population and thereby identify CD4+CD25+FOXP3+CD127lo Treg (B, left); from which Ki-67 is plotted against CD45RO to identify the three subsets of Tregs; naïve Treg (CD45RO−Ki-67−), active primed Treg (CD45RO+Ki-67+), and resting primed Treg (CD45RO+Ki-67−) (B, right).
Figure 2.

Comparison of Treg gates. Regulatory T cells were defined using five combinations of CD4, CD25, CD127, FOXP3, and CD127. The frequency of regulatory T cells as a percentage of CD4 T cells (A) and MFI of FOXP3 in the different phenotypes of Tregs (B) in TB patients (TB, N = 13), latently infected participants (LTBI, N = 8), and healthy endemic controls (EC, N = 9) are shown. Box-plots represent inter-quartile range (IQR) with line at the median and whiskers indicate Min to Max value. Significant differences among the study groups determined by Kruskale–Wallis test are indicated by dashed lines. Asterisks indicate P < 0.05 (*), P < 0.01 (**), P < 0.001 (***), and P < 0.0001 (****).
Since FOXP3 is essential for the development and function of Tregs, we evaluated the Median Fluorescent Intensity (MFI) of FOXP3 in the five phenotypes that could potentially define Tregs. FOXP3 expression was significantly higher in the CD4+CD25hi cell population compared to CD4+CD25+ and CD4+CD25+CD127lo T cell populations in all study groups (Figure 2B). The MFI of FOXP3 in CD4+CD25hi was not statistically different from that of CD4+CD25+FOXP3+ and CD4+CD25+FOXP3+CD127lo cell populations. The high FOXP3 expression in the latter population indicates the likelihood that these are more closely associated with nTreg [19] and prompted us to select them for further classification using Ki-67 and CD45RO. It should be noted that the CD4+CD25+FOXP3+CD127lo phenotype used contains CD25low, CD25intermediate, and CD25hiCD4 T cells.
3.3. Regulatory T cells in TB disease and latent infection
When the frequency of regulatory T cells was compared among the three study groups, it was only when we define them as CD4+CD25+ and CD4+CD25hi population that we found a higher frequency in TB patients when compared to LTBI (Figure 2A). When comparing the other phenotypes, there was no difference in the frequency of Treg cell populations among TB, LTBI, and EC groups. The frequency, median (IQR) of CD4+CD25+FOXP3+CD127lo Treg was 2.7% (1.9–3.11) in TB patients, 2.75% (1.75–3.23) in LTBI, and 2.46% (1.49–3.94) in healthy EC. The intensity of FOXP3 (MFI) within each Treg phenotype was similar among the study groups (Figure 2B). Using Ki-67 and CD45RO, we further classified CD4+CD25+FOXP3+CD127lo Tregs into three subsets defined as active primed Treg (Ki-67+CD45RO+), resting primed Treg (Ki-67−CD45RO+), and naïve Treg (Ki-67−CD45RO−) for the purposes of this paper. There was no significant difference in the frequency of active and naïve Treg subsets among the study groups, while resting primed Treg subset was significantly higher in EC than in TB patients (Figure 3A).
Figure 3.
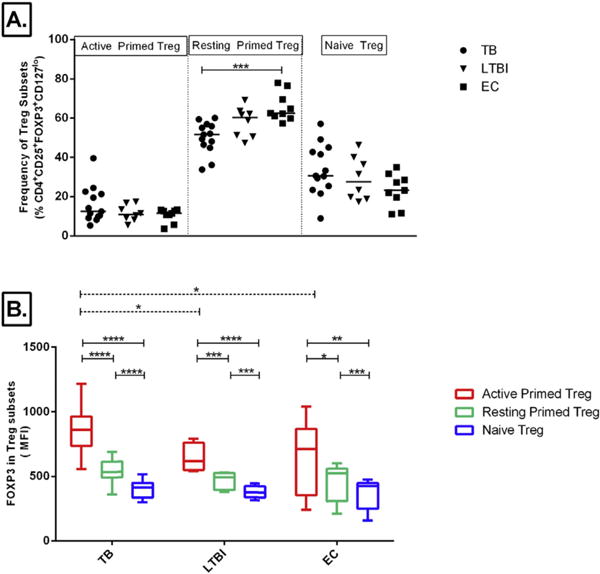
Comparisons of Treg Subsets. Tregs defined as CD4+CD25+FOXP3+CD127lo were further characterized based on their expression of Ki-67 and CD45RO. The frequency of Treg subsets; Active Primed (CD45RO+Ki-67+), Resting Primed (CD45RO+Ki-67−), or Naïve (CD45RO−Ki-67−) as a percentage of Tregs is shown (A, Line at Median). Expression of FOXP3 (MFI) in these Treg subsets (B) among TB patients (TB), latently infected participants (LTBI), and healthy endemic controls (EC) is shown in B. Box-plots represent IQR with line at the median and whiskers indicate Max to Min values. Results of one way ANOVA for comparison of MFI among study groups (dashed lines) and repeated measures ANOVA for comparison of MFI in the different Treg subsets within each study group (solid lines) followed by Tukey’s test for multiple comparison are indicated by P < 0.05 (*), P < 0.01 (**), P < 0.001 (***), and P < 0.0001 (****).
The MFI of FOXP3 in the active primed Treg population was significantly higher than in both resting and naïve Treg; and this was evident in all three study groups (Figure 3B, solid lines). As well, there was a higher intensity of FOXP3 in active primed Treg subset of TB patients than LTBI and healthy EC (Figure 3B, dashed lines). The MFI of FOXP3 in the resting primed Treg and naïve Treg was the same among TB patients, LTBI, and healthy EC.
IFNγ production (IU/ml) measured in response to a cocktail of ESAT-6, CFP10, and TB7.7 by the QuantiFERON TB Gold assay was analyzed in relation to the frequency of Treg in TB patients to see if there was any correlation. We found no correlation between IFNγ production (IU/ml) and the frequency of Treg defined by any of the five phenotypes and with any of the Treg subsets described (data not shown).
3.4. Regulatory T cells in TB patients after chemotherapy
TB patients were followed for 24 weeks during treatment, and Treg levels were evaluated after cure. The frequency of CD4+CD25+FOXP3+CD127lo Treg in TB patients did not change after treatment (Figure 4A). However, when considering CD45RO expression, there was a decline in the frequency of CD45RO+ (primed) Tregs in patients after treatment (P < 0.001) (Figure 4B). This reduction was present in both active primed (Ki-67+CD45RO+) and resting primed (Ki-67−CD45RO+) subsets of Treg population (Figure 4C). On the contrary, the frequency of Naïve Treg (Ki-67−CD45RO−) was higher in the blood of TB patients after treatment. Unlike the frequency of Treg subsets, the MFI of FOXP3 within each subset of Treg did not change after treatment (Figure 4D).
Figure 4.

Treg subsets in TB patients before and after anti-TB treatment. Frequency of CD4+CD25+FOXP3+CD127lo Treg (A) and primed Treg (B) in TB patients at diagnosis (TB) and after 24 weeks of MDT (TB Cured). The frequency (C) and FOXP3 expression (D) of Treg subsets are shown as Active Primed (Red), Resting Primed (Green), or Naïve Treg (Blue) in TB patients before and after treatment; box plots show median and inter-quartile range with whiskers at Min to Max values. P value of Wilcoxon signed rank test are indicated as P < 0.05 (*), P < 0.01 (**), P < 0.001 (***), and P < 0.0001 (****). Pie chart of distribution of subsets of Treg (mean) among TB patients, TB patients after 24 weeks of MDT (TB-cured), latently infected participants (LTBI) and healthy endemic controls (EC) are shown in E. (For interpretation of the references to color in this figure legend, the reader is referred to the web version of this article.)
Overall, the composition of Treg with the three Treg subsets showed some difference among active TB patients, cured TB, LTBI, and healthy participants (Figure 4E). In all study groups, there was a larger proportion of resting primed Treg, followed by resting naïve Treg, and active primed Treg. The proportion of actively proliferating (Ki-67+) naïve Treg subset was negligible in all groups. TB patients had a higher proportion of active primed Treg compared to LTBI and healthy EC; mean values were 16%, ~12%, and ~10% respectively. After anti-TB treatment, the proportion of active primed Treg declines to ~11%, resembling that of LTBI and healthy participants. The percentage of resting primed Tregs also declined in TB patients after treatment from 50% to 43% while the percentage of naïve Treg increased from 34% to 46% of Treg.
4. Discussion
In order to investigate the role of Treg in TB infection, we characterized frequencies of Tregs and Treg subsets defined by a panel of six markers, and compared levels between TB patients, latently infected persons, and healthy endemic controls. Our key findings were: the association of Treg levels with TB depends on the phenotypic markers used to define them; delineation of Tregs into subsets on the basis of markers for memory/primed T cells (CD45RO) and proliferation (Ki-67) revealed a higher intensity of FOXP3 in proliferating (active) primed Tregs in active TB disease; and after treatment, while there was little change in the total Treg frequency there was a significant decline in the frequency of active primed Treg subsets.
Most of the previous studies done on TB characterized Tregs as CD4+CD25+/CD4+CD25hi or CD4+CD25+FOXP3+ T cells and the majority reported a higher frequency in TB patients than healthy controls [8–11,13,14] while only few reported no difference [16,17]. When we harmonized our definition of Treg accordingly, we also found a higher frequency of CD4+CD25+/CD4+CD25hi T cells in the blood of TB patients than in LTBI. However, contrary to some previous reports [8,11,14] and in agreement with others [20], we found no difference in the frequency of CD4+CD25+FOXP3+ Tregs between TB patients and LTBI or HC. The discrepancy here could be due to the gating strategy, which unlike previous studies where standard quadrants were used to gate on CD25+FOXP3+ cells; we employed a diagonal gate to identify intermediate to high densities of both markers. The frequency of CD4+CD25+FOXP3+CD127lo Tregs in the blood of TB patients was not different from LTBI and healthy endemic controls, in agreement with the only previous report we found that characterized Tregs using these markers [16].
Our study showed that FOXP3 expression was the highest in CD4+CD25hi cells, which were previously shown to be equivalent to the mouse nTreg population [3] and not different from FOXP3 intensity in CD4+CD25+FOXP3+ and CD4+CD25+FOXP3+CD127lo cells. This finding and the fact that CD25 expression and CD127 downregulation are not specific to Tregs, occurring also on activated T cells, prompted us to include FOXP3 to define Tregs. Currently, there are no specific markers for phenotypic identification of human Treg or differentiation between tTreg and iTreg including cytokine producing suppressor T cells (Tr1 and Th3). To overcome this constraint, we included additional markers that would enable us to differentiate functionally distinct populations.
Accordingly, when we further delineated CD4+CD25+FOXP3+CD127lo Treg into active primed (Ki-67+CD45RO+), resting primed (Ki-67−CD45RO+), and naïve/antigen inexperienced (Ki-67−CD45RO−) subsets, we found expression of FOXP3 in the active primed Treg to be significantly higher than in the resting or naïve Treg population in all study groups; making them a FOXP3hi population. A similar Treg subset (CD45RA−FOXP3hi) previously described by Miyara et al. [18] were shown to be Ki-67+, highly suppressive of effector T cells and naïve Tregs. Interestingly, these cells were also shown to be anergic to proliferation in response to antigen stimulation and prone to die by apoptosis, giving them the characteristics of a possible terminally-differentiated effector Treg population [18,21]. As far as we know, our study is the first to evaluate active primed Treg in TB patients using these six markers and to show their frequency increases during active disease and declines after cure to the level of healthy and LTBI persons. A previous report has also shown that the frequency of proliferating (Ki-67+) CD4+FOXP3+ Tregs is higher in TB patients compared to LTBI individuals and make up 10% of CD4+FOXP3+ Treg population in healthy controls [14]; similar to our LTBI and healthy population. It is interesting that the intensity of FOXP3 in the active Treg population of TB patients remained high after treatment and this is perhaps because these effector-like terminally-differentiated cell types may eventually die rather than revert to a resting phenotype, or perhaps due to epigenetic modification leading to a stable regulatory population, as has been reported for other pulmonary infections [22]. It is also possible that the continued protein expression in these cells might take a longer time to return to normal values. Although previous studies have looked at the change in frequency in TB patients after treatment; with the frequency of CD4+CD25+/hi reported to remain high upto 24 weeks of treatment [13] while CD4+CD25+FOXP3+ Treg frequency was shown to decline at 6, 12, and 24 months of treatment [8,14], we did not come across any report of changes in the MFI of FOXP3. However, with the small sample size being a limitation in our study, we recommend future studies with a larger sample size and longer follow up to evaluate these possibilities.
The presence of a naïve population of nTreg with suppressor function by a cell-to-cell contact mechanism was previously demonstrated [18,23] and shown to express CD31 (marker for recent thymic emigrant cells) and to differentiate to an active Treg population upon stimulation. Accordingly, it was proposed that a thymically-derived Treg population is likely to be the naïve Treg subset present in peripheral blood, which are highly proliferative in response to antigen stimulation and differentiate into antigen-experienced active Treg in disease conditions [18,21,24]. Our findings can be explained by this scenario; and in the context of TB, it is possible that the inflammatory immune responses to the high bacterial load in active TB patients induces the rise in active primed and highly suppressive Tregs in order to protect the host from tissue pathology; and as the bacterial load declines after treatment, and in parallel the inflammatory immune response declines, the active primed Treg population is likely to fall. An increase in the Treg population in response to inflammation taking place during the development of TB disease was previously shown in a Macaque model of TB infection [25]. As well, TB antigen specific Treg proliferation within the inflammatory milieu of TB infection has been demonstrated to occur early during infection in a mouse model of TB [26]. The latter group also showed a decline in these antigen specific Treg consequent to Tbet expression regardless of change in bacterial load. It is possible that these mechanisms are at play in humans and the presence and function of Tregs depends on the time of infection and disease progression; in combination with the impact of treatment. Finally, both scenarios can also explain reports of a correlation between Treg frequency and bacillary load in TB patients [13,14,27].
The frequency of resting primed Treg was significantly lower in TB patients than healthy EC. As well, the dynamic change in the proportion of Treg subsets resulted in an increase in naïve Treg subset and a fall in resting primed Treg subsets after cure. Since we gated on all FOXP3 positive cells, it is possible that the resting primed Treg population included cells previously described as FOXP3loKi-67− non-regulatory T cells, shown to be non suppressing and pro-inflammatory cytokine producing T cells [18]. FOXP3+ pro-inflammatory T cells have been shown to make up 14% of FOXP3+CD4+ T cell population [28]; and even higher proportions of upto 35% have been reported in other studies [21]. Therefore, the decline in our CD45RO+Ki-67− Treg could be partially due to a decrease in pro-inflammatory T cells which is also likely to occur as a consequence of the reduction in bacterial load in treated patients. The marker CD161 was previously shown to identify FOXP3+ pro-inflammatory T cells with suppressor characteristics [28] and in combination with Ki-67 and CD62, (negative on recently active T cells but positive on Treg) [21] may potentially discriminate active T cells from a possible primed resting Treg population in future studies. During the development of TB disease, there is also possible sequestration of regulatory T cells to the disease site in the lungs resulting in a lower frequency at the periphery [25] and this may extend to the different subsets evaluated in our study. A higher frequency of Treg or FOXP3 expression at the disease site compared to peripheral blood has been shown [8,9,13].
The clinical implications of Treg in TB disease are not fully understood. In humans, in vitro depletion of Treg from PBMC has been shown to result in increased production of antigen specific IFNγ production [8–11,13,14]. However, in animal studies, while some studies showed a reduction in bacterial burden as a result of Treg depletion prior to infection [29,30], which did not always correlate to IFNγ producing CD4 T cells [30], others showed no change in bacterial burden [31]. As well, depletion of Treg prior to BCG vaccination did not enhance protection from a subsequent challenge [32,33]. Therefore, we need to have a clear understanding of the presence of Treg in TB disease and latency as well as their phenotypes to comprehend their clinical significance.
In this study, after analyzing multiple phenotypes and subsets of Treg, we observed clinical association in TB disease with only some phenotypes and subsets of Treg. These findings support and further define the hypothesis that Treg subsets are distinct populations with dynamic changes occurring in TB disease and characterizing FOXP3+ Tregs as a homogenous population might lead to imprecise findings. In order to delineate the different subsets of Tregs and better understand changes that arise in disease progression, we recommend the use of additional markers of activation and memory such as Ki-67 and CD45RO, which were also in the proposed panel of antibodies for studying Treg by a recent multi-centered validation study [34].
Supplementary Material
Acknowledgments
We are very thankful to all the study participants. The authors also like to thank the nurses at the TB Clinic of health centers for participant recruitment and HIV testing and counseling services. We also thank Mr. Shiferaw Bekele at AHRI for culturing sputum samples of TB patients and Mrs. Helina and Mrs. Mitin for data entry of Questionnaires. We thank the European & Developing Countries Clinical Trials Partnership (EDCTP) for funding.
Funding
This study was supported by a grant from The European & Developing Countries Clinical Trials Partnership (EDCTP), grant code IP-2007.32080.001.
Appendix A. Supplementary material
Supplementary data related to this article can be found at http://dx.doi.org/10.1016/j.tube.2016.06.007.
Footnotes
Competing interests
None declared.
Ethical approval
The study was approved by the institutional review board of AHRI (P032/11) and the Ethiopian National Research Ethics Review Committee (3-10/647/04).
References
- 1.Fox GJ, Menzies D. Epidemiology of tuberculosis immunology. Adv Exp Med Biol. 2013;783:1–32. doi: 10.1007/978-1-4614-6111-1_1. [DOI] [PubMed] [Google Scholar]
- 2.Sakaguchi S. Naturally arising FOXP3-expressing CD25+CD4+ regulatory T cells in immunological tolerance to self and non-self. Nat Immunol. 2005;6(4):345–52. doi: 10.1038/ni1178. [DOI] [PubMed] [Google Scholar]
- 3.Baecher-Allan C, Brown JA, Freeman GJ, Hafler DA. CD4+CD25 high regulatory cells in human peripheral blood. J Immunol. 2001;167(3):1245–53. doi: 10.4049/jimmunol.167.3.1245. [DOI] [PubMed] [Google Scholar]
- 4.Fontenot JD, Gavin MA, Rudensky AY. FOXP3 programs the development and function of CD4+CD25+ regulatory T cells. Nat Immunol. 2003;4(4):330–6. doi: 10.1038/ni904. [DOI] [PubMed] [Google Scholar]
- 5.Hori S, Nomura T, Sakaguchi S. Control of regulatory T cell development by the transcription factor FOXP3. Science. 2003;299:1057–61. doi: 10.1126/science.1079490. [DOI] [PubMed] [Google Scholar]
- 6.Walker RM, Kasprowicz DJ, Gersuk VH, Benard A, Landeghen MV, Buckner JH, Ziegler SF. Induction of FOXP3 and acquisition of T regulatory activity by stimulated human CD4+CD25− T cells. J Clin Invest. 2003;112:1437–43. doi: 10.1172/JCI19441. [DOI] [PMC free article] [PubMed] [Google Scholar]
- 7.Wang J, Ioan-Facsinay A, van der Voort EIH, Huizinga TWJ, Toes REM. Transient expression of FOXP3 in human activated nonregulatory CD4+ T cells. Eur J Immunol. 2007;37:129–38. doi: 10.1002/eji.200636435. [DOI] [PubMed] [Google Scholar]
- 8.Chen X, Zhou B, Li M, Deng Q, Wu X, Le X, Wu C, Larmonier N, Zhang W, Zhang H, Wang H, Katsanis E. CD4(+)CD25(+)FOXP3(+)regulatory T cells suppress Mycobacterium tuberculosis immunity in patients with active disease. Clin Immunol. 2007;123(1):50–9. doi: 10.1016/j.clim.2006.11.009. [DOI] [PubMed] [Google Scholar]
- 9.Guyot-Revol V, Innes JA, Hackforth S, Hinks T, Lalvani A. Regulatory T cells are expanded in blood and disease sites in patients with tuberculosis. Am J Respir Crit Care Med. 2006;173(7):803–10. doi: 10.1164/rccm.200508-1294OC. [DOI] [PubMed] [Google Scholar]
- 10.Hougardy JM, Place S, Hildebrand M, Drowart A, Debrie AS, Locht C, Mascart F. Regulatory T cells depress immune responses to protective antigens in active tuberculosis. Am J Respir Crit Care Med. 2007;176(4):409–16. doi: 10.1164/rccm.200701-084OC. [DOI] [PubMed] [Google Scholar]
- 11.Li L, Lao SH, Wu CY. Increased frequency of CD4(+)CD25(high) Treg cells inhibit BCG-specific induction of IFN-gamma by CD4(+) T cells from TB patients. Tuberculosis. 2007;87(6):526–34. doi: 10.1016/j.tube.2007.07.004. [DOI] [PubMed] [Google Scholar]
- 12.Li XX, Chen JX, Wang LX, Sun J, Chen SH, Chen JH, Zhang XY, Zhou XN. Profiling B and T cell immune responses to co-infection of Mycobacterium tuberculosis and hookworm in humans. Infect Dis Poverty. 2015;4:20. doi: 10.1186/s40249-015-0046-0. [DOI] [PMC free article] [PubMed] [Google Scholar]
- 13.Ribeiro-Rodrigues R, Resende Co T, Rojas R, Toossi Z, Dietze R, Boom WH, Maciel E, Hirsch CS. A role for CD4+CD25+ T cells in regulation of the immune response during human tuberculosis. Clin Exp Immunol. 2006;144(1):25–34. doi: 10.1111/j.1365-2249.2006.03027.x. [DOI] [PMC free article] [PubMed] [Google Scholar]
- 14.Singh A, Dey AB, Mohan A, Sharma PK, Mitra DK. FOXP3+ regulatory T cells among tuberculosis patients: impact on prognosis and restoration of antigen specific IFN-gamma producing T cells. PLoS ONE. 2012;7(9):e44728. doi: 10.1371/journal.pone.0044728. [DOI] [PMC free article] [PubMed] [Google Scholar]
- 15.Geffner L, Basile JI, Yokobori N, Sabio YGC, Musella R, Castagnino J, Sasiain MC, de la Barrera S. CD4(+) CD25(high) forkhead box protein 3(+) regulatory T lymphocytes suppress interferon-gamma and CD107 expression in CD4(+) and CD8(+) T cells from tuberculous pleural effusions. Clin Exp Immunol. 2013;175(2):235–45. doi: 10.1111/cei.12227. [DOI] [PMC free article] [PubMed] [Google Scholar]
- 16.Chiacchio T, Casetti R, Butera O, Vanini V, Carrara S, Girardi E, Di Mitri D, Battistini L, Martini F, Borsellino G, Goletti D. Characterization of regulatory T cells identified as CD4(+)CD25(high)CD39(+) in patients with active tuberculosis. Clin Exp Immunol. 2009;156(3):463–70. doi: 10.1111/j.1365-2249.2009.03908.x. [DOI] [PMC free article] [PubMed] [Google Scholar]
- 17.Roberts T, Beyers N, Aguirre A, Walzl G. Immunosuppression during active tuberculosis is characterized by decreased interferon- gamma production and CD25 expression with elevated forkhead box P3, transforming growth factor-beta, and interleukin-4 mRNA levels. J Infect Dis. 2007;195(6):870–8. doi: 10.1086/511277. [DOI] [PubMed] [Google Scholar]
- 18.Miyara M, Yoshioka Y, Kitoh A, Shima T, Wing K, Niwa A, Parizot C, Taflin C, Heike T, Valeyre D, Mathian A, Nakahata T, Yamaguchi T, Nomura T, Ono M, Amoura Z, Gorochov G, Sakaguchi S. Functional delineation and differentiation dynamics of human CD4+ T cells expressing the FOXP3 transcription factor. Immunity. 2009;30(6):899–911. doi: 10.1016/j.immuni.2009.03.019. [DOI] [PubMed] [Google Scholar]
- 19.Sawant DV, Vignali DA. Once a Treg, always a Treg? Immunol Rev. 2014;259(1):173–91. doi: 10.1111/imr.12173. [DOI] [PMC free article] [PubMed] [Google Scholar]
- 20.Marin ND, Paris SC, Velez VM, Rojas CA, Rojas M, Garcia LF. Regulatory T cell frequency and modulation of IFN-gamma and IL-17 in active and latent tuberculosis. Tuberculosis. 2010;90(4):252–61. doi: 10.1016/j.tube.2010.05.003. [DOI] [PubMed] [Google Scholar]
- 21.Sakaguchi S, Miyara M, Costantino CM, Hafler DA. FOXP3+ regulatory T cells in the human immune system. Nat Rev Immunol. 2010;10(7):490–500. doi: 10.1038/nri2785. [DOI] [PubMed] [Google Scholar]
- 22.Huehn J, Beyer M. Epigenetic and transcriptional control of FOXP3+ regulatory T cells. Seminars Immunol. 2015;27(1):10–8. doi: 10.1016/j.smim.2015.02.002. [DOI] [PubMed] [Google Scholar]
- 23.Valmori D, Merlo A, Souleimanian NE, Hesdorffer CS, Ayyoub M. A peripheral circulating compartment of natural naive CD4 Tregs. J Clin Investig. 2005;115(7):1953–62. doi: 10.1172/JCI23963. [DOI] [PMC free article] [PubMed] [Google Scholar]
- 24.Battaglia M, Roncarolo MG. The fate of human Treg cells. Immunity. 2009;30(6):763–5. doi: 10.1016/j.immuni.2009.06.006. [DOI] [PubMed] [Google Scholar]
- 25.Green AM, Mattila JT, Bigbee CL, Bongers KS, Lin PL, Flynn JL. CD4(+) regulatory T cells in a cynomolgus macaque model of Mycobacterium tuberculosis infection. J Infect Dis. 2010;202(4):533–41. doi: 10.1086/654896. [DOI] [PMC free article] [PubMed] [Google Scholar]
- 26.Shafiani S, Tucker-Heard G, Kariyone A, Takatsu K, Urdahl KB. Pathogen-specific regulatory T cells delay the arrival of effector T cells in the lung during early tuberculosis. J Exp Med. 2010;207(7):1409–20. doi: 10.1084/jem.20091885. [DOI] [PMC free article] [PubMed] [Google Scholar]
- 27.Lim HJ, Park JS, Cho YJ, Yoon HI, Park KU, Lee CT, Lee JH. CD4(+)FOXP3(+) T regulatory cells in drug-susceptible and multidrug-resistantþtuberculosis. Tuberculosis. 2013;93(5):523–8. doi: 10.1016/j.tube.2013.06.001. [DOI] [PubMed] [Google Scholar]
- 28.Pesenacker Anne M, Bending David, Ursu Simona, Wu Qiong, Nistala Kiran, Wedderburn LR. CD161 defines the subset of FOXP3+ T cells capable of producing proinflammatory cytokines. Blood. 2013;121(14):2647–58. doi: 10.1182/blood-2012-08-443473. [DOI] [PMC free article] [PubMed] [Google Scholar]
- 29.Scott-Browne JP, Shafiani S, Tucker-Heard G, Ishida-Tsubota K, Fontenot JD, Rudensky AY, Bevan MJ, Urdahl KB. Expansion and function of FOXP3-expressing T regulatory cells during tuberculosis. J Exp Med. 2007;204(9):2159–69. doi: 10.1084/jem.20062105. [DOI] [PMC free article] [PubMed] [Google Scholar]
- 30.Kursar M, Koch M, Mittrücker H-W, Nouailles G, Bonhagen K, Kamradt T, Kaufmann SHE. Cutting edge: regulatory T cells prevent efficient clearance of Mycobacterium tuberculosis. J Immunol. 2007;178:2661–5. doi: 10.4049/jimmunol.178.5.2661. [DOI] [PubMed] [Google Scholar]
- 31.Quinn KM, McHugh RS, Rich FJ, Goldsack LM, de Lisle GW, Buddle BM, Delahunt B, Kirman JR. Inactivation of CD4+CD25+ regulatory T cells during early mycobacterial infection increases cytokine production but does not affect pathogen load. Immunol Cell Biol. 2006;84(5):467–74. doi: 10.1111/j.1440-1711.2006.01460.x. [DOI] [PubMed] [Google Scholar]
- 32.Quinn KM, Rich FJ, Goldsack LM, de Lisle GW, Buddle BM, Delahunt B, Kirman JR. Accelerating the secondary immune response by inactivating CD4(+)CD25(+) T regulatory cells prior to BCG vaccination does not enhance protection against tuberculosis. Eur J Immunol. 2008;38(3):695–705. doi: 10.1002/eji.200737888. [DOI] [PubMed] [Google Scholar]
- 33.Jaron B, Maranghi E, Leclerc C, Majlessi L. Effect of attenuation of Treg during BCG immunization on anti-mycobacterial Th1 responses and protection against Mycobacterium tuberculosis. PLoS ONE. 2008;3(7):e2833. doi: 10.1371/journal.pone.0002833. [DOI] [PMC free article] [PubMed] [Google Scholar]
- 34.Santegoets SJ, Dijkgraaf EM, Battaglia A, Beckhove P, Britten CM, Gallimore A, Godkin A, Gouttefangeas C, de Gruijl TD, Koenen HJ, Scheffold A, Shevach EM, Staats J, Tasken K, Whiteside TL, Kroep JR, Welters MJ, van der Burg SH. Monitoring regulatory T cells in clinical samples: consensus on an essential marker set and gating strategy for regulatory T cell analysis by flow cytometry. Cancer Immunol Immunother. 2015;64(10):1271–86. doi: 10.1007/s00262-015-1729-x. [DOI] [PMC free article] [PubMed] [Google Scholar]
Associated Data
This section collects any data citations, data availability statements, or supplementary materials included in this article.