Abstract
Although acknowledged to be variable and subjective, manual annotation of cryo-electron tomography data is commonly used to answer structural questions and to create a “ground truth” for evaluation of automated segmentation algorithms. Validation of such annotation is lacking, but is critical for understanding the reproducibility of manual annotations. Here, we used voxel-based similarity scores for a variety of specimens, ranging in complexity and segmented by several annotators, to quantify the variation among their annotations. In addition, we have identified procedures for merging annotations to reduce variability, thereby increasing the reliability of manual annotation. Based on our analyses, we find that it is necessary to combine multiple manual annotations to increase the confidence level for answering structural questions. We also make recommendations to guide algorithm development for automated annotation of features of interest.
Keywords: cryo-electron tomography, segmentation, annotation, validation, Dice coefficient
Introduction
The field of electron tomography (ET) has evolved from a theoretical aspiration (Hoppe, 1974a, 1974b) into an accepted tool for probing structure–function relationships in cells. ET is an imaging modality involving the collection of successive two-dimensional (2D) images of a 3D sample at various tilt angles, which are then computationally aligned and reconstructed into a 3D volume (tomogram) representative of the original sample. Historically, biological samples had to be fixed, dehydrated, stained, and embedded in resin in order to be imaged in the electron microscope. Ice embedding was developed to keep biological specimens in a frozen-hydrated state for electron microscopy (Taylor & Glaeser, 1974; Lepault et al., 1983). Recent advances in sample preparation methods, as well as new imaging technologies, have made the once impossible task of imaging intact mammalian cells by cryo-electron tomography (cryoET) a reality (Koning et al., 2008; Moussavi et al., 2010; Rigort et al., 2012; Rusu et al., 2012; Shahmoradian et al., 2014; Asano et al., 2015). However, both the imaging technique (cryoET) and the native environment of cells pose difficulties for the visualization and interpretation of tomographic data sets.
First, as a sufficiently thin sample (penetrable by an electron beam) is tilted in the electron microscope, it becomes thicker as the tilt angle increases, reducing the signal-to-noise ratio (SNR) of images at higher tilts. This also limits the maximum tilt angle, causing an artifact in the reconstructed tomogram commonly referred to as “the missing wedge,” due to the shape of its Fourier representation (Frangakis & Förster, 2004; Lučić et al., 2005, 2013; Sandberg, 2007). This missing wedge artifact leads to anisotropic resolution and blurring of information in real space along the beam direction. Practically speaking, in cellular tomography, this artifact renders some molecular features unobservable, and other features are of much lower resolution in the Z-direction (Lučić et al., 2005). Second, vitrified biological samples are sensitive to electron dose, which limits the number of electrons that can be used to image them, resulting in a low SNR for each individual image in a tilt series. This makes it difficult to distinguish features of interest from the background noise (Frangakis & Förster, 2004; Lučić et al., 2005, 2013; Sandberg, 2007). Third, the native intracellular environment is complex because of molecular crowding and the presence of pleomorphic and dynamic structures (Sandberg, 2007; Volkmann, 2010; Lučić et al., 2013). Together, these factors make it difficult to annotate cellular tomograms either manually or automatically.
Recent technological advances, namely automated data collection and processing, have made it possible to reconstruct hundreds of tomograms in a short period of time, with some published data sets containing over 2,600 tomograms (Zhao et al., 2013). The bottleneck for many cryoET studies lies in tomogram segmentation, a technique used to separate structurally complex tomograms into their individual components for visualization (Volkmann, 2010; Dai et al., 2013; Shahmoradian et al., 2013; Tsai et al., 2014; Darrow et al., 2015) or for quantification (Rigort et al., 2012; Rusu et al., 2012). To date, most cryoET studies involving intact mammalian cells have focused on annotating a single (or in some cases a few) macromolecular complex(es) (Koning et al., 2008; Maurer et al., 2008; Patla et al., 2010; Ibiricu et al., 2011; Gilliam et al., 2012; Shahmoradian et al., 2014; Woodward et al., 2014; Page et al., 2015; Wang et al., 2015).
Several software packages have been developed to semi-automate or fully automate the process of segmentation (Volkmann, 2002; Nguyen & Ji, 2008; Moussavi et al., 2010; Martinez-Sanchez et al., 2011, 2013; Rigort et al., 2012). Many of these programs were developed for high-SNR negative stain data sets and when applied to cryoET data they tend to perform poorly. Other software packages have been specifically developed to work with cryoET data sets, and while they successfully annotate a particular data set, there are difficulties in broadly applying the algorithms to a variety of data sets, especially for native cellular environments. For these reasons, many research groups still choose to manually segment their data.
It has been estimated that the time to manually segment an entire pancreatic β cell, imaged with ET, would exceed 75 man-years, and therefore the comparison between a disease and non-disease state would take hundreds of years, effectively making this kind of analysis impossible (Volkmann, 2010). In addition to being time-consuming, it is generally well accepted in the cryoET field that manual segmentation is error-prone, subjective and variable (Lučić et al., 2005, 2013; Sandberg, 2007; Volkmann, 2010; Tsai et al., 2014).
In spite of these limitations, manual segmentation is still commonly used in cryoET to visualize biological data sets, to quantify cellular features, and as a “ground truth” for comparison with automatic segmentation. It is critical to understand the variability inherent in manual segmentation in order to determine the role it should play in structural biology research. Numerous studies have used manual annotations to make comparisons with various automated segmentation algorithms (Garduño et al., 2008; Nguyen & Ji, 2008; Rigort et al., 2012; Rusu et al., 2012). Many groups have taken this a step further by evaluating the use of manual annotations as a good “ground truth”. For example, Garduño et al. (2008) showed that the variability (precision measurement) between three separate manual annotations of plastic-embedded, heavy-metal stained, spiny dendrites was on average 84.92% and as low as 83.99%. Rigort et al. (2012), working with cryoET data of actin filaments, merged three separate expert manual annotations to create a “ground truth” and then compared each individual manual annotation with this “ground truth”, reporting a correspondence between 65 and 81%. Moussavi et al. (2010) took yet another approach, comparing two manual annotations of bacterial cell membrane with a “ground truth”, which was generated by fitting an ellipse to a manual annotation, noting a variation of ~9 nm on average between points on the fitted ellipse and points on the manual annotations.
Because of the various non-comparable methods employed, the small number of annotations carried out using each method, and the use of a single representative cellular feature in each study, it is necessary to conduct a more comprehensive analysis of the variation present in manual annotations. Here, we quantify variation in manual segmentations across cellular features of varying difficulty (microtubule, mitochondria, and actin), with four to seven annotators per sample, using voxel-based segmentation, where overlap is calculated voxel by voxel, as opposed to a line-based approach where overlap is determined by the presence or absence of a line. In addition, we measure the variability of manual segmentation of actin performed a second time by the same annotators a year later. Using these data sets, we identify common types of discrepancy between annotations and discuss their implications for cryoET. We also compare a recently published semi-automated actin segmentation algorithm to our manual segmentations. Lastly, we demonstrate a significant improvement in minimizing variability by implementing a new method for merging of manual annotations.
Materials and Methods
Acetone-cleaned gold EM grids with a thin carbon film (Quantifoil, R2/2, Großlöbichau, Germany) were sterilized with ethanol and coated with fibronectin at a final concentration of 10 μg/mL for 5 min. Trypsinized mouse embryonic fibroblast (MEF) cells were re-suspended in Ringer’s solution (150 mM NaCl, 5 mM KCl, 1 mM CaCl2, 1 mM MgCl2, 20 mM HEPES) at pH 7.4 containing 25 μM Rho kinase inhibitor (Y27632, Calbiochem, Darmstadt, Germany) and incubated for 30 min at 37°C and 5% CO2. MEF cells were added to fibronectin-coated EM grids at a final concentration of 50,000 cells/mL and incubated at 37°C and 5% CO2 until lamellipodia formation was visually observed by light microscopy (8–45 min). The sample was then washed in Ringer’s solution, 15 nm bovine serum albumin (BSA)-coated gold fiducials were applied to the grid, and the grid was plunge frozen (EM GP, Leica, Wetzlar, Germany).
U2OS cell culture and grid preparation was based on Maimon et al. (2012) with slight modifications. Briefly, gold EM grids with SiO2 thin film (Quantifoil, R1/4) were ethanol sterilized and plasma cleaned for 10 s (Solarus Model 950, Gatan, Pleasanton, CA, USA). U2OS cells were cultured on the grids for ~36 h at 37°C and 5% CO2. The sample was then washed in phosphate buffered saline (PBS), 15 nm BSA-coated gold fiducials were applied to the grid, and the grid was plunge frozen (Leica EM GP).
Tilt series were collected from ±55° with a step size of 4° using a JEM2100 (JOEL, Tokyo, Japan) with a Gatan US4000 CCD camera (model 895, Gatan, Pleasanton, CA, USA) at 12,000 × magnification (9.6 Å/pixel sampling) with a total dose of ~70 e/Å2. Tilt series were reconstructed using IMOD (Kremer et al., 1996) and regions of interest from two tomograms were selected (Fig. 1b, Supplementary Movie 1, EMD-8173; Fig. 1d, Supplementary Movie 2, EMD-8174) and annotated using Amira or Avizo (http://fei.com) with Wacom tablets. Four unique annotators segmented the mitochondria data set for U2OS cells (EMD-8174), whereas seven operators annotated the actin (EMD-8173) and microtubule (EMD-8173) data sets for MEF cells. Annotators were provided with previously published cryoET examples of the features to be annotated and if necessary, a tutorial on using the annotation software in advance. Where noted, experts are defined as having at least one year of experience in segmenting cellular features from cryoET data. Three annotators re-segmented the same actin data set one year later. Some annotators chose to filter the actin or mitochondria data sets using various methods such as nonlinear anisotropic diffusion (NAD) filtering in IMOD (Frangakis & Hegerl, 2001), mean or median filtering in pyCoAn (Volkmann, 2002; van der Heide et al., 2007), or low-pass filtering in EMAN2 (Tang et al., 2007).
Figure 1.
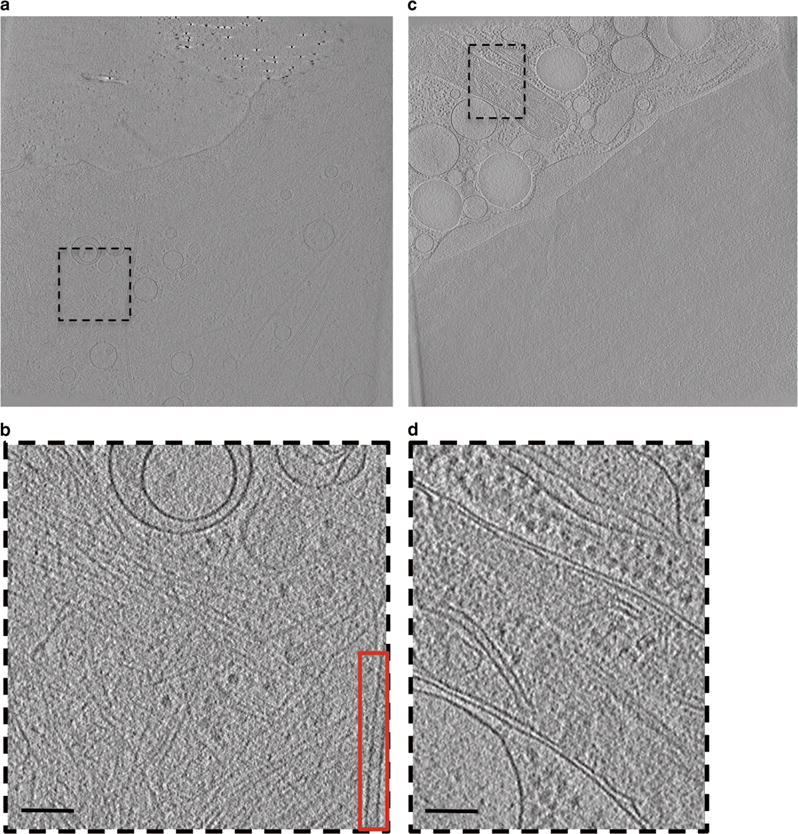
Raw cellular tomograms including features to be annotated. Single slices through raw tomograms of intact mammalian cells (a,c). Boxed regions in (a) and (c) represent areas of interest selected for annotation (displayed in b,d). Actin and a single microtubule were annotated from (b) and red inset respectively, whereas mitochondria was annotated from (d). Scale bars are 100 nm.
Annotations were first analyzed using the arithmetic module in ZIBAmira (Rigort et al., 2012) with the following equation:
where a and b are two different, binary segmentations. This quantifies the number of voxels assigned exclusively to a, exclusively to b, or shared by both. Using these outputs, similarity scores were calculated as pairwise Dice coefficients (Fig. 2a) as in the following equation:
Similarity between more than two segmentations was computed using a modified Dice coefficient (Fig. 2b; shown for triplets but extendable to quartets, quintets, and sextets):
where |A| is the cardinality of voxels (the segmented voxels) in one segmentation and A′ its complement (non-segmented voxels). This can be thought of as the intersection between each set of two circles and the intersection of all circles in a Venn diagram (Fig. 2). Essentially, each voxel that is common between annotations is counted once for each annotation that contains it, hence the multipliers that are required in the numerator. In both equations (the Dice coefficient and the modified Dice coefficient), the output ranges between 0 and 1 (i.e., 0–100% similarity), where the value corresponds to the percentage of voxels that have been segmented by at least two people.
Figure 2.
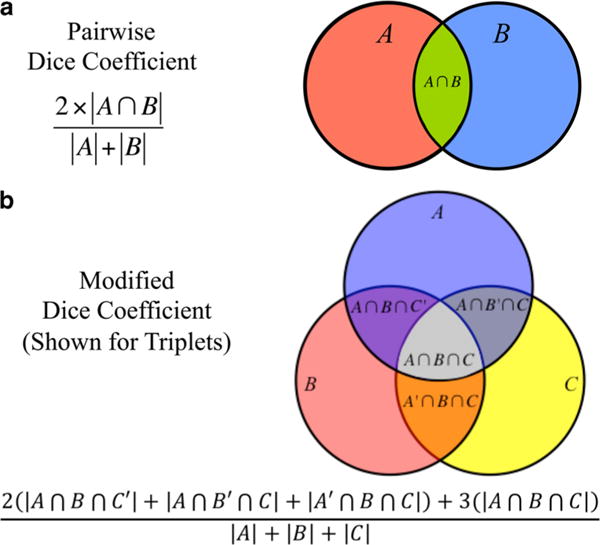
Summary of Dice coefficient usage. Dice coefficient is a pairwise similarity score that we used to calculate overlap between two separate segmentations. This concept can be represented mathematically by the equations given and visually by a pairwise Venn diagram (a). In order to compare more than two segmentations at once, the Dice coefficient was modified to include all regions of overlap. An example equation and visualization is shown for a triplet comparison (b), but was extended up to sextets.
The microtubule and mitochondria segmentations were analyzed using the pairwise Dice coefficient, whereas the actin segmentations were further grouped into all possible sets of unique pairs (n = 21), triplets (n = 35), quartets (n = 35), quintets (n = 21), and sextets (n = 7; Supplementary Table 1). The Dice coefficient (Fig. 2a) was computed for pairs, whereas the modified Dice coefficient (Fig. 2b) was computed for the triplet and larger sets.
For our second analysis, all the unique pair (n = 21) and triplet (n = 35) sets of actin were merged. Each of the merged sets was then computationally modified to remove voxels that were selected by only one annotator (Fig. 3). These new modified merged sets are described by the following two terms: “Pairs Drop One” refers to the voxels agreed upon by both annotators in the merged pair sets; “Triplets Drop One” refers to voxels agreed upon by at least two annotators in the merged triplet sets. Using these merged and modified data sets as input, we computed the similarity of mutually exclusive sets using the pairwise Dice coefficient (Supplementary Table 2). As there were seven annotations of actin, mutually exclusive pairs involving more than three annotations were not possible.
Figure 3.
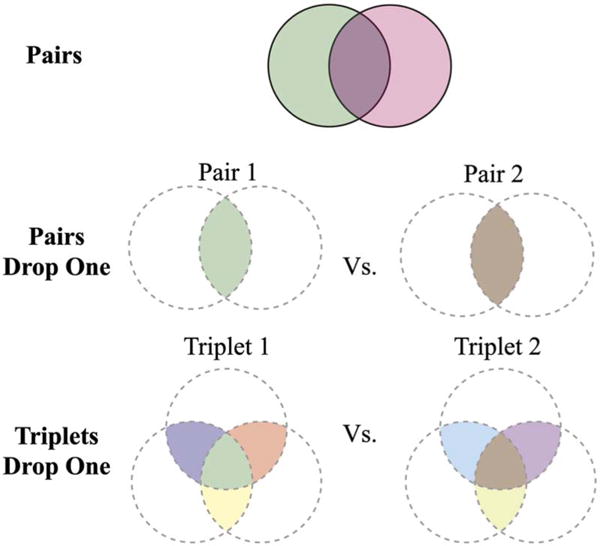
Schematic representation of pairs, Pairs Drop One, and Triplets Drop One. Pairwise Dice coefficient scores were calculated between two unmodified annotations (top row). In addition, two sets of modified annotations were created by either merging two of the original annotations and keeping only those voxels that were agreed upon by both of the annotators (Pairs Drop One; middle row) or merging three of the original annotations and keeping only those voxels that were agreed upon by at least two annotators (Triplets Drop One; bottom row). In both cases, the Dice coefficient was used in a pairwise fashion to compare the newly modified annotations.
In all box and whisker plots, the whiskers represent the minimum and maximum data present, and the diamonds represent the average. Unpaired t-tests in GraphPad (GraphPad QuickCalcs, 2015) were used to determine the statistical difference between Dice coefficients generated during this analysis. Where average similarity scores are presented, standard deviations are reported.
Results
Three common subcellular components (microtubules, mitochondria, and actin filaments; Fig. 1) were chosen for our study based on several considerations, such as their SNR, ease of recognition by direct visualization, and structural complexity. Combined, these considerations produce an increasing level of difficulty from microtubules to mitochondria to actin. Because of their consistent and characteristic features, microtubules are easily recognized and annotatable (Fig. 4a). The outer membranes of mitochondria have high contrast; however, the cristae generally have lower contrast, together producing a sample with intermediate annotation difficulty (Fig. 4b). Finally, the low contrast, abundance, and lack of characteristic structural features to distinguish actin from other cytoskeleton filaments make their annotation a subjective and difficult task (Fig. 4c). The variation between all annotations of the same sample was visualized using a coloring system where red represents the most agreed upon voxels and purple represents the least agreed upon voxels (Fig. 4). The qualitative descriptions of sample difficulty outlined above were reflected in the similarity scores for each sample (Fig. 5). Specifically, microtubules showed the most agreement, with an average voxel-based similarity of 69 ± 5%, whereas mitochondria have an average similarity of 43 ± 9% and actin of only 27 ± 6%. When the same annotator segmented the same actin data set after one year, the agreement was between 29 and 54%, which was more consistent than the agreement between two different annotators.
Figure 4.
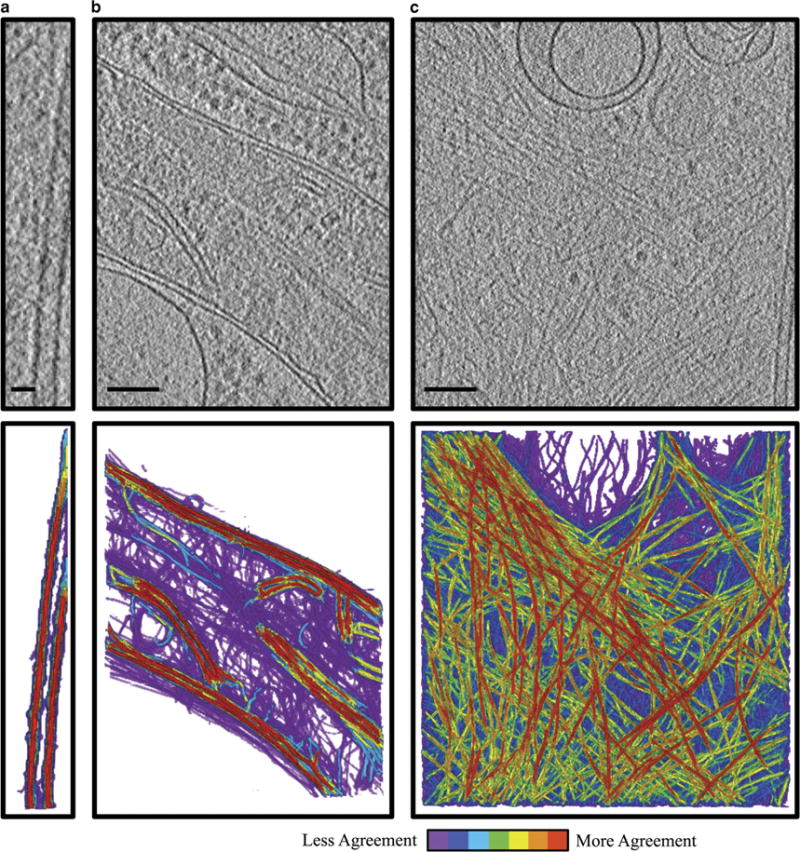
Summation of annotations demonstrates inherent variability between annotations of the same feature. Projection images through ~180 nm slabs from a tomogram of intact mammalian cells (top) and merged annotations of each feature of interest (bottom). Red indicates voxels that were selected by all of the annotators, whereas purple indicates voxels that were selected by a single annotator (n = 7 for microtubule and actin, n = 4 for mitochondria). Note that purple indicates voxels from multiple individuals’ annotations, which have no agreement with anyone else’s annotations. Microtubules, a high contrast, easily annotated sample, show high agreement between annotators (a). Mitochondria, an intermediate sample with variations in contrast between outer membrane and cristae, shows some regions of high agreement, mainly at the outer membrane, and some of low, mainly in the dense regions internal to the mitochondria (b). Actin, a low contrast, difficult to annotate sample, shows many regions of low agreement (c). Scale bar is 25 nm for (a), Scale bar is 100 nm for (b) and (c).
Figure 5.
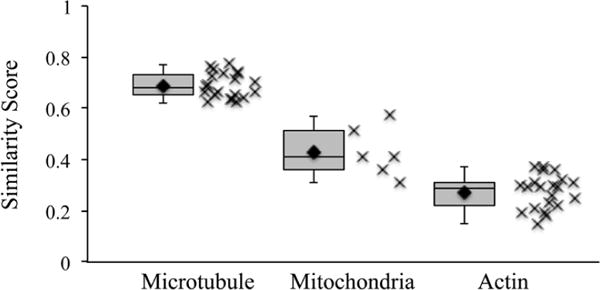
The mean similarity score is dependent on the complexity of the feature being annotated. Box and whisker, and scatter plots of pairwise, voxel-based similarity scores for various samples. The average similarity scores are 69 ± 5, 43 ± 9, and 27 ± 6% for microtubules, mitochondria, and actin, respectively. Because of the high contrast and simplicity of microtubules, they represent a best-case scenario.
Upon visual analysis of the various annotations, it became clear that multiple types of discrepancy contributed to a lower similarity score, across all samples. Five common types of error were identified. First is a type of error that is specific to actin, where annotators treated branch points differently (Fig. 6a). Second, incidental overlap occurs between two annotators who annotated completely different features that happen to overlap by chance when compared (Fig. 6b). Third, width variations in the final annotations are caused by the annotators’ choice of “brush size” in the segmentation software (Fig. 6c). Fourth, length variations are due to person-to-person differences in deciding where an object ends (Fig. 6d). Fifth, missing data can occur when there are ambiguities in the connectivity of an object (Fig. 6e). Many of these error types are generally considered minor because the annotators agree that a feature is present, but disagree on the details of the feature, such as its length or connectivity, etc. However, incidental overlap stands out in contrast to this, representing complete disagreement between annotators on the presence or absence of a feature. Although many of these discrepancies are present throughout all samples annotated, incidental overlap is most commonly found in the more complex samples, with lower SNR.
Figure 6.
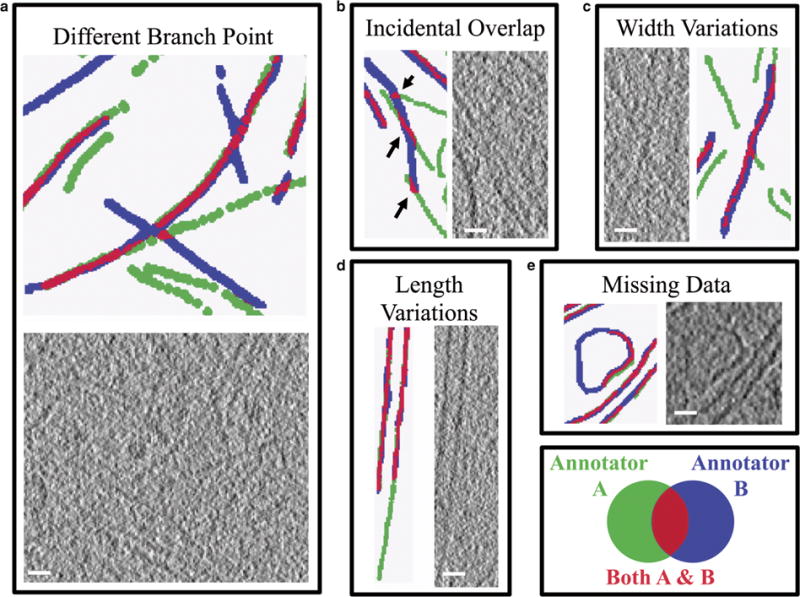
Five common types of discrepancy in annotation of cellular features. Subjective choices made by each annotator lead to inconsistencies in the final annotation both visually and quantitatively. Subjectivity during segmentation of various features within the data leads to different actin branch points (a), incidental overlap (b; black arrows), length variations (d), and missing data (e), whereas annotation pen size can lead to width variations (c). In most cases, small variations occur in segmenting the same features (c–e), but in some cases, large variations occur when disparate features are segmented and happen to overlap (a,b). Green indicates voxels in one annotation, blue indicates voxels in a second annotation, and red indicates voxel agreement between the two annotations. Examples (a), (b), and (c) are from actin, whereas (d) is from microtubule and (e) is from mitochondria, however, it is important to note that excluding (a), these discrepancies can be found in all of the cellular features being annotated. Scale bars are 25 nm.
In order to relate our results to previously published results, we processed the actin data set using the semi-automated actin annotation software in ZIBAmira, and also used an expert, manual merging method (Rigort et al., 2012). In both cases, we find these methods perform similarly when used on our data. It is important to note that our similarity scores are lower due to the use of voxel-based metrics as opposed to line-based metrics. A composite annotation was created from three annotations of actin, performed independently by our three experts, with no further modifications. Each individual annotation was then compared with the composite data set (Figs. 7a–7d). This is comparable with the methodology used by various groups to create a “ground truth” for comparison with automated annotation software (Garduño et al., 2008; Nguyen & Ji, 2008; Moussavi et al., 2010; Rigort et al., 2012; Rusu et al., 2012). Using the Dice coefficient as a stringent test of agreement, we find that the individual, expert annotations agree with the composite data set from 38 to 57%. Next, the semi-automated actin annotation was compared with the seven manual annotations using the Dice coefficient as a similarity score (Fig. 7e). On average, the semi-automated annotation displayed 30 ± 5% agreement with the individual manual annotations, which is not statistically significantly different when compared with the average Dice coefficient of the manual annotations. Importantly, we also found that the operators do not need high levels of background experience in either biology or annotation software. The annotations here were carried out by a mixture of both biological and Avizo novices and experts, with no discernable differences when comparing similarity scores (data not shown).
Figure 7.
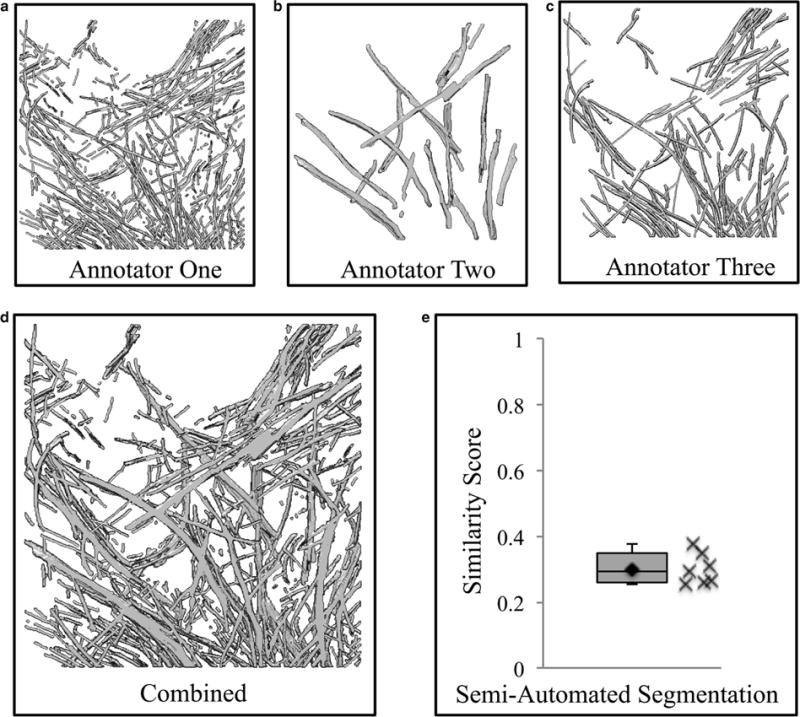
Voxel-based similarity scores are comparable with previously published similarity results. To recreate the similarity results previously reported, but in terms of voxel-based similarity, three expert annotations of actin were merged (d) and each individual annotation (a–c) was then compared in a pairwise fashion with the combined data set. The individual annotations ranged from 38 to 57% in their similarity to the combined data set, a similar range as previously reported (Rigort et al., 2012). Voxel-based similarity scores (Dice coefficient) between a semi-automated annotation using ZIBAmira and seven manual actin segmentations show 30 ± 5% agreement, indicating the semi-automated annotation software is performing in the range of manual annotations (e).
In the interest of reducing the variability among manual annotations, we have combinatorially merged unique sets of either two or three actin annotations, computationally removed the voxels that were chosen by only one annotator, and again used Dice coefficients to compare all unique modified sets of pairs or triplets (Pairs Drop One and Triplets Drop One, respectively). Using these merging and comparing methods, the similarity scores for the Pairs Drop One comparisons decreased significantly (p < 0.0001), when compared with the mean pairs similarity score, with an average score of 20 ± 4% (Fig. 8). However, the similarity scores for the Triplets Drop One increased significantly (p < 0.0001) when compared with the mean pairs similarity score, with an average agreement of 36 ± 3% (Fig. 8).
Figure 8.
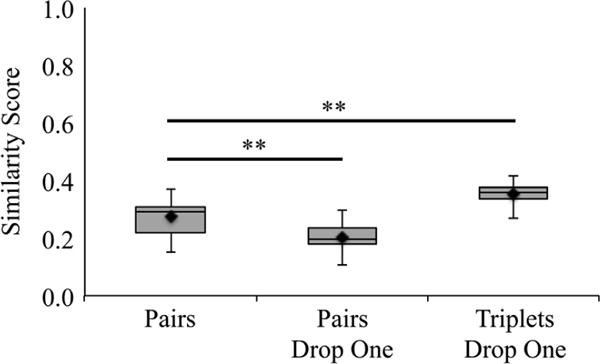
Merging annotations and removing questionable voxels improves variability. To improve similarity and decrease variability, actin annotations were merged in two different ways. Pairs Drop One keeps only the voxels agreed upon by both annotations in each pair, whereas Triplets Drop One keeps the voxels agreed upon by at least two annotations in each triplet. In both cases, the kept voxels are then compared with another similarly merged data set using a pairwise Dice coefficient similarity score. When compared with the average pairs Dice coefficient, dropping the voxels that are not agreed upon by both pairs of modified merged annotations significantly decreases the similarity (right). However, applying a similar methodology to merged sets of triplets significantly improves the variability of merged sets of triplets when compared with pairs. **p < 0.0001.
To identify a more robust method for generation of a “ground truth”, the seven manual actin annotations were categorized into all possible unique pairs triplets, quartets, quintets, and sextets. These sets were assessed for agreement using the Dice or modified Dice coefficient as a similarity score, as described in the Materials and Methods section. Using these measures, it is clear that agreement increases with the number of annotations included (Fig. 9). As more annotations are added, the improvements in similarity score are statistically significant (p < 0.0001). However, the statistical significance of the change in similarity score is smaller between quintets and sextets (p < 0.05).
Figure 9.
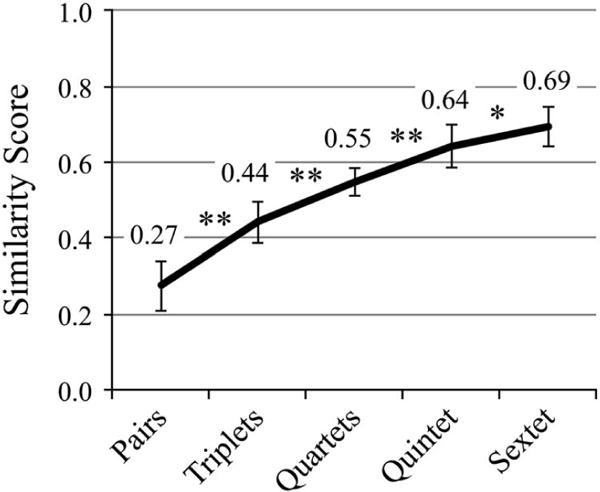
Including more annotations improves variability, to a point. Using the seven manual actin annotations, every unique combination of pairs through sextets was created and sampled to determine the number of voxels in agreement with at least one other annotation. As more annotations are included, this metric increases significantly with each addition, beginning to plateau between quintet and sextet groups. *p < 0.05, **p < 0.0001.
Discussion
It is well known in the cryoET field that manual segmentation is highly variable. In this study, we have systematically evaluated the variability of manual segmentation using three different samples (microtubules, mitochondria, and actin) and a higher number of annotations than previous studies (n = 7, 4, 7, respectively). Based on these manual annotations, we have identified average Dice coefficient-based similarity scores for each sample and for the same annotator after one year with a difficult sample. This has allowed us to assess the reproducibility of manual annotation by various annotators across samples, and also by the same annotator over time. In addition, we have identified various types of discrepancy between manual annotations.
When measuring the similarity of manual segmentations two main approaches have been used previously. First, in line-based segmentations, each object is represented by a line or series of lines. A similarity score is then calculated by comparing how many of these lines are in the same position with a similar length. Repeated measurements can be taken using the same or different annotators. Generally, agreement on both line placement and length are given a margin of error, meaning two lines are not required to exactly overlap for them to be considered representative of the same data. Because of this, line-based comparisons can be less stringent and yield a higher similarity score. The second measure, voxel-based similarity, is much more stringent, requiring each annotation to include the exact same voxels in order to receive a 100% similarity score. Even if two annotations include the same feature of interest, small variations caused by operator choices, unsteady hands, etc., can lead to a reduction in the overall similarity score. For our analysis we use the voxel-based method, as opposed to the line-based method, to minimize ambiguity. However, this causes the similarity scores presented in this study to be generally lower than in other studies that have used line-based methods for calculating similarity (Fig. 7).
The goal of this study was to assess the extent of variability when multiple people were given the same data set and asked to segment a certain feature of interest. Each operator was allowed to make subjective choices when annotating a tomogram. The voxel-based measurement approach captures the differing effects of individual choices. Some of this variability can be addressed by standardizing certain annotation choices by lab or annotation group. For example, the pen width chosen by each operator can have a major effect on the agreement between the final annotations, but can be easily standardized. Additional parameters that could impact the results are the magnification at which the annotation is performed, and any pre-annotation binning and/or filtering of the tomogram.
To put this study in context with the previous literature, we first compared our baseline similarity scores with the previously published method for semi-automatic segmentation and evaluation of agreement and variability. When three expert actin annotations were merged, a line-based correspondence of each individual annotation to the merged data set of between 65 and 81% was found (Rigort et al., 2012). Further, using ZIBAmira, a semi-automated segmentation program, yielded a similar result of 60% correspondence compared with the merged data set (Rigort et al., 2012). As expected, the voxel-based similarity score used here is lower than the line-based methods. However, the range of agreement between each individual “expert” annotation of actin and the merged annotation is similar (38–57%) as compared with previously published results (65–81%; Rigort et al., 2012). The data presented here spans 19% points, and is generally ~25% points lower in the voxel-based approach (Fig. 7). This indicates that the manual annotations presented here are in agreement with both the semi-automated actin annotation software and with previously published manual annotations.
We tested two methods for reducing the variability in annotation. In the first method, we merged the annotations in sets of either pairs or triplets and removed the voxels that were not agreed upon by at least two annotators (Fig. 3). This merging method showed some promise, producing significantly higher similarity scores in the triplet sets (Fig. 8). However, calculating the value of including more annotations (i.e., testing larger, mutually exclusive groupings) would require an even larger annotation data set.
In the second method, we computed similarity scores between pairs, triplets, quartets, and sextets of the actin annotations to quantify the improvement in variability gained from adding additional annotators (Fig. 9). As discussed previously, we measured low variability among annotations for the microtubule, whereas variability for actin was relatively high. We found that actin annotation requires six separate annotators to achieve the level of consistency seen with the microtubule (69%). Thus, the merging of at least six separate annotations, only including voxels agreed upon by two or more annotators, may be appropriate for creating a “ground truth”. This ground truth might be appropriate for algorithm development, because the high cost (i.e., human hours) is justified by its reliability and reusability. However, due to time, money, and sanity constraints, six separate manual annotations is not feasible for biological studies that require more than a few tomograms. In this case, three annotations may be sufficient as the improvement in similarity scores is largest between two and three annotators and diminishes thereafter (Fig. 9). Therefore, this may be an adequate compromise.
Conclusions
In summary, manual annotations will never be perfect representations of the data, but combining multiple manual annotations can better approximate the truth, yielding more precise results. Depending on the purpose, more or fewer of these manual annotations should be used. In general, the number of annotators should be chosen based on a balance between improvements in consistency versus sample difficulty and granularity of the biological question. Our approach, including multiple methods of similarity assessment and multiple annotators, is a first step toward developing validation protocols for annotation in cryoET.
Supplementary Material
Supplementary Movies 1 and 2
Supplementary Movies 1 and 2 can be found online. Please visit journals.cambridge.org/jid_MAM
Supplementary Table 1
Supplementary Table 1 can be found online. Please visit journals.cambridge.org/jid_MAM
Supplementary Table 2
Supplementary Table 2 can be found online. Please visit journals.cambridge.org/jid_MAM
Acknowledgments
This research was supported by NIH grants (P41GM103832, PN2EY016525, R01GM079429), Robert Welch Foundation (Q1242), Ovarian Cancer Research Fund (5-258813), and a training CCBTP fellowship to J.G.G-M (RP140113).
References
- Asano S, Fukuda Y, Beck F, Aufderheide A, Förster F, Danev R, Baumeister W. Proteasomes. A molecular census of 26S proteasomes in intact neurons. Science. 2015;347:439–442. doi: 10.1126/science.1261197. [DOI] [PubMed] [Google Scholar]
- Dai W, Fu C, Raytcheva D, Flanagan J, Khant HA, Liu X, Rochat RH, Haase-Pettingell C, Piret J, Ludtke SJ, Nagayama K, Schmid MF, King JA, Chiu W. Visualizing virus assembly intermediates inside marine cyanobacteria. Nature. 2013;502:707–710. doi: 10.1038/nature12604. [DOI] [PMC free article] [PubMed] [Google Scholar]
- Darrow MC, Sergeeva OA, Isas JM, Galaz-Montoya J, King JA, Langen R, Schmid MF, Chiu W. Structural mechanisms of mutant huntingtin aggregation suppression by synthetic chaperonin-like CCT5 complex explained by cryo-electron tomography. J Biol Chem. 2015;290:17451–17461. doi: 10.1074/jbc.M115.655373. [DOI] [PMC free article] [PubMed] [Google Scholar]
- Frangakis AS, Förster F. Computational exploration of structural information from cryo-electron tomograms. Curr Opin Struct Biol. 2004;14:325–331. doi: 10.1016/j.sbi.2004.04.003. [DOI] [PubMed] [Google Scholar]
- Frangakis AS, Hegerl R. Noise reduction in electron tomographic reconstructions using nonlinear anisotropic diffusion. J Struct Biol. 2001;135:239–250. doi: 10.1006/jsbi.2001.4406. [DOI] [PubMed] [Google Scholar]
- Garduño E, Wong-Barnum M, Volkmann N, Ellisman MH. Segmentation of electron tomographic data sets using fuzzy set theory principles. J Struct Biol. 2008;162:368–379. doi: 10.1016/j.jsb.2008.01.017. [DOI] [PMC free article] [PubMed] [Google Scholar]
- Gilliam JC, Chang JT, Sandoval IM, Zhang Y, Li T, Pittler SJ, Chiu W, Wensel TG. Three-dimensional architecture of the rod sensory cilium and its disruption in retinal neurodegeneration. Cell. 2012;151:1029–1041. doi: 10.1016/j.cell.2012.10.038. [DOI] [PMC free article] [PubMed] [Google Scholar]
- GraphPad QuickCalcs. GraphPad QuickCalcs: T test calculator. 2015 Available at http://www.graphpad.com/quickcalcs/ttest1.cfm (retrieved July 6, 2015)
- Hoppe W. Three-demensional electron microscopic reconstruction of an object. Naturwissenschaften. 1974a;61:534–536. doi: 10.1007/BF00606513. [DOI] [PubMed] [Google Scholar]
- Hoppe W. Towards three-dimensional “electron microscopy” at atomic resolution. Naturwissenschaften. 1974b;61:239–249. doi: 10.1007/BF00595655. [DOI] [PubMed] [Google Scholar]
- Ibiricu I, Huiskonen JT, Döhner K, Bradke F, Sodeik B, Grünewald K. Cryo electron tomography of herpes simplex virus during axonal transport and secondary envelopment in primary neurons. PLoS Pathog. 2011;7:e1002406. doi: 10.1371/journal.ppat.1002406. [DOI] [PMC free article] [PubMed] [Google Scholar]
- Koning RI, Zovko S, Bárcena M, Oostergetel GT, Koerten HK, Galjart N, Koster AJ, Mieke Mommaas A. Cryo electron tomography of vitrified fibroblasts: Microtubule plus ends in situ. J Struct Biol. 2008;161:459–468. doi: 10.1016/j.jsb.2007.08.011. [DOI] [PubMed] [Google Scholar]
- Kremer JR, Mastronarde DN, Mcintosh JR. Computer visualization of three-dimensional image data using IMOD. J Struct Biol. 1996;116:71–76. doi: 10.1006/jsbi.1996.0013. [DOI] [PubMed] [Google Scholar]
- Lepault J, Booy FP, Dubochet J. Electron microscopy of frozen biological suspensions. J Microsc. 1983;129:89–102. doi: 10.1111/j.1365-2818.1983.tb04163.x. [DOI] [PubMed] [Google Scholar]
- Lučić V, Förster F, Baumeister W. Structural studies by electron tomography: From cells to molecules. Annu Rev Biochem. 2005;74:833–865. doi: 10.1146/annurev.biochem.73.011303.074112. [DOI] [PubMed] [Google Scholar]
- Lučić V, Rigort A, Baumeister W. Cryo-electron tomography: The challenge of doing structural biology in situ. J Cell Biol. 2013;202:407–419. doi: 10.1083/jcb.201304193. [DOI] [PMC free article] [PubMed] [Google Scholar]
- Maimon T, Elad N, Dahan I, Medalia O. The human nuclear pore complex as revealed by cryo-electron tomography. Structure. 2012;20:998–1006. doi: 10.1016/j.str.2012.03.025. [DOI] [PubMed] [Google Scholar]
- Martinez-Sanchez A, Garcia I, Fernandez JJ. A differential structure approach to membrane segmentation in electron tomography. J Struct Biol. 2011;175:372–383. doi: 10.1016/j.jsb.2011.05.010. [DOI] [PubMed] [Google Scholar]
- Martinez-Sanchez A, Garcia I, Fernandez JJ. A ridge-based framework for segmentation of 3D electron microscopy datasets. J Struct Biol. 2013;181:61–70. doi: 10.1016/j.jsb.2012.10.002. [DOI] [PubMed] [Google Scholar]
- Maurer UE, Sodeik B, Grünewald K. Native 3D intermediates of membrane fusion in herpes simplex virus 1 entry. Proc Natl Acad Sci U S A. 2008;105:10559–10564. doi: 10.1073/pnas.0801674105. [DOI] [PMC free article] [PubMed] [Google Scholar]
- Moussavi F, Heitz G, Amat F, Comolli LR, Koller D, Horowitz M. 3D segmentation of cell boundaries from whole cell cryogenic electron tomography volumes. J Struct Biol. 2010;170:134–145. doi: 10.1016/j.jsb.2009.12.015. [DOI] [PubMed] [Google Scholar]
- Nguyen H, Ji Q. Shape-driven three-dimensional watersnake segmentation of biological membranes in electron tomography. IEEE Trans Med Imaging. 2008;27:616–628. doi: 10.1109/TMI.2007.912390. [DOI] [PubMed] [Google Scholar]
- Page C, Hanein D, Volkmann N. Accurate membrane tracing in three-dimensional reconstructions from electron cryotomography data. Ultramicroscopy. 2015;155:20–26. doi: 10.1016/j.ultramic.2015.03.021. [DOI] [PMC free article] [PubMed] [Google Scholar]
- Patla I, Volberg T, Elad N, Hirschfeld-Warneken V, Grashoff C, Fässler R, Spatz JP, Geiger B, Medalia O. Dissecting the molecular architecture of integrin adhesion sites by cryo-electron tomography. Nat Cell Biol. 2010;12:909–915. doi: 10.1038/ncb2095. [DOI] [PubMed] [Google Scholar]
- Rigort A, Günther D, Hegerl R, Baum D, Weber B, Prohaska S, Medalia O, Baumeister W, Hege HC. Automated segmentation of electron tomograms for a quantitative description of actin filament networks. J Struct Biol. 2012;177:135–144. doi: 10.1016/j.jsb.2011.08.012. [DOI] [PubMed] [Google Scholar]
- Rusu M, Starosolski Z, Wahle M, Rigort A, Wriggers W. Automated tracing of filaments in 3D electron tomography reconstructions using Sculptor and Situs. J Struct Biol. 2012;178:121–128. doi: 10.1016/j.jsb.2012.03.001. [DOI] [PMC free article] [PubMed] [Google Scholar]
- Sandberg K. Methods for image segmentation in cellular tomography. Methods Cell Biol. 2007;79:769–798. doi: 10.1016/S0091-679X(06)79030-6. [DOI] [PubMed] [Google Scholar]
- Shahmoradian SH, Galaz-Montoya JG, Schmid MF, Cong Y, Ma B, Spiess C, Frydman J, Ludtke SJ, Chiu W. TRiC’s tricks inhibit huntingtin aggregation. eLife. 2013;2:e00710. doi: 10.7554/eLife.00710. [DOI] [PMC free article] [PubMed] [Google Scholar]
- Shahmoradian SH, Galiano MR, Wu C, Chen S, Rasband MN, Mobley WC, Chiu W. Preparation of primary neurons for visualizing neurites in a frozen-hydrated state using cryo-electron tomography. J Vis Exp. 2014;84:e50783. doi: 10.3791/50783. [DOI] [PMC free article] [PubMed] [Google Scholar]
- Tang G, Peng L, Baldwin PR, Mann DS, Jiang W, Rees I, Ludtke SJ. EMAN2: An extensible image processing suite for electron microscopy. J Struct Biol. 2007;157:38–46. doi: 10.1016/j.jsb.2006.05.009. [DOI] [PubMed] [Google Scholar]
- Taylor KA, Glaeser RM. Electron diffraction of frozen, hydrated protein crystals. Science. 1974;186:1036–1037. doi: 10.1126/science.186.4168.1036. [DOI] [PubMed] [Google Scholar]
- Tsai WT, Hassan A, Sarkar P, Correa J, Metlagel Z, Jorgens DM, Auer M. From voxels to knowledge: A practical guide to the segmentation of complex electron microscopy 3D-data. J Vis Exp. 2014;90:e51673. doi: 10.3791/51673. [DOI] [PMC free article] [PubMed] [Google Scholar]
- Van der Heide P, XU XP, Marsh BJ, Hanein D, Volkmann N. Efficient automatic noise reduction of electron tomographic reconstructions based on iterative median filtering. J Struct Biol. 2007;158:196–204. doi: 10.1016/j.jsb.2006.10.030. [DOI] [PubMed] [Google Scholar]
- Volkmann N. A novel three-dimensional variant of the watershed transform for segmentation of electron density maps. J Struct Biol. 2002;138:123–129. doi: 10.1016/s1047-8477(02)00009-6. [DOI] [PubMed] [Google Scholar]
- Volkmann N. Methods for segmentation and interpretation of electron tomographic reconstructions. In: Jensen GJ, editor. Methods in Enzymology. Volume 483, Cryo-EM, Part C: Analyses, Interpretation, and Case studies. Cambridge: Academic Press; 2010. pp. 31–46. (chapter 2) Available at http://www.sciencedirect.com/science/article/pii/S0076687910830022 (retrieved November 7, 2014) [DOI] [PubMed] [Google Scholar]
- Wang R, Stone RL, Kaelber JT, Rochat RH, Nick AM, Vijayan KV, Afshar-Kharghan V, Schmid MF, Dong JF, Sood AK, Chiu W. Electron cryotomography reveals ultrastructure alterations in platelets from patients with ovarian cancer. Proc Natl Acad Sci U S A. 2015;112:14266–14271. doi: 10.1073/pnas.1518628112. [DOI] [PMC free article] [PubMed] [Google Scholar]
- Woodward CL, Cheng SN, Jensen GJ. Electron cryotomography studies of maturing HIV-1 particles reveal the assembly pathway of the viral core. J Virol. 2014;89:1267–1277. doi: 10.1128/JVI.02997-14. [DOI] [PMC free article] [PubMed] [Google Scholar]
- Zhao X, Zhang K, Boquoi T, Hu B, Motaleb MA, Miller KA, James ME, Charon NW, Manson MD, Norris SJ, Li C, Liu J. Cryoelectron tomography reveals the sequential assembly of bacterial flagella in Borrelia burgdorferi. Proc Natl Acad Sci U S America. 2013;110:14390–14395. doi: 10.1073/pnas.1308306110. [DOI] [PMC free article] [PubMed] [Google Scholar]
Associated Data
This section collects any data citations, data availability statements, or supplementary materials included in this article.
Supplementary Materials
Supplementary Movies 1 and 2
Supplementary Movies 1 and 2 can be found online. Please visit journals.cambridge.org/jid_MAM
Supplementary Table 1
Supplementary Table 1 can be found online. Please visit journals.cambridge.org/jid_MAM
Supplementary Table 2
Supplementary Table 2 can be found online. Please visit journals.cambridge.org/jid_MAM


