Abstract
Abiraterone blocks androgen synthesis and prolongs survival in castration-resistant prostate cancer, which is otherwise driven by intratumoral androgen synthesis1,2. Abiraterone is metabolized in patients to D4A, which has even greater anti-tumor activity and structural similarities to endogenous steroidal 5α-reductase substrates, such as testosterone3. Here, we show that D4A is converted to at least 3 5α-reduced and 3 5β-reduced metabolites. The initial 5α-reduced metabolite, 3-keto-5α-abi, is more abundant than D4A in patients with prostate cancer taking abiraterone, and is an androgen receptor (AR) agonist, which promotes prostate cancer progression. In a clinical trial of abiraterone alone, followed by abiraterone plus dutasteride (a 5α-reductase inhibitor), 3-keto-5α-abi and downstream metabolites are depleted, while D4A concentrations rise, effectively blocking production of a tumor-promoting metabolite and permitting D4A accumulation. Furthermore, dutasteride does not deplete three 5β-reduced metabolites, which were also clinically detectable, demonstrating the specific biochemical effects of pharmacologic 5α-reductase inhibition on abiraterone metabolism. Our findings suggest a previously unappreciated and biochemically specific method of clinically fine-tuning abiraterone metabolism to optimize therapy.
Metastatic prostate cancer generally responds initially to medical or surgical castration, followed by eventual resistance as castration-resistant prostate cancer (CRPC), which is driven by the metabolic capability of tumors to reconstitute potent androgens, mainly from dehydroepiandrosterone (DHEA)/DHEA-sulfate, and in turn stimulate the androgen receptor (AR)1,4,5. Abiraterone (Abi; administered orally as Abi acetate), a steroidal drug, inhibits 17α-hydroxylase/17,20-lyase (CYP17A1), blocks androgen synthesis and prolongs survival, even after treatment with docetaxel chemotherapy6,7. Unfortunately, disease progression occurs and ultimately results in tumor lethality.
Abi is converted in patients by 3β-hydroxysteroid dehydrogenase (3βHSD) to Δ4-abiraterone (D4A), which blocks multiple enzymes required for 5α-dihydrotestosterone (DHT) synthesis, directly and potently antagonizes the AR, and has more potent anti-tumor activity than abiraterone itself3. However, there is no known method to increase accumulation of D4A as an Abi metabolite and it is not known if there are other Abi metabolites that harbor clinically relevant biochemical activity that contribute to response or resistance to treatment with Abi.
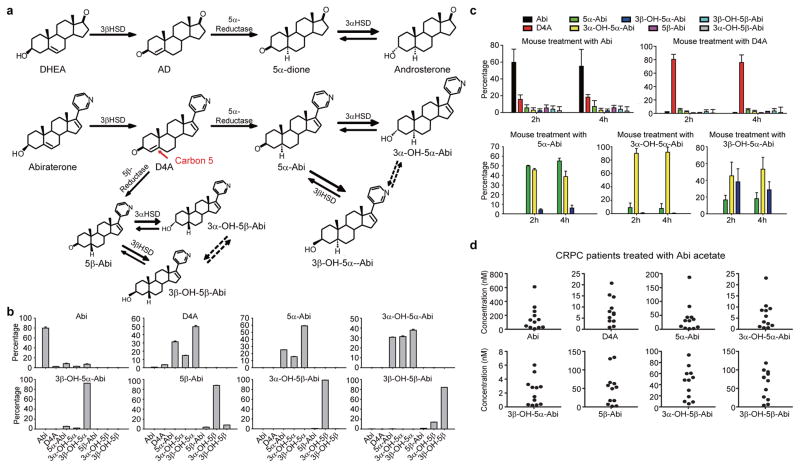
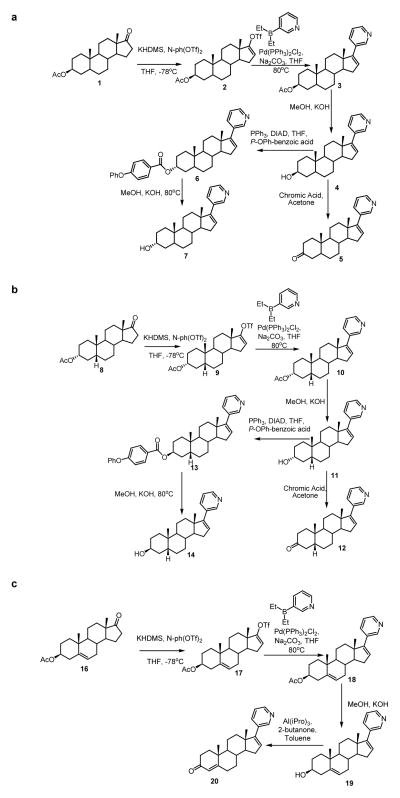
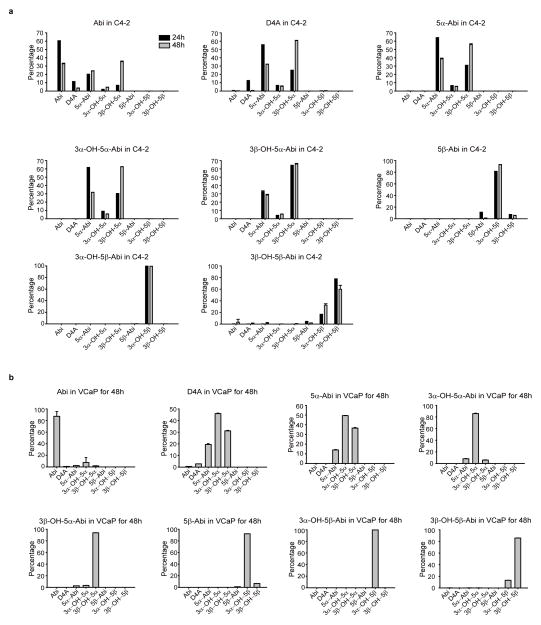
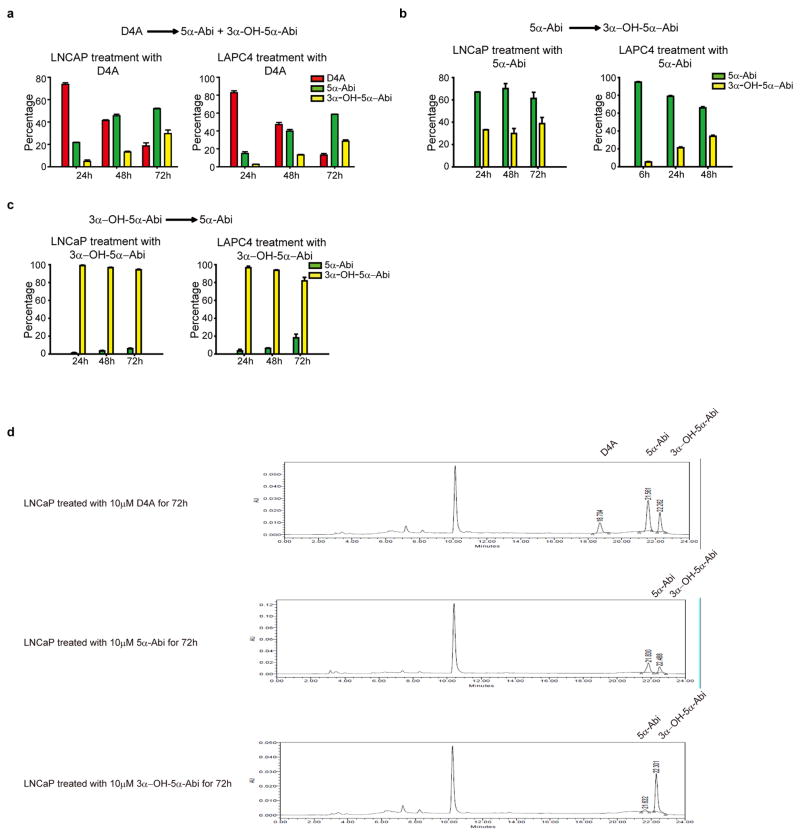
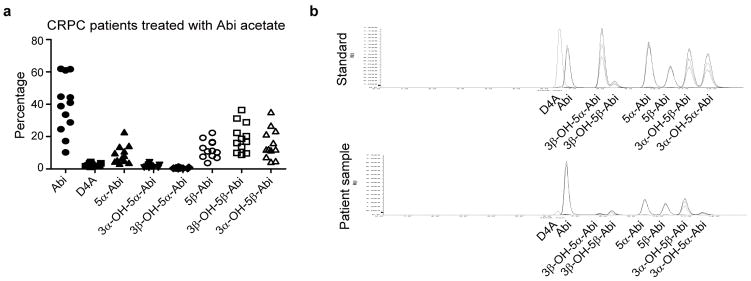
The Δ4, 3-keto structure of D4A makes it potentially susceptible to 5α-reduction to 3-keto-5α-Abi (5α-Abi) or 5β-reduction to 3-keto-5β-abi (5β-Abi), which are both irreversible reactions (Fig. 1a). 3-keto-reduction of both of these metabolites may reversibly convert them to their 3α-OH and 3β-OH congeners, making a total of 6 novel metabolites downstream of D4A (Fig. 1a and Extended Data Fig. 1). Conversion from Abi and D4A to all 3 5α-reduced metabolites, interconversion among the 3 5α-reduced metabolites, and interconversion among the 3 5β-reduced metabolites are detectable in the LAPC4, C4-2 and VCaP prostate cancer cell lines by mass spectrometry (Fig. 1b and Extended Data Fig. 2). In the LNCaP and LAPC4 human prostate cancer cell lines using an alternative method of detection (HPLC with UV absorption), direct incubations with D4A result in conversion to 5α-Abi and 3α-OH-5α-Abi (Extended Data Fig. 3a and d) and treatment with 5α-Abi yields conversion to 3α-OH-5α-Abi (Extended Data Fig. 3b). Particularly in LAPC4, the reversibility of this reaction is demonstrable by 5α-Abi detection upon 3α-OH-5α-Abi treatment (Extended Data Fig. 3c); however, it appears that reduction to 3α-OH-5α-Abi appears to be the preferred directionality. Similarly, in vivo, 5α-Abi is preferentially converted to 3α-OH-5α-Abi, although the reverse reaction is also detectable (Fig. 1c). 3β-OH-5α-Abi is also oxidized to 5α-Abi and converted to 3α-OH-5α-Abi. Reflecting the irreversible nature of steroid 5α-reduction, no Abi, D4A, or 5β-reduced metabolites are detectable after treatment with any of the 5α-reduced Abi metabolites. Furthermore, all 6 metabolites are clinically detectable in the sera of 12 patients with CRPC undergoing treatment with Abi acetate (Fig. 1d; Extended Data Fig. 4 and Extended Data Table 1). Together, these data support a model in which once D4A is 5α-reduced to 5α-Abi, 3-keto reduction to both 3-(α and β)-OH isomers and the reverse reactions occur, both in prostate cancer cells and in vivo.
Figure 1.
Genesis of 5α- and 5β-reduced Abi metabolites in patients treated with Abi acetate. a, Abiraterone metabolism by steroidogenic enzymes. Above, In a pathway of androgen metabolism, DHEA is converted by 3βHSD to Δ4-androstenedione (AD), which is 5α-reduced to 5α-androstanedione (5α-dione), which is in turn 3-keto-reduced to androsterone. Below, Structurally analogous conversion of abiraterone to D4A enables 5α- and 5β-reduction of D4A at carbon 5 (red arrow), yielding 6 additional Abi metabolites. Dotted arrows indicate uncertainty of direct conversion between 3α- and 3β-isomers (versus indirectly by way of the 3-keto intermediate). b, Interconversion of Abi metabolites in the LAPC4 prostate cancer cell line. Cells were treated with Abi or the indicated metabolite (0.1 μM) for 48 hours and each of the indicated metabolites was detected by liquid chromatography-mass spectrometry (LC-MS/MS) in triplicate. Errors bars represent the SD. c, In vivo Abi metabolism in mice. Treatment with Abi (n = 5 mice) or D4A (n = 5 mice) results in detection of all 6 5-reduced metabolites. Treatment with any of the 3 5α-reduced Abi metabolites (n = 4 mice for each compound) results in detection of the 2 other 5α-reduced metabolites, demonstrating interconversion. d, Abi metabolites in sera of 12 patients with prostate cancer treated with Abi acetate. Metabolites were measured by LC-MS/MS.
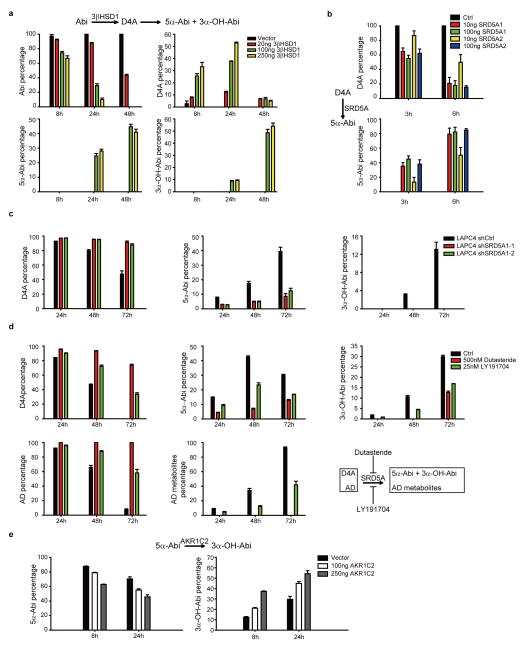
Steroid 5α-reduction preserves the steroid planar structure and plays an essential role in the regulation of biologically active androgens (i.e., conversion of testosterone to DHT and Δ4-androstenedione [AD] to 5α-androstanedione [5α-dione])8,9. On the other hand, steroid 5β-reduction disrupts the planar conformation by introducing a 90° bend, which generally inactivates steroid hormones and facilitates clearance. We therefore focused subsequent studies on the pathway and metabolites of D4A 5α-reduction. 5α-Abi and 3α-OH-5α-Abi synthesis is facilitated via upstream conversion of Abi to D4A by 3βHSD (Extended Data Fig. 5a). In cells without endogenous steroid-5α-reductase (SRD5A) expression, conversion of D4A to 5α-Abi is enabled by expression of either SRD5A1 or SRD5A2 (Extended Data Fig. 5b). In LAPC4 cells, which predominantly express SRD5A18, genetically silencing SRD5A1 (Extended Data Fig. 5c) or pharmacologic blockade with the SRD5A1 inhibitor LY19170410, or clinically achievable concentrations of the dual isoenzyme inhibitor dutasteride11, blocks conversion of D4A to 5α-Abi and 3α-OH-5α-Abi (Extended Data Fig. 5d). The aldo-keto reductase isoenzyme AKR1C2 is thought to be the predominant 3-keto reductase that converts the 3-keto steroid, DHT, to 5α-androstane-3α,17β-diol12. We found that AKR1C2 expression also enables the reduction of 5α-Abi to 3α-OH-5α-Abi (Extended Data Fig. 5e).
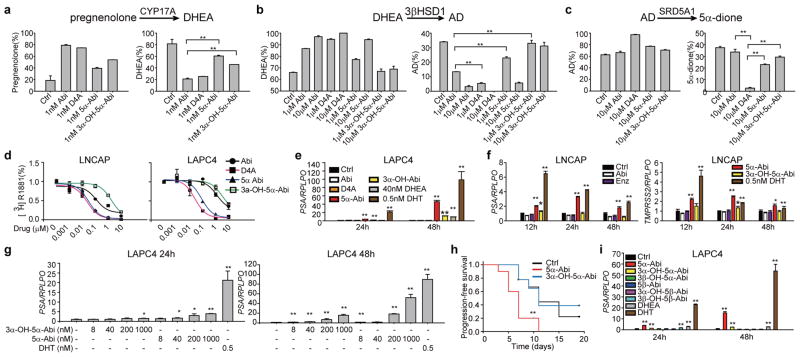
Next, we sought to determine the activities of 5α-reduced Abi metabolites on the androgen pathway. 5α-reduction of D4A to 5α-Abi and 3α-OH-5α-Abi is accompanied by attenuation or loss of CYP17A1, 3βHSD and SRD5A inhibition activity (Fig. 2a–c), as assessed by conversion from [3H]-pregnenolone to DHEA, [3H]-DHEA to AD, and [3H]-AD to 5α-dione, respectively. The effects, or lack thereof, for D4A and 5α-Abi metabolites on 3βHSD, are consistent with observations of others that endogenous Δ4, 3-keto-steroids inhibit 3βHSD and that 5α-reduction leads to loss of inhibitory activity13.
Figure 2.
Effects of 5α-reduced Abi metabolites on the androgen pathway and tumor progression. a, Potent CYP17A1 inhibition activity attributable to Abi and D4A is attenuated with conversion to 5α-Abi and 3α-OH-5α-Abi. 293 cells overexpressing CYP17A1 were treated with [3H]-pregnenolone and conversion to DHEA was assessed in the presence of the indicated drugs. b, 5α-reduction of D4A causes loss of 3βHSD inhibitory activity. LNCaP cells were treated with [3H]-DHEA and the indicated drugs for 48 hours, and metabolic flux to AD was assessed. c, 5α-Abi and 3α-OH-5α-Abi lose SRD5A inhibition activity attributable to D4A. LAPC4 cells were treated with [3H]-AD and the indicated drugs, and flux to 5α-dione was assessed after 24 hours of incubation. **, p < 0.01. d, 5α-Abi and D4A comparably bind to AR. LNCaP and LAPC4 express the mutated AR and wild-type AR, respectively, and were incubated with [3H]-R1881 and the indicated compounds for 30 min. Intracellular radioactivity was normalized to protein concentration. e and f, 5α-Abi stimulates androgen-responsive gene expression in LAPC4 and LNCaP. Delayed and more modest PSA expression is stimulated with 3α-OH-5α-Abi. g, Dose-dependent stimulation of PSA expression by 5α-Abi in LAPC4. h, Treatment with 5α-Abi (n=10 mice) but not 3α-OH-5α-Abi (n=9 mice) hastens VCaP CRPC xenograft growth compared with control (n=9 mice) in orchiectomized mice. Treatment with the indicated compounds began when CRPC tumors reached 100 mm3 and progression-free survival was assessed as the time at which there was > 30% growth for 2 sequential measurements. The significance of the difference between treatment groups was assessed with the log rank test. ** p < 0.01 for the difference between 5α-Abi and Ctrl; *, p<0.05. i, 5β-reduced Abi metabolites do not stimulate PSA expression. Expression is normalized to RPLPO and vehicle expression in EG and I. Error bars represent the SD in A–G and I. All experiments in A–G and I were performed at least 3 times.
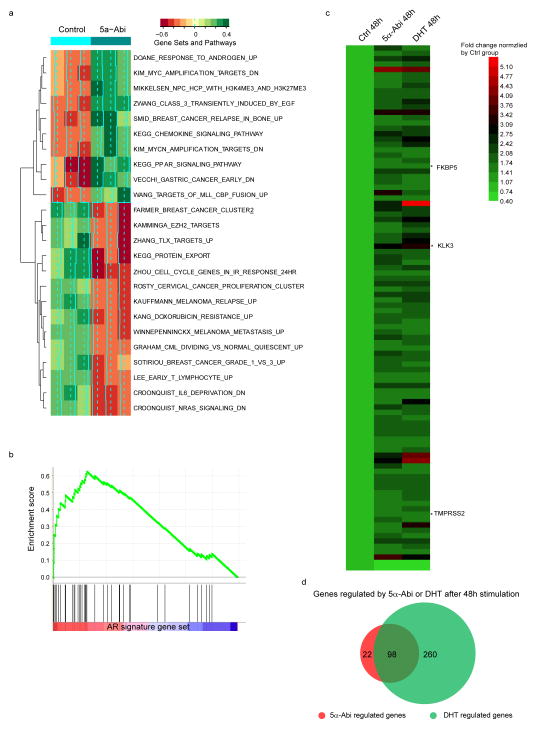
The affinity of 5α-Abi is comparable to that of D4A for the T877A mutant AR in LNCaP and wild-type AR in LAPC4, whereas the affinities of 3α-OH-5α-Abi and Abi are lower (Fig. 2d). To assess the consequences of 5α-Abi binding to AR, expression of androgen-responsive genes was assessed. Treatment with 5α-Abi results in expression of androgen-responsive genes in LAPC4 and LNCaP (Fig. 2e–g). A lower level of induction occurs with 3α-OH-5α-Abi treatment. The delayed and modest effect of 3α-OH-5α-Abi on induction of PSA is consistent with low binding affinity for AR and modest conversion of 3α-OH-5α-Abi to 5α-Abi that appears to occur to a greater extent in LAPC4 compared with LNCaP (Extended Data Fig. 3c). Using a cDNA microarray and Gene Set Enrichment Analysis we found that 5α-Abi stimulates AR signature genes14 (Extended Data Fig. 6a–b) and that 81% of genes regulated by 5α-Abi are also regulated by DHT (Extended Data Fig. 6c–d and Extended Data Table 2). To test the effect of AR stimulation by 5α-Abi on tumor growth, CRPC xenografts were treated with 5α-Abi and 3α-OH-5α-Abi. 5α-Abi significantly shortened progression-free survival (P < 0.01), whereas 3α-OH-5α-Abi had no detectable effect when compared to control xenografts (Fig. 2h). We also tested all 3 5β-reduced Abi metabolites for effects on androgen-responsive gene expression and confirmed that perturbation of the steroid planar structure is accompanied by the absence of metabolite activity (Fig. 2i).
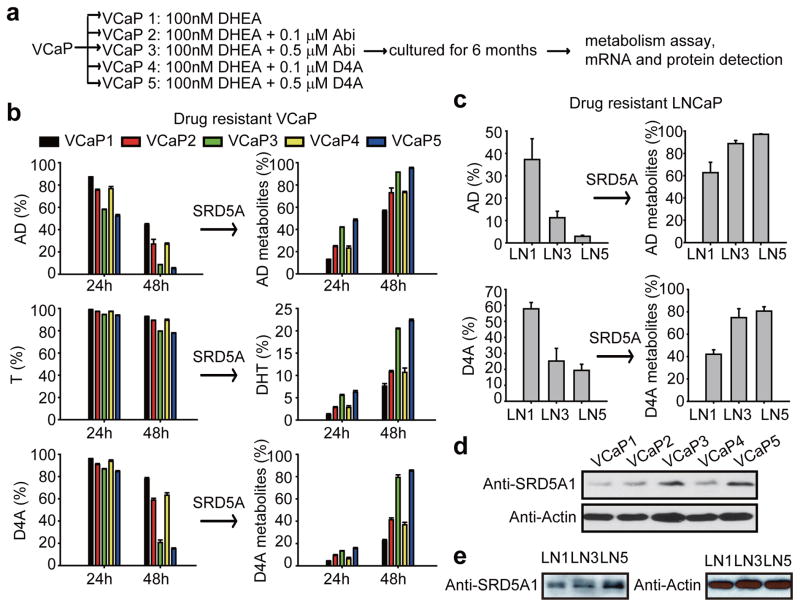
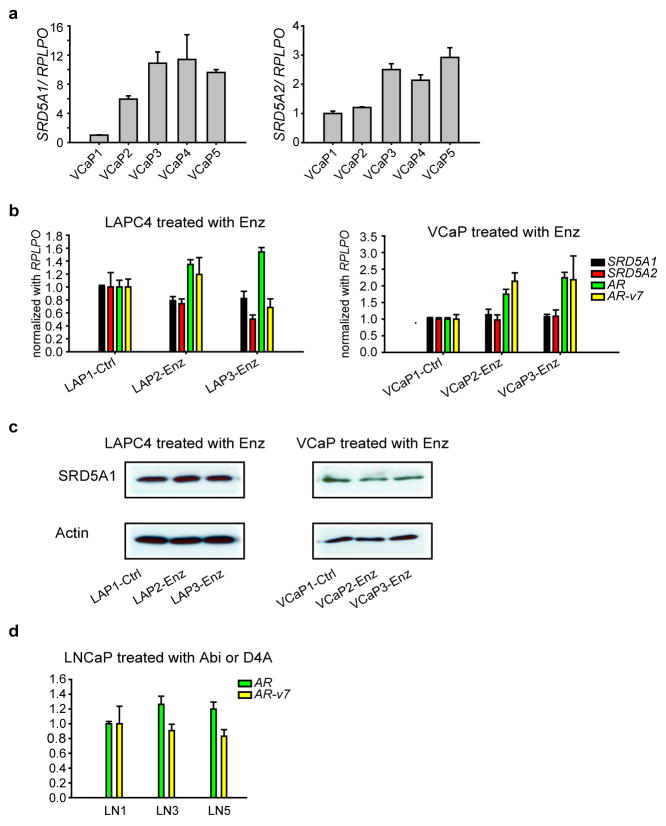
We hypothesized that under conditions of Abi treatment, prostate cancer cells might develop the capacity to augment the conversion of D4A → 5α-Abi by SRD5A up-regulation. VCaP and LNCaP cells were cultured for 6 months with D4A or Abi, along with DHEA, to mimic the human adrenal androgen milieu (Fig. 3a). Cells propagated in long-term culture with D4A and Abi exhibited increased SRD5A enzyme activity, as assessed by conversion of [3H]-AD → 5α-reduced androgens, [3H]-T → DHT, and D4A → 5α-reduced Abi metabolites (Fig. 3b–c). Increased SRD5A enzyme activity was accompanied by a predominant increase in SRD5A1 mRNA (Extended Data Fig. 7a) and protein expression (Fig. 3d–e). The increase in SRD5A occurring with Abi or D4A treatment does not occur with enzalutamide treatment (Extended Data Fig. 7b–c). There was no change in AR-V7 with Abi or D4A treatment (Extended Data Fig. 7d). Together, these results suggest that there is probably a selective growth advantage for depleting the anti-tumor activity associated with D4A and/or increasing the AR agonist activity of increased 5α-Abi concentrations.
Figure 3.
Long-term exposure to Abi and D4A leads to an increase in SRD5A expression and enzymatic activity and an increase in conversion from D4A to 5α-reduced Abi metabolites. a, Experimental schema. VCaP cells were cultured with DHEA (100 nM) alone, or with the indicated concentration of Abi or D4A continuously for 6 months. LNCaP cells were treated under similar conditions (LN1, LN3 and LN5 = VCaP1, VCaP3 and VCaP5 treatment, respectively). Treatment with Abi or D4A induces an increase in SRD5A enzyme activity and increased conversion of D4A to 5α-Abi metabolites in b, VCaP and c, LNCaP. Cells were treated with [3H]-AD, [3H]-T, or D4A for 24 or 48 hours, and conversion to 5α-reduced metabolites was assessed by HPLC. SRD5A1 protein expression is increased with Abi and D4A treatment in d, VCaP and e, LNCaP. b and c were performed in triplicate with error bars representing the SD. All experiments were performed at least 3 times.
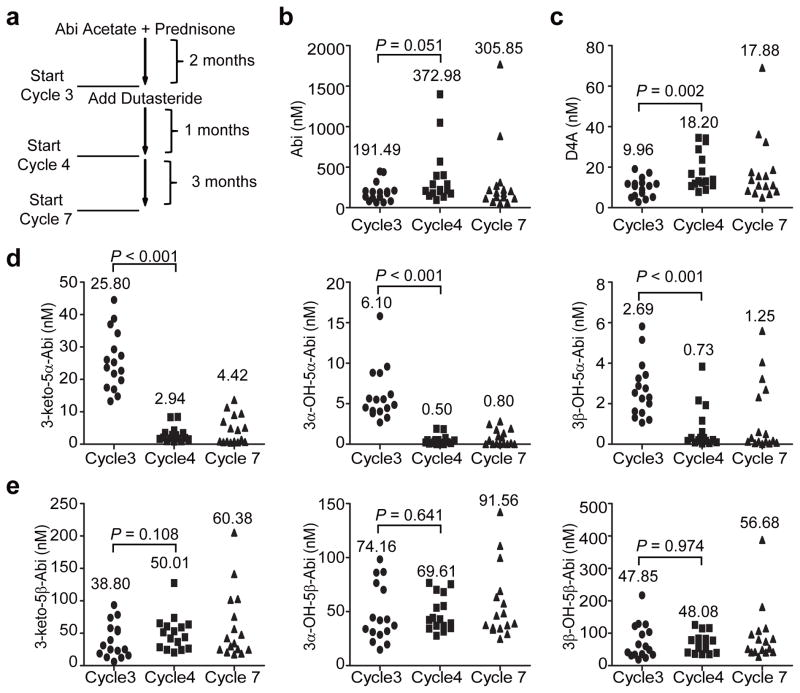
Next, we hypothesized that the increased ratio of 5α-Abi:D4A of approximately 2.5:1 is specifically and clinically reversible by dual SRD5A isoenzyme inhibition with dutasteride in patients on treatment with Abi acetate. A phase II clinical trial (NCT01393730) of Abi acetate (1000 mg daily) plus prednisone (5 mg daily) for 2 months (2 cycles), followed by the addition of dutasteride at the start of cycle 3 (3.5 mg once daily; Fig. 4a) is ongoing in men with metastatic CRPC. Sixteen patients who had blood collected on Abi acetate alone (start of cycle 3) and after the addition of dutasteride (start of cycles 4 and 7) were included in the analysis. Strikingly, there was an 89% decline in the mean concentration of 5α-Abi after the addition of dutasteride (cycle 3: 25.8 nM vs. cycle 4: 2.9 nM; Fig. 4d). The other two 5α-reduced metabolites downstream of SRD5A exhibited similar declines (92% decline in 3α-OH-5α-Abi and 73% decline in 3β-OH-5α-Abi), further corroborating the effects of dutasteride on blocking 5α-reduction of D4A in patients. Pharmacologic SRD5A inhibition nearly doubled the mean serum concentration of D4A (cycle 3: 9.9 nM vs. cycle 4: 18.2 nM; Fig. 4c). Unexpectedly, the addition of dutasteride also nearly doubled the mean concentration of Abi (cycle 3: 191.2 nM vs. cycle 4: 372.4 nM; Fig. 4b), although this difference did not reach statistical significance (P = 0.051). Concentrations of Abi, D4A and 5α-Abi metabolites at cycle 7, the second time point after addition of dutasteride, were similar to cycle 4, although the changes from Abi alone at baseline were slightly lessened (Fig. 4 and Extended Data Table 3). Finally, and in sharp contrast to the substantial decline in 5α-Abi metabolites after the addition of dutasteride, there was no decrease in any of the 3 5β-reduced Abi metabolites, supporting a very specific biochemical effect of SRD5A inhibition on 5α-Abi metabolism (Fig. 4e). Together, these findings demonstrate that the elevated ratio of 5α-Abi:D4A is pharmacologically, specifically and clinically reversible with dutasteride.
Figure 4.
In patients treated with Abi acetate, SRD5A inhibition significantly increases serum D4A and specifically and significantly depletes all 3 5α-Abi metabolites in serum. a, Clinical trial schema. Blood was collected for Abi metabolites after 2 months of treatment with Abi acetate + prednisone (start cycle 3), and again after 1 and 4 months (start cycles 4 and 7) of addition of treatment with dutasteride. Serum concentrations of b, Abi, c, D4A, d, all 3 5α-reduced Abi metabolites, e, all 3 5β-reduced Abi metabolites, in sera. The mean Abi and Abi metabolite concentrations at each of the 3 time points in the clinical trial are indicated.
CYP17A1 inhibition by Abi is clinically incomplete, as has been demonstrated by residual urinary androgen metabolites15 and high residual serum concentrations of DHEA-sulfate, the major androgen produced from the human adrenal16, which together persist in patients on Abi treatment. Molecular aberrations that sustain AR signaling partake in the development of CRPC17 and also drive Abi resistance18,19. Together, these studies suggest that reversal of sustained AR signaling should have a therapeutic benefit in at least a subset of patients with Abi resistant disease.
A component of sustained AR signaling occurs by way of a continuous supply of endogenous androgens (testosterone and/or DHT) provided by maintained steroidogenesis. Preclinical models indeed suggest that Abi resistance can be driven by an up-regulation of steroidogenic enzymes20. Our findings demonstrate that along with providing potent endogenous androgens, steroidogenic enzymes may serve a dual purpose by also regulating Abi metabolism, specifically by hastening the elimination of the anti-tumor activity associated with D4A3 by converting it with increased SRD5A enzyme activity to 5α-Abi, which instead has tumor-promoting AR agonist activity. Consistent with our findings, SRD5A has been noted by others as one of the most up-regulated steroidogenic-enzyme transcripts in another model of Abi resistance20.
The coordinate effects of steroidogenic enzymes on endogenous steroids vs. Abi should be considered in view of our findings on extensive steroidogenic metabolism of Abi. For example, increased SRD5A enzyme activity should have concordant favorable effects on tumor growth by increasing DHT synthesis and converting D4A to 5α-Abi. On the other hand, increasing 3βHSD activity would be expected to have discordant effects, as it is required for synthesis of T and DHT (beneficial to tumor) but increases conversion of Abi to D4A (detrimental to tumor). In this context, the likelihood is that the net effect of increased intratumoral 3βHSD activity is probably beneficial, because the endogenous substrates (i.e., DHEA, Δ5-androstenediol and pregnenolone) are probably preferred over D4A. A third enzymatic reaction that is relevant both to endogenous 5α-reduced androgens and 5α-Abi is 3α-OH-oxidation to 3-keto-steroids. Oxidation or ‘back conversion’ of (3α-OH) 5α-androstanediol, which does not stimulate AR, to (3-keto) DHT, can stimulate AR signaling21,22. The net effect of this reaction on androgens and Abi metabolism is therefore expected to be concordant and stimulatory because in addition to increasing DHT synthesis, conversion of 3α-OH-5α-Abi to 5α-Abi also increases affinity for AR (Fig. 2d), stimulates androgen-responsive gene expression (Fig. 2e–g) and tumor growth (Fig. 2h).
Notwithstanding these considerations, the majority of Abi metabolites found in serum likely form independent of tumor metabolism and result from the activity of hepatic enzymes. Although we found that prostate cancer cell lines readily 5α-reduce D4A, no prostate cancer-dependent 5β-reduction was observed. Both steroid 5α- and 5β-reductase reactions are abundant in the liver. The contributions to treatment response of D4A depletion by intrinsic tumor SRD5A versus extrinsic metabolism remain to be determined. Nonetheless, in our clinical study adding dutasteride to treatment with Abi acetate, resulted in an approximately 90% decline in circulating concentrations of 5α-Abi, the immediate product of D4A 5α-reduction, with similar declines in the other 5α-Abi metabolites. D4A concentrations concomitantly rose after the addition of dutasteride, supporting the specific pharmacologic effect of dutasteride on D4A metabolism. Numerically, there was also a rise in Abi concentrations, and although this change did not reach the generally accepted level of statistical significance (P = 0.051), it does raise the possibility that SRD5A provides an important mechanism of Abi clearance, at least in a subset of patients.
The absence of any effect on 5β-reduced Abi metabolites demonstrates the remarkable specificity of dutasteride on 5α-reduction of D4A. The presence and maintenance of 5β-reduced metabolites further suggests an “escape” mechanism of metabolism with pharmacologic 5α-reductase inhibition, raising the possibility that D4A, and perhaps Abi concentrations, might be further elevated with 5β-reductase inhibition, resulting in further therapeutic potentiation.
Our studies demonstrate a clear and specific biochemical effect of SRD5A inhibition on D4A metabolism in patients treated with Abi that would be expected to intensify the benefit of Abi therapy. The clinical benefit of fine-tuning Abi metabolism with SRD5A inhibition requires further investigation in randomized trials.
Methods
Cell lines, drugs and constructs
LNCaP, 293T and VCaP cells were purchased from the American Type Culture Collection (Manassas, VA) and maintained in RPMI-1640 (LNCaP) or DMEM (293T and VCaP) with 10% FBS (Gemini bio-products). The LAPC4 cell line was kindly provided by Dr. Charles Sawyers (Memorial Sloan Kettering Cancer Center, New York, NY) and grown in Iscove’s Modified Dulbecco’s Medium with 10% FBS. Stable LAPC4 cell lines with SRD5A1 knockdown were established as previously described8. Plasmid pcDNA3-c17 (a generous gift of Dr. Walter Miller, University of California, San Francisco, CA) was used to establish the 293 stable cell line expressing human CYP17A1 as described23. Cell lines were authenticated by DDC Medical (Fairfield, OH) and determined to be mycoplasma free with primers 5′-ACACCATGGGAGCTGGTAAT-3′ and 5′-GTTCATCGACTTTCAGACCCAAGGCAT-3′. Dutasteride was purchased from Medkoo Biosciences (Chapel Hill, NC). Enzalutamide was obtained from Medivation (San Francisco, CA). The AKR1C2 expression plasmid was a generous gift of Dr. Trevor Penning (University of Pennsylvania, Philadelphia, PA). Enzalutamide resistant cells were cultured with DMSO, 1μM or 10μM enzalutamide for more than 6 months (LAPC4) or 10 weeks (VCaP) with presence of 10nM DHEA. Abi or D4A resistant cells were cultured as indicated in Fig. 3a.
HPLC
Cell Line Metabolism: 0.2 million/ml cells were seeded and incubated in 12-well plates for ~24 h before incubation with the indicated drugs or a mixture of [3H]-labeled (~1,000,000 cpm/well; PerkinElmer, Waltham, MA) and non-radioactive androgens (final concentration, 100 nM) at 37°C. Collected medium was treated with β-glucuronidase (Helix pomatia; Sigma-Aldrich), extracted with ethyl acetate:isooctane (1:1), and concentrated under nitrogen gas as described previously24.
Xenograft Metabolism: 107 VCaP cells with Matrigel were injected subcutaneously into orchiectomized NSG mice with 5 mg, 90 day sustained-release DHEA pellets (Innovative Research of American, Sarasota, FL). ~1000 mm3 xenografts were harvested, minced, and cultured in DMEM with 10% FBS at 37°C with the indicated drugs. Aliquots of medium were collected at the indicated times. Collected medium was processed for HPLC with the same protocol as medium from cell lines.
HPLC analysis was performed on a Waters 717 Plus HPLC or an Agilent 1260 HPLC. Dried samples were reconstituted in 50% methanol and separated on Kinetex 100 × 2.1 mm, 2.6 μm particle size C18 reverse-phase column (Phenomenex, Torrance, CA) using a methanol/water gradient at 30°C. The column effluent was analyzed using a 254 nm UV-visible detector or β-RAM model 3 in-line radioactivity detector (IN/US Systems, Inc.) using Liquiscint scintillation cocktail (National Diagnostics, Atlanta, GA). All HPLC studies were conducted in triplicate and repeated at least 3 times in independent experiments. Results are shown as mean ± SD.
Gene expression and immunoblotting
Cells were starved with phenol red-free and serum free-medium for at least 48 h before treatment with the indicated drugs and/or androgens. RNA extraction and cDNA synthesis were performed with the GenElute Mammalian Total RNA miniprep kit (Sigma-Aldrich) and iScript cDNA Synthesis Kit (Bio-Rad, Hercules, CA) respectively. Quantitative PCR (qPCR) analysis was conducted in triplicate in an ABI 7500 Real-Time PCR machine (Applied Biosystems) using iTaq Fast SYBR Green Supermix with ROX (Bio-Rad) and primers for TMPRSS2, PSA and RPLPO, as described previously 4. SYBR Premix Ex Taq II (Takara) was used for SRD5A1, SRD5A2 and AR v7 detection. Primers used for AR detection are 5′-TCTTGTCGTCTTCGGAAATGT-3′ and 5′-AAGCCTCTCCTTCCTCCTGTA-3′ 25. Primers used for AR v7 detection are 5′-CCATCTTGTCGTCTTCGGAAATGTTATGAAGC-3′ and 5′-TTTGAATGAGGCAAGTCAGCCTTTCT-3′26. Accurate quantitation of each mRNA was achieved by normalizing the sample values to RPLPO and to vehicle-treated cells. 50 μg cell lysate was used for immunoblot with rabbit anti-SRD5A1 (Abnova) and mouse anti–β-actin (Sigma-Aldrich) antibodies.
Microarray study and analysis
LAPC4 cells were starved with phenol red-free and serum free-medium for at least 48 h before treatment with the indicated drugs and/or androgens, in biological triplicate. RNA was extracted with mirVana™ miRNA isolation kit (Life technologies). The genomics core of Cleveland Clinic generated cDNA and performed the microarray with HumanHT-12 v4 Expression BeadChip and iScan (Illumina). Hybrid signals were analyzed with Illumina GenomeStudio Software 2011.1 and normalized by the vehicle control group. Regulated genes are defined as detection p <0.01, fold change (compared to Ctrl group) > 1.55 or <0.5. Heatmap was generated with HemI software27. The complete results are uploaded in NCBI GEO as GSE75387.
Normalized, log2 transformed data was used for subsequent GSVA carried out using R (http://www.R-project.org) and Bioconductor software28. The 2500 genes with the highest median absolute deviation were selected for analysis. Enrichment scores were calculated for the gene set C2 Collection (curated pathways) from the Molecular Signatures Database version 5.1 (MSigDB v5.1) using the Bioconductor package ‘GSVA’29. Gene sets with a minimum of 10 genes and a maximum of 1000 genes were included. Significance testing of enrichment scores was performed with a moderated t-statistic (FDR < 0.05) using the Bioconductor package ‘limma’. Separately, GSEA was used to correlate the 5α-Abi expression data with an androgen receptor selective gene set described elsewhere14. The GSEA enrichment plot was generated as described elsewhere30,31.
Mouse xenograft studies
Male NSG mice, 6 to 8 weeks of age were obtained from the Cleveland Clinic Biological Resources Unit facility. All mouse studies were conducted under a protocol approved by the Cleveland Clinic Institutional Animal Care and Use Committee. 107 VCaP cells were injected subcutaneously with matrigel. Once tumors reached 100 mm3 (length × width × height × 0.52), mice were surgically orchiectomized and arbitrarily assigned to vehicle (n=9), 5α-Abi (n=10), or 3α-OH-5α-Abi (n=9) treatment groups. Mice were injected intraperitoneally with 0.15 mL 5α-Abi and 3α-OH-5α-Abi (0.15 mmol/kg/d and 0.075 mmol/kg/d, respectively, in 5% benzyl alcohol and 95% safflower oil solution) every day for up to 20 days. Control groups were administered 0.15 mL 5% benzyl alcohol and 95% safflower oil solution via intraperitoneal injection every day. Tumor volume was measured every other day, and time to increase in tumor volume by 30% was determined (2 sequential increases). Mice were sacrificed at treatment day 20. The significance of the difference between treatment groups was assessed by Kaplan-Meier survival analysis using a log-rank test in SigmaStat 3.5.
AR competition assay
Cells were starved with phenol red-free and serum free-medium for at least 48 h and then treated with [3H]-R1881 and the indicated concentrations of drugs for 30 min. Cells were washed thoroughly with PBS and then lysed with RIPA buffer. Intracellular radioactivity was measured with a Beckman Coulter LS60001C liquid scintillation counter and normalized to the protein concentration as detected with a Wallac Victor2 1420 Multilabel counter (Perkin Elmer).
Patient serum collection and drug extraction
Twelve patients with CRPC undergoing standard treatment with Abi acetate at Cleveland Clinic were consented under an Institutional Review Board – approved protocol (Case 7813). Blood was collected using Vacutainer Plus serum blood collection tubes (#BD367814, Becton Dickenson, Franklin Lakes, NJ), between 1 and 16 hours after the 1000mg daily dose of Abi acetate was administered, and allowed to clot. Tubes were centrifuged at 2500 RPM or 1430 x g for 10 minutes. Serum aliquots were frozen at -80°C until processing. To study the effect of dutasteride on Abi metabolism, serum samples were collected from patients treated on a phase II clinical trial at Dana-Farber Cancer Institute (NCT01393730). Each patient received Abi acetate (1,000 mg daily) plus prednisone (5 mg daily) for 2 cycles (8 weeks) and then additional treatment with dutasteride (3.5 mg daily) was initiated. Samples were collected on treatment with Abi alone and after addition of dutasteride (start of cycles 3, 4 and 7). Seventeen patients treated at this institution on this clinical trial had blood available from all 3 time points. One patient had Abi concentrations that were under the limit of detection and was later determine to have stopped treatment because of adverse effects and was therefore not included in the analysis. Drug metabolites and internal standard (d4-abiraterone, Toronto Research Chemicals Inc, Ontario Canada) were extracted from 100 μL of patient serum with methyl tert-butyl ether (Sigma Aldrich, St. Louis, MO), evaporated under a stream of nitrogen gas and reconstituted in methanol:water (50:50) prior to mass spectrometry analysis. Standard curves were generated using human serum spiked with known concentrations of each metabolite to enable determination of unknown concentrations in patient samples.
Mouse serum extraction
20 μl of mouse serum were precipitated with 500 μl methanol containing the internal standard (d4-abiraterone) the supernatant was then injected into the mass analyzer. Standard curves were prepared with mice serum spiked with known metabolites concentrations for accurate determination of unknown metabolites concentrations.
Cell line media extraction
200 μl media collected at different time points were extracted with methyl tert-butyl ether (Sigma Aldrich, St. Louis, MO), evaporated under a stream of nitrogen gas and reconstituted in methanol:water (50:50) prior to mass spectrometry analysis.
Mass spectrometry
Samples were analyzed on a ultra high-performance liquid chromatography station (Shimadzu, Kyoto, Japan) with a DGU-20A3R degasser, 2 LC-30AD pumps, a SIL-30AC autosampler, a CTO-10A column oven and a CBM-20A system controller in tandem with a QTRAP 5500 mass spectrometer (AB Sciex, Framingham, MA). Drug metabolites were ionized using electrospray ionization in positive ion mode. Multiple reaction monitoring was used to follow mass transitions for Abi, IS, and the metabolites (Table S1). Due to the similarity in structure and mass transitions for the metabolites it was necessary to separate them with chromatography. Separation of drug metabolites was achieved using a mobile phase consisting of LC-MS grade (Fisher) methanol: acetonitrile: water:formic acid (39:26:34:1) at a flow rate of 0.2 ml/min., and C18 analytical column; Zorbax Eclipse plus 150 × 2.1 mm, 3.5μm (Agilent, Santa Clara, CA).
Chemical Synthesis
See supplemental methods.
Extended Data
Extended Data Figure 1.
Synthesis of abiraterone metabolites. (a) Synthesis of 5α-Abi, 3α-hydroxy-5α-Abi and 3β-hydroxy-5α-Abi. (b) Synthesis of 5β-Abi, 3α-hydroxy-5β-Abi and 3β-hydroxy-5β-Abi. (c) Synthesis of D4A.
Extended Data Figure 2.
Genesis and interconversion of Abi metabolites in the (a) C4-2 and (b) VCaP prostate cancer cell lines. Cells were treated with Abi or the indicated metabolite (0.1 μM) for 24 or 48 hours and each of the indicated metabolites was detected by LC-MS/MS in triplicate. Error bars represent the SD.
Extended Data Figure 3.
In vitro time course formation of 5α-reduced Abi metabolites. a–c, Conversion from D4A to 5α-reduced Abi metabolites (a), 3-keto reduction of 5α-Abi to 3α-OH-5α-Abi (b), and 3α-OH-oxidation of 3α-OH-5α-Abi to 5α-Abi (c) is detectable in LNCaP and LAPC4 prostate cancer cell lines. Cells were treated with 10 μM of the indicated compounds, metabolites were separated by high performance liquid chromatography (HPLC) and quantitated by UV spectroscopy. Experiments were performed in triplicate at least 3 times and error bars represent the SD. (d), Examples of HPLC and UV absorption tracings for incubations of prostate cancer cell lines with D4A, 5α-Abi and 3α-OH-5α-Abi.
Extended Data Figure 4.
Clinical presence of 5α-reduced and 5β-reduced Abi metabolites in patients treated with Abi acetate. a, Dot plot of Abi and its metabolites expressed as the percentage of the total of Abi and its metabolites. b, LC-MS/MS separation of Abi metabolite standards and an example from serum obtained from a patient on Abi treatment.
Extended Figure 5.
Enzymes involved in the formation of 5α-reduced Abi metabolites. a, 3βHSD1 catalyzes the conversion of Abi to D4A and downstream accumulation of 5α-Abi and 3α-OH-5α-Abi. LAPC4 cells were transiently transfected with the indicated amount of an expression construct encoding 3βHSD1 or vector control before treatment with Abi. b, Conversion of D4A to 5α-Abi is catalyzed by SRD5A1 or SRD5A2. The indicated amounts of SRD5A1, or SRD5A2, or empty vector plasmids were transfected into 293T cells, and cells were incubated with D4A for the designated incubation times. c, SRD5A1 silencing blocks 5α-reduction of D4A. LAPC4 cells stably expressing shRNAs targeting SRD5A1 or nonsilencing control were treated with D4A and metabolites for the indicated times. d, Pharmacologic SRD5A inhibition blocks 5α-reduction of D4A. LAPC4 cells were treated with D4A and the SRD5A inhibitors dutasteride or LY191704. A parallel control experiment is shown with inhibition of 5α-reduction of [3H]-AD. e, Conversion of 5α-Abi to 3α-OH-5α-Abi is catalyzed by AKR1C2. 293T cells were transfected with AKR1C2 or empty vector and treated with 5α-Abi for the indicated times. For all experiments, metabolites were separated by HPLC and quantitated by UV spectroscopy (Abi metabolites) or with a beta-RAM ([3H]-androgens). Error bars represent SD in all experiments. All experiments were performed at least 3 times.
Extended Data Figure 6.
Gene expression profile of stimulation by 5α-Abi and DHT. a. Unbiased pathway analysis of 5α-abi regulated genes. b, Gene Set Enrichment Analysis of 5α-abi regulated genes with the AR signature gene set. c, Gene expression in LAPC4 cells stimulated by 1μM 5α-Abi or 0.1nM DHT for 48h. Regulated genes were determined by detection p value <0.01, upregulation >1.55 or downregulation <0.5 compared with vehicle control group. d, Venn diagram of 5α-abi and DHT regulated genes.
Extended Data Figure 7.
Transcript expression regulation in the presence of Abi, D4A or Enz. a, SRD5A1 and SRD5A2 expression in VCaP cells treated with Abi or D4A as indicated in Figure 3. b, SRD5A1 and SRD5A2 expression does not change with Enz treatment. c, SRD5A1 protein abundance does not change with Enz treatment in LAPC4 or VCaP. d, AR-v7 expression is unchanged in LNCaP cells treated with Abi or D4A as indicated in Figure 3. Expression was normalized to RPLPO and vehicle treated cells for all comparisons. Errors bars represent the SD.
Extended Data Table 1.
Data for each of the 12 patients treated with Abi acetate.
| Patient | Time from last dose to blood draw |
Treatment duration (Month) |
Abi(nM) | D4A(nM) | 5α-Abi (nM) | 3α-OH-5α- Abi(nM) |
3β-OH-5α- Abi(nM) |
5β-Abi (nM) | 3α-OH-5β- Abi(nM) |
3β-OH-5β-Abi (nM) |
|---|---|---|---|---|---|---|---|---|---|---|
| #1 | 2h | 32 | 24.8 | 3.7 | 3.9 | 1.2 | 0.3 | 7.0 | 18.4 | 26.8 |
| #2 | 3h 15min | 3 | 611.3 | 20.7 | 82.0 | 8.5 | 2.8 | 129.9 | 48.2 | 99.5 |
| #3 | 13h 20min | 9 | 133.5 | 6.7 | 43.2 | 8.4 | 2.9 | 65.9 | 48.3 | 88.7 |
| #4 | 2h 30min | 26 | 138.8 | 3.7 | 30.6 | 3.3 | 1.5 | 17.1 | 9.8 | 19.5 |
| #5 | 4h 16min | 3 | 26.6 | 9.5 | 8.1 | 1.7 | 0.4 | 57.9 | 60.7 | 94.6 |
| #6 | 11h 15min | 4 | 197.0 | 15.4 | 43.1 | 9.3 | 3.2 | 49.2 | 53.0 | 70.7 |
| #7 | 6h 20min | 7 | 319.3 | 14.5 | 186.9 | 23.0 | 5.1 | 133.6 | 60.0 | 79.3 |
| #8 | 3h 15min | 4 | 6.3 | 0.8 | 1.7 | 0.6 | 0.2 | 2.6 | 9.0 | 4.3 |
| #9 | 9h 20min | 5 | 30.8 | 1.3 | 2.5 | 0.7 | 0.3 | 1.8 | 5.7 | 6.9 |
| #10 | 8h 10min | 4 | 47.8 | 8.0 | 10.4 | 2.5 | 1.0 | 53.3 | 74.3 | 79.9 |
| #11 | 10h 40min | 6 | 102.8 | 5.2 | 35.7 | 10.5 | 2.8 | 17.1 | 30.0 | 46.6 |
| #12 | 2h | 35 | 257.5 | 7.3 | 31.1 | 5.9 | 6.0 | 63.0 | 93.5 | 118.4 |
Extended Data Table 2.
Genes regulated by 5α-abi.
| SYMBOL | 5α-Abi/Ctrl | SYMBOL | 5α-Abi/Ctrl | SYMBOL | 5α-Abi/Ctrl | SYMBOL | 5α-Abi/Ctrl |
|---|---|---|---|---|---|---|---|
| ABCA1 | 1.832 | FLJ20021* | 2.372 | LOC440509* | 1.558 | SENP7* | 1.672 |
| ABCC4*† | 2.173 | FLJ27365 | 2.034 | LOC441763* | 1.838 | SERHL* | 1.613 |
| ABCG1 | 2.314 | FLJ41603* | 1.842 | LOC554208 | 1.643 | SERHL2* | 2.703 |
| ACACB | 1.677 | FLJ42562* | 1.850 | LOC643376 | 2.246 | SERPINE2* | 2.836 |
| ALDH4A1* | 1.712 | FOXC1* | 1.618 | LOC644096 | 1.760 | SGCB* | 2.219 |
| ANKRD29* | 2.336 | FOXN4* | 3.227 | LOC644584 | 1.929 | SGPP1* | 1.580 |
| ANKS3* | 1.561 | FOXQ1 | 1.590 | LOC646434 | 1.733 | SLAIN1 | 1.668 |
| ARL15 | 1.674 | FXYD3 | 1.631 | LOC646783* | 1.647 | SLC16A9* | 1.991 |
| BCAR3 | 1.712 | GAL3ST4 | 2.004 | LOC647104* | 1.954 | SLC45A3*† | 1.855 |
| BEND5 | 1.605 | GARNL3* | 1.673 | LOC651075* | 1.754 | SNORA58* | 1.793 |
| C10orf41 | 1.566 | GDF15* | 2.437 | LOC728178 | 1.772 | SORD* | 1.649 |
| C14orf159 | 1.831 | GHR* | 2.458 | LOC729799* | 1.677 | ST3GAL6* | 1.605 |
| C1orf116*† | 4.181 | HDAC11 | 1.564 | LPCAT4* | 1.949 | STXBP5 | 1.574 |
| C1orf21*† | 1.631 | HES6* | 1.779 | MAFB* | 2.184 | TBC1D16* | 1.597 |
| C1orf74* | 1.619 | HMGCS2 | 1.562 | MBOAT2 | 1.576 | THAP3 | 1.811 |
| C5orf41 | 1.634 | HMOX2 | 1.619 | MBP* | 1.671 | TINF2* | 1.687 |
| C6orf105* | 1.697 | HOMER2*† | 2.191 | MCOLN2 | 1.587 | TMEM45B | 2.023 |
| C7orf38 | 1.767 | HOXC8 | 1.650 | MGC16384 | 1.886 | TMPRSS2*† | 1.730 |
| CA12*† | 1.821 | HS6ST1* | 1.671 | MIR1974* | 1.566 | TRIM36* | 2.045 |
| CALCB | 1.610 | HSPA2* | 1.666 | NCRNA00153 | 1.552 | TRPM8*† | 1.601 |
| CAPN2* | 1.930 | IGSF21* | 2.067 | NKX3-l*† | 2.209 | TSPAN33* | 1.571 |
| CDC2L2 | 1.608 | JHDM1D | 1.621 | NOV* | 1.844 | UHMK1 | 1.764 |
| CDK6 | 1.575 | KCNK13* | 2.066 | NRK* | 1.761 | ULK2* | 1.841 |
| CHML | 1.553 | KCNK17 | 1.698 | NUMBL* | 1.902 | VWA3A | 1.571 |
| COL16A1* | 2.017 | KLK3*† | 3.084 | OAZ2* | 1.700 | WIZ | 1.627 |
| CPEB2* | 1.899 | KLK4* | 1.802 | ODF3L2* | 1.650 | YPEL1* | 2.116 |
| CPT1C | 1.604 | KRT126P* | 2.348 | PALMD* | 2.252 | ZFX* | 1.717 |
| CUEDC1 | 1.774 | LEPROT | 1.831 | PCDH20 | 1.969 | ZNF264 | 1.553 |
| CYP1B1 | 4.321 | LOC100008589* | 2.206 | PIGL* | 1.671 | ZNF30* | 1.577 |
| DDIT4L* | 3.243 | LOC100129674 | 1.586 | PM20D1 | 1.555 | ZNF350 | 1.751 |
| DIP2C* | 1.684 | LOC100130123* | 1.893 | PNPLA7* | 1.627 | ZNF414 | 1.899 |
| DIS3L2 | 1.696 | LOC100132394* | 1.700 | PP8961* | 1.554 | ZPLD1* | 3.579 |
| EDN1* | 1.575 | LOC100132564* | 1.894 | PPFIBP2* | 2.087 | B3Gn-T6* | 0.494 |
| EMP1* | 1.760 | LOC100133099 | 1.585 | PPP1R3E* | 1.563 | CAMK1G | 0.423 |
| ENDOD1*† | 2.467 | LOC100133565* | 2.217 | PRICKLE1* | 1.840 | CGA | 0.476 |
| EPR1* | 2.130 | LOC145837* | 1.680 | PTPRR* | 1.750 | FANCB | 0.445 |
| ETS2* | 1.998 | LOC388681 | 1.677 | PXK* | 1.880 | LOC100130775* | 0.473 |
| FAM129A* | 1.576 | LOC389286* | 2.196 | REPS2* | 1.807 | LOC347376 | 0.495 |
| FAM134B* | 2.035 | LOC389901 | 1.566 | RHOU | 1.584 | LOC440063 | 0.445 |
| FAM46B* | 1.688 | LOC400214 | 1.552 | RNF144A | 1.563 | MALL | 0.495 |
| FKBP5*† | 1.640 | LOC440122 | 1.617 | SASH1* | 1.560 | TTC7B | 0.477 |
co-regulated by DHT.
reported bona fide AR target gene.
Extended Data Table 3.
Concentrations of Abi and its metabolites in a phase II clinical trial (NCT01393730).
| Patient | #1 | #2 | #3 | #4 | #5 | #6 | #7 | #8 | #9 | #10 | #11 | #12 | #13 | #14 | #15 | #16 | |
|---|---|---|---|---|---|---|---|---|---|---|---|---|---|---|---|---|---|
| Abi | cycle 3 | 439.46 | 64.74 | 210.65 | 447.29 | 80.78 | 195.53 | 117.58 | 79.58 | 135.63 | 200.93 | 190.73 | 320.19 | 66.11 | 177.31 | 131.86 | 205.48 |
| cycle 4 | 1049.04 | 136.18 | 95.97 | 400.55 | 1399.54 | 288.80 | 214.26 | 207.19 | 148.05 | 393.35 | 219.20 | 569.72 | 173.93 | 203.84 | 178.06 | 289.94 | |
| cycle 7 | 1767.26 | 130.53 | 268.79 | 883.07 | 112.89 | 174.05 | 310.03 | 127.05 | 204.86 | 52.92 | 220.11 | 184.44 | 69.55 | 215.29 | 59.88 | 112.91 | |
| D4A | cycle 3 | 14.83 | 2.78 | 11.80 | 8.89 | 7.24 | 12.32 | 17.23 | 4.01 | 10.62 | 19.11 | 4.95 | 11.78 | 5.23 | 10.79 | 11.83 | 5.91 |
| cycle 4 | 34.24 | 8.83 | 7.75 | 13.86 | 34.49 | 28.84 | 23.70 | 13.01 | 11.01 | 16.71 | 11.91 | 32.84 | 12.35 | 13.09 | 17.91 | 10.73 | |
| cycle 7 | 69.00 | 8.32 | 13.64 | 36.14 | 15.61 | 18.63 | 17.47 | 7.96 | 15.60 | 4.98 | 10.89 | 11.01 | 7.04 | 32.40 | 10.64 | 6.71 | |
| 3-keto-5α-Abi | cycle 3 | 44.53 | 13.29 | 26.07 | 16.96 | 17.46 | 23.66 | 22.70 | 19.74 | 29.27 | 38.73 | 25.28 | 34.24 | 21.78 | 27.32 | 14.79 | 36.98 |
| cycle 4 | 1.73 | 4.28 | 1.78 | 0.80 | 3.53 | 1.53 | 2.89 | 0.94 | 2.04 | 1.95 | 0.91 | 1.64 | 8.36 | 3.44 | 8.44 | 2.80 | |
| cycle 7 | 4.34 | 0.49 | 0.71 | 8.97 | 9.43 | 0.81 | 1.41 | 0.61 | 13.65 | 0.56 | 0.86 | 0.80 | 4.86 | 11.30 | 6.95 | 5.05 | |
| 3α-0H-5α-Abi | cycle 3 | 15.81 | 4.45 | 4.04 | 3.80 | 4.53 | 5.65 | 4.12 | 4.86 | 8.80 | 9.57 | 5.56 | 8.82 | 5.52 | 6.16 | 2.69 | 3.27 |
| cycle 4 | 0.22 | 0.01 | 0.18 | 0.14 | 0.77 | 0.35 | 0.53 | 0.16 | 0.52 | 0.51 | 0.08 | 0.01 | 1.85 | 0.48 | 1.91 | 0.28 | |
| cycle 7 | 0.84 | 0.00 | 0.00 | 2.45 | 1.35 | 0.05 | 0.00 | 0.00 | 2.81 | 0.08 | 0.00 | 0.12 | 0.98 | 1.77 | 1.92 | 0.49 | |
| 3β-0H-5α-Abi | cycle 3 | 5.15 | 1.31 | 2.31 | 2.26 | 3.25 | 2.00 | 1.21 | 1.63 | 2.75 | 3.43 | 1.55 | 2.87 | 2.54 | 5.81 | 3.89 | 1.06 |
| cycle 4 | 0.31 | 0.03 | 0.60 | 0.21 | 2.16 | 0.09 | 0.31 | 0.06 | 0.32 | 0.20 | 0.09 | 0.17 | 1.17 | 1.93 | 3.83 | 0.16 | |
| cycle 7 | 0.59 | 0.01 | 0.13 | 4.04 | 2.32 | 0.04 | 0.17 | 0.07 | 3.22 | 0.05 | 0.12 | 0.12 | 0.50 | 5.59 | 2.69 | 0.31 | |
| 3-keto-5β-Abi | cycle 3 | 15.63 | 6.24 | 93.39 | 31.14 | 55.55 | 12.21 | 39.43 | 12.83 | 52.75 | 24.97 | 23.05 | 25.00 | 18.55 | 57.78 | 78.37 | 73.90 |
| cycle 4 | 53.05 | 20.41 | 41.95 | 43.95 | 65.31 | 24.55 | 51.38 | 58.97 | 24.22 | 63.34 | 26.42 | 36.53 | 28.47 | 60.61 | 73.60 | 127.48 | |
| cycle 7 | 141.23 | 17.17 | 42.09 | 75.30 | 101.40 | 25.41 | 24.44 | 24.65 | 47.59 | 20.24 | 34.29 | 18.47 | 29.70 | 205.11 | 56.29 | 102.62 | |
| 3α-0H-5β-Abi | cycle 3 | 41.95 | 14.63 | 86.05 | 44.46 | 70.25 | 19.57 | 37.12 | 21.94 | 86.71 | 31.06 | 31.93 | 42.80 | 33.90 | 98.26 | 76.44 | 28.59 |
| cycle 4 | 42.31 | 36.79 | 55.14 | 27.67 | 34.26 | 34.66 | 70.21 | 53.53 | 75.32 | 44.13 | 31.55 | 76.59 | 42.91 | 39.17 | 68.02 | 36.96 | |
| cycle 7 | 110.85 | 29.24 | 63.35 | 99.70 | 48.28 | 35.00 | 37.37 | 38.95 | 57.38 | 24.67 | 46.16 | 34.37 | 33.17 | 142.07 | 68.89 | 37.41 | |
| 3β-0H-5β-Abi | cycle 3 | 35.68 | 18.41 | 121.85 | 96.16 | 129.09 | 23.92 | 33.38 | 33.95 | 103.67 | 59.47 | 41.23 | 65.71 | 31.22 | 216.92 | 127.26 | 48.69 |
| cycle 4 | 36.33 | 40.71 | 115.43 | 54.54 | 50.89 | 35.06 | 72.74 | 78.52 | 82.78 | 77.29 | 35.08 | 83.37 | 39.21 | 125.80 | 114.74 | 71.33 | |
| cycle 7 | 95.93 | 26.97 | 80.34 | 180.42 | 114.67 | 40.48 | 41.48 | 52.28 | 73.76 | 40.39 | 51.22 | 47.96 | 42.08 | 387.83 | 106.73 | 82.47 | |
Supplementary Material
Acknowledgments
We thank Trevor Penning (University of Pennsylvania) for use of the AKR1C2 construct and David Russell (University of Texas Southwestern Medical Center) for LY191704. This work has been supported in part by funding from a Howard Hughes Medical Institute Physician-Scientist Early Career Award (to N.S.), a Prostate Cancer Foundation Challenge Award (to N.S.), an American Cancer Society Research Scholar Award (12-038-01-CCE; to N.S.), grants from the National Cancer Institute (R01CA168899, R01CA172382, and R01CA190289; to N.S.), a grant from the US Army Medical Research and Materiel Command (PC121382 to Z.L.), a Prostate Cancer Foundation Young Investigator Award to Z.L., and a Prostate Cancer Foundation Challenge Award (to SPB). Janssen provided clinical trial support (to ME.T.).
Footnotes
Author Contributions
Z.L. performed gene expression, metabolism and mouse work. M.A. performed mass spectrometry metabolism work. J.L. performed immunoblots. S.U. performed chemical syntheses. K.G. and M.A. performed the microarray GSEA analysis. M-E.T. and S.P.B. designed and performed a clinical trial. Z.L., M.A., R.J.A. and N.S. designed the studies and wrote the manuscript. All authors discussed the results and commented on the manuscript.
References
- 1.Attard G, et al. Prostate cancer. Lancet. 2015 doi: 10.1016/S0140-6736(14)61947-4. [DOI] [Google Scholar]
- 2.Sharifi N. Mechanisms of androgen receptor activation in castration-resistant prostate cancer. Endocrinology. 2013;154:4010–4017. doi: 10.1210/en.2013-1466. [DOI] [PMC free article] [PubMed] [Google Scholar]
- 3.Li Z, et al. Conversion of abiraterone to D4A drives anti-tumour activity in prostate cancer. Nature. 2015 doi: 10.1038/nature14406. [DOI] [PMC free article] [PubMed] [Google Scholar]
- 4.Chang KH, et al. A gain-of-function mutation in DHT synthesis in castration-resistant prostate cancer. Cell. 2013;154:1074–1084. doi: 10.1016/j.cell.2013.07.029. [DOI] [PMC free article] [PubMed] [Google Scholar]
- 5.Scher HI, Sawyers CL. Biology of progressive, castration-resistant prostate cancer: directed therapies targeting the androgen-receptor signaling axis. J Clin Oncol. 2005;23:8253–8261. doi: 10.1200/JCO.2005.03.4777. 23/32/8253 [pii] [DOI] [PubMed] [Google Scholar]
- 6.de Bono JS, et al. Abiraterone and increased survival in metastatic prostate cancer. The New England journal of medicine. 2011;364:1995–2005. doi: 10.1056/NEJMoa1014618. [DOI] [PMC free article] [PubMed] [Google Scholar]
- 7.Ryan CJ, et al. Abiraterone in Metastatic Prostate Cancer without Previous Chemotherapy. The New England journal of medicine. 2012 doi: 10.1056/NEJMoa1209096. [DOI] [PMC free article] [PubMed] [Google Scholar]
- 8.Chang KH, et al. Dihydrotestosterone synthesis bypasses testosterone to drive castration-resistant prostate cancer. Proceedings of the National Academy of Sciences of the United States of America. 2011;108:13728–13733. doi: 10.1073/pnas.1107898108. 1107898108 [pii] [DOI] [PMC free article] [PubMed] [Google Scholar]
- 9.Russell DW, Wilson JD. Steroid 5 alpha-reductase: two genes/two enzymes. Annu Rev Biochem. 1994;63:25–61. doi: 10.1146/annurev.bi.63.070194.000325. [DOI] [PubMed] [Google Scholar]
- 10.Hirsch KS, et al. LY191704: a selective, nonsteroidal inhibitor of human steroid 5 alpha-reductase type 1. Proceedings of the National Academy of Sciences of the United States of America. 1993;90:5277–5281. doi: 10.1073/pnas.90.11.5277. [DOI] [PMC free article] [PubMed] [Google Scholar]
- 11.Clark RV, et al. Marked suppression of dihydrotestosterone in men with benign prostatic hyperplasia by dutasteride, a dual 5alpha-reductase inhibitor. The Journal of clinical endocrinology and metabolism. 2004;89:2179–2184. doi: 10.1210/jc.2003-030330. [DOI] [PubMed] [Google Scholar]
- 12.Rizner TL, et al. Human type 3 3alpha-hydroxysteroid dehydrogenase (aldo-keto reductase 1C2) and androgen metabolism in prostate cells. Endocrinology. 2003;144:2922–2932. doi: 10.1210/en.2002-0032. [DOI] [PubMed] [Google Scholar]
- 13.Byrne GC, Perry YS, Winter JS. Steroid inhibitory effects upon human adrenal 3 beta-hydroxysteroid dehydrogenase activity. The Journal of clinical endocrinology and metabolism. 1986;62:413–418. doi: 10.1210/jcem-62-2-413. [DOI] [PubMed] [Google Scholar]
- 14.Arora VK, et al. Glucocorticoid receptor confers resistance to antiandrogens by bypassing androgen receptor blockade. Cell. 2013;155:1309–1322. doi: 10.1016/j.cell.2013.11.012. [DOI] [PMC free article] [PubMed] [Google Scholar]
- 15.Attard G, et al. Clinical and biochemical consequences of CYP17A1 inhibition with abiraterone given with and without exogenous glucocorticoids in castrate men with advanced prostate cancer. The Journal of clinical endocrinology and metabolism. 2012;97:507–516. doi: 10.1210/jc.2011-2189. jc.2011-2189 [pii] [DOI] [PubMed] [Google Scholar]
- 16.Taplin ME, et al. Intense Androgen-Deprivation Therapy With Abiraterone Acetate Plus Leuprolide Acetate in Patients With Localized High-Risk Prostate Cancer: Results of a Randomized Phase II Neoadjuvant Study. J Clin Oncol. 2014 doi: 10.1200/JCO.2013.53.4578. [DOI] [PMC free article] [PubMed] [Google Scholar]
- 17.Robinson D, et al. Integrative clinical genomics of advanced prostate cancer. Cell. 2015;161:1215–1228. doi: 10.1016/j.cell.2015.05.001. [DOI] [PMC free article] [PubMed] [Google Scholar]
- 18.Carreira S, et al. Tumor clone dynamics in lethal prostate cancer. Science translational medicine. 2014;6:254ra125. doi: 10.1126/scitranslmed.3009448. [DOI] [PMC free article] [PubMed] [Google Scholar]
- 19.Miyamoto DT, et al. Androgen receptor signaling in circulating tumor cells as a marker of hormonally responsive prostate cancer. Cancer Discov. 2012;2:995–1003. doi: 10.1158/2159-8290.CD-12-0222. [DOI] [PMC free article] [PubMed] [Google Scholar]
- 20.Mostaghel EA, et al. Resistance to CYP17A1 Inhibition with Abiraterone in Castration-Resistant Prostate Cancer: Induction of Steroidogenesis and Androgen Receptor Splice Variants. Clinical cancer research: an official journal of the American Association for Cancer Research. 2011;17:5913–5925. doi: 10.1158/1078-0432.CCR-11-0728. 1078-0432.CCR-11-0728 [pii] [DOI] [PMC free article] [PubMed] [Google Scholar]
- 21.Biswas MG, Russell DW. Expression cloning and characterization of oxidative 17beta- and 3alpha-hydroxysteroid dehydrogenases from rat and human prostate. The Journal of biological chemistry. 1997;272:15959–15966. doi: 10.1074/jbc.272.25.15959. [DOI] [PubMed] [Google Scholar]
- 22.Mohler JL, et al. Activation of the androgen receptor by intratumoral bioconversion of androstanediol to dihydrotestosterone in prostate cancer. Cancer research. 2011;71:1486–1496. doi: 10.1158/0008-5472.CAN-10-1343. 0008-5472.CAN-10-1343 [pii] [DOI] [PMC free article] [PubMed] [Google Scholar]
- 23.Papari-Zareei M, Brandmaier A, Auchus RJ. Arginine 276 controls the directional preference of AKR1C9 (rat liver 3alpha-hydroxysteroid dehydrogenase) in human embryonic kidney 293 cells. Endocrinology. 2006;147:1591–1597. doi: 10.1210/en.2005-1141. [DOI] [PubMed] [Google Scholar]
- 24.Li Z, et al. Conversion of abiraterone to D4A drives anti-tumour activity in prostate cancer. Nature. 2015;523:347–351. doi: 10.1038/nature14406. [DOI] [PMC free article] [PubMed] [Google Scholar]
- 25.Liu LL, et al. Mechanisms of the androgen receptor splicing in prostate cancer cells. Oncogene. 2014;33:3140–3150. doi: 10.1038/onc.2013.284. [DOI] [PMC free article] [PubMed] [Google Scholar]
- 26.Hornberg E, et al. Expression of androgen receptor splice variants in prostate cancer bone metastases is associated with castration-resistance and short survival. PLoS One. 2011;6:e19059. doi: 10.1371/journal.pone.0019059. [DOI] [PMC free article] [PubMed] [Google Scholar]
- 27.Deng W, Wang Y, Liu Z, Cheng H, Xue Y. HemI: a toolkit for illustrating heatmaps. PLoS One. 2014;9:e111988. doi: 10.1371/journal.pone.0111988. [DOI] [PMC free article] [PubMed] [Google Scholar]
- 28.Gentleman RC, et al. Bioconductor: open software development for computational biology and bioinformatics. Genome Biol. 2004;5:R80. doi: 10.1186/gb-2004-5-10-r80. [DOI] [PMC free article] [PubMed] [Google Scholar]
- 29.Hanzelmann S, Castelo R, Guinney J. GSVA: gene set variation analysis for microarray and RNA-seq data. BMC Bioinformatics. 2013;14:7. doi: 10.1186/1471-2105-14-7. [DOI] [PMC free article] [PubMed] [Google Scholar]
- 30.Subramanian A, et al. Gene set enrichment analysis: a knowledge-based approach for interpreting genome-wide expression profiles. Proceedings of the National Academy of Sciences of the United States of America. 2005;102:15545–15550. doi: 10.1073/pnas.0506580102. [DOI] [PMC free article] [PubMed] [Google Scholar]
- 31.Mootha VK, et al. PGC-1alpha-responsive genes involved in oxidative phosphorylation are coordinately downregulated in human diabetes. Nature genetics. 2003;34:267–273. doi: 10.1038/ng1180. [DOI] [PubMed] [Google Scholar]
Associated Data
This section collects any data citations, data availability statements, or supplementary materials included in this article.


