Significance
Resistant starch (RS) has the potential to protect against diabetes and reduce the incidence of diarrhea, inflammatory bowel disease, colon cancer, and chronic renal and hepatic diseases. In this study, we identified two critical starch synthase genes which together regulate RS biosynthesis in rice, and we explored their potential interactions as part of a network of starch biosynthetic enzymes. The findings hold promise for applications in breeding varieties with improvement of RS in hot cooked rice and may also have general implications for understanding RS biosynthesis in other major cereal crops.
Keywords: diabetes, resistant starch biosynthesis, soluble starch synthase, granule-bound starch synthase, amylose–lipid complex
Abstract
Changes in human lifestyle and food consumption have resulted in a large increase in the incidence of type-2 diabetes, obesity, and colon disease, especially in Asia. These conditions are a growing threat to human health, but consumption of foods high in resistant starch (RS) can potentially reduce their incidence. Strategies to increase RS in rice are limited by a lack of knowledge of its molecular basis. Through map-based cloning of a RS locus in indica rice, we have identified a defective soluble starch synthase gene (SSIIIa) responsible for RS production and further showed that RS production is dependent on the high expression of the Waxya (Wxa) allele, which is prevalent in indica varieties. The resulting RS has modified granule structure; high amylose, lipid, and amylose–lipid complex; and altered physicochemical properties. This discovery provides an opportunity to increase RS content of cooked rice, especially in the indica varieties, which predominates in southern Asia.
Increases in the incidence of type-2 diabetes are being observed throughout the world. This increase is thought to be due to changes in both diet and lifestyle (1, 2) and is increasingly apparent in Asia. Consumption of foods high in resistant starch (RS) can help to control type-2 diabetes, because its slow digestion and absorption by the small intestine decreases postprandial glucose and insulin responses (3). Foods high in RS also potentially protect against pathogen infection, diarrhea, inflammatory bowel disease, colon cancer, and chronic renal and hepatic diseases. Consumption of RS can increase satiety and reduce calorie intake to help weight management (3). Thus, improvement of the amounts and properties of RS in foods is an important goal.
Rice (Oryza sativa L.) is consumed by more than half the world’s population (4), and for many, it is the primary source of nutrients and carbohydrates for energy. Consumption of 18–20 g of RS (5, 6) is recommended per day for health benefits, but hot cooked rice typically contains <3% RS (7). Rice varieties or mutants with improved RS have been identified, such as Goami No. 2, Gongmi No. 3, RS111, and Jiangtangdao 1 (7–10).
A high-RS, high-amylose transgenic rice line has been developed by suppressing the expression of starch branching enzymes (SBEs) (11) and a mutation of SBEIIb cosegregated with RS content in rice (8). In other cereals, down-regulation of soluble starch synthase (SS) SSIIa and of SBE results in greater RS in barley (12, 13) and wheat (14–20). Because the molecular basis underlying RS production is largely unknown, discovery of new RS genes is vital both for the elucidation of RS biosynthesis and for the breeding of high-RS varieties. We therefore screened a mutagenized population of the hybrid-rice restorer line R7954 for mutants with high RS in hot cooked rice. This strategy was designed to identify new RS genes of practical value in commercially relevant indica rice varieties. Here we report the characterization of one such mutant, revealing that mutations in the starch synthase IIIa (SSIIIa) gene, in combination with a highly expressed Waxy (Wx) gene, lead to a high level of RS.
Results
Mutation of Soluble Starch Synthase Gene SSIIIa Results in RS Elevation in a Mutant, b10.
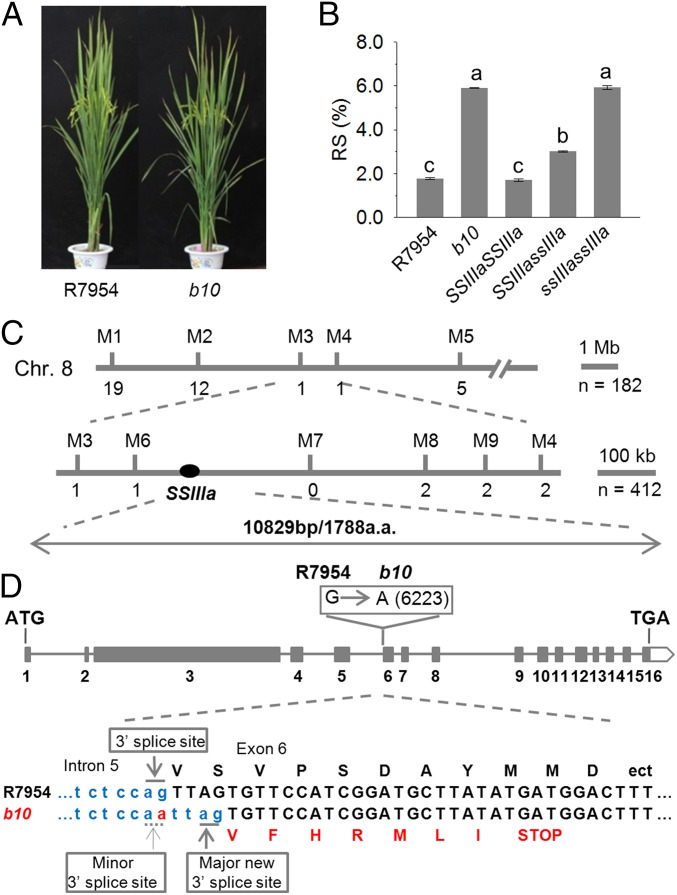
To find new genes for RS, we screened a population of gamma-radiated hybrid-rice restorer line R7954 and identified a mutant, b10, which confers high RS in cooked rice (Fig. 1 A and B). To clone the b10 gene, we took a map-based cloning approach (Fig. 1C). In the F2 population, plants with high RS segregated from plants with low and intermediate RS in a 1:3 ratio (13:49; χ2 = 0.54; P = 0.46), suggesting that a single loss-of-function gene is responsible for RS (Fig. 1B). The target gene was first located on chromosome 8, and then a larger-scale linkage analysis of 412 plants, segregating for RS, was performed, locating the gene in a 456-kb region between the M6 and M8 markers (Fig. 1C). The Gramene Database (www.gramene.org/) predicts 76 protein-coding genes in this region, one encoding a soluble starch synthase (SSIIIa; LOC_Os08g09230).
Fig. 1.
Characterization of the RS mutant b10 and positional cloning of the B10 gene. (A) Plant phenotype of the wild type (R7954) and the high-RS mutant (b10). (B) RS contents of grains from R7954 and b10 and from plants carrying different SSIIIa alleles in an F2 population from a cross between R7954 and b10. Error bars represent ±SEM (n = 62). Different letters above bars indicate significant differences at P < 0.05, using Tukey’s multiple comparison test. (C) Mapping of the target gene between the markers M6 and M8 on the short arm of chromosome 8. Numbers below the lines indicate the number of recombinants between the locus and the markers shown. (D) SSIIIa gene structure and mutation site. Filled boxes indicate exons (numbered 1–16) of SSIIIa. Site of the mutation from G to A in SSIIIa of b10 is shown in the open box above exon 6. Nucleotide sequences of the junction between intron 5 and exon 6 in R7954 and b10 are shown in Lower, with deduced amino acid sequences. The mutated nucleotide in b10 is shown in red, together with the loss of original 3′ splice site and creation of a new 3′ splice site. The mutation generates a recognition site for MluC I (AATT), which is used to generate a CAPS marker (Fig. S1) to determine genotypes of the plants shown in B.
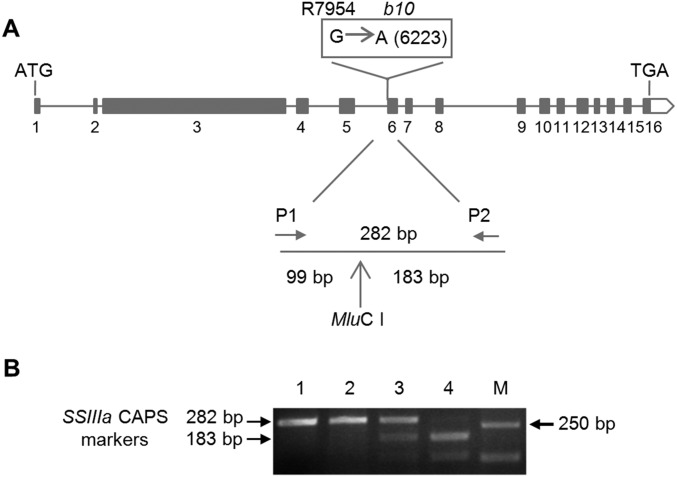
Genomic sequence analysis showed that SSIIIa in R7954 encompasses ∼10 kb, comprising 16 exons and 5,367 bp encoding a predicted protein of 1,788 amino acid residues. Comparing SSIIIa DNA sequence between R7954 and b10 revealed a G-to-A mutation at the 3′ splice site of intron 5 in b10 (Fig. 1D). This mutation is predicted to result in a novel splice site, leading to a 4-bp deletion in the SSIIIa coding sequence and a frame shift introducing a premature stop codon and a truncated protein of 1,302 amino acid residues. Sequence analysis of cDNA from b10 confirmed the new splicing site and frame-shift (Fig. 1D). The G-to-A mutation introduced a MluC I restriction enzyme site at the 3′ splice site of intron 5 in b10. This site was used to digest a 282-bp fragment obtained by PCR on genomic DNA of a F2 population from b10 crossed to R7954 to show cosegregation of the ssIIIa gene and RS (Fig. S1). The homozygous mutant ssIIIassIIIa plants had 5.8% RS, three times more than that of wild-type R7954 plants (SSIIIaSSIIIa), whereas heterozygotes (SSIIIassIIIa) had intermediate RS of 3.3%, indicating partial dominance of SSIIIa (Fig. 1B).
Fig. S1.
Use of CAPS marker to follow the inheritance of SSIIIa genes. (A) Positions of primers used to amplify a 282-bp fragment spanning the mutation site in b10. (B) Genotyping of SSIIIa alleles using the SSIIIa CAPS marker. M represents DNA size markers. Lane 1, DNA from wild-type plants (R7954); lanes 2, 3, and 4 represent homozygous SSIIIaSSIIIa, heterozygous SSIIIassIIIa, and homozygous ssIIIassIIIa plants, respectively.
Biosynthesis of RS Is Regulated by SSIIIa in Rice.
To confirm that the ssIIIa gene is responsible for high RS, b10 was transformed with a 15.6-kb wild-type genomic fragment containing the entire gene (gSSIIIa) and with a cDNA driven by a rice Ubiquitin promoter (Ubi:cSSIIIa). In both cases, the RS content was lowered to wild-type levels (Fig. 2A). We further showed that suppression of SSIIIa expression in R7954 using RNA interference (RNAi) recapitulated the b10 phenotype by increasing RS content (Fig. 2A). In all cases, changes in SSIIIa gene expression were confirmed by quantitative RT-PCR (qRT-PCR) and immunoblotting (Fig. 2 B and C). A very faint band of SSIIIa detected in immunoblots of b10 proteins (Fig. 2C) suggested that inefficient splicing at the original 3′ splice site occurs with low efficiency (Fig. 1D).
Fig. 2.
Confirmation of SSIIIa as responsible for the RS phenotype of b10. (A) RS contents of the wild-type R7954, the mutant b10, an SSIIIa RNAi line in the R7954 background in which the transgene is driven by the ubiquitin promoter (SSIIIa RNAi/R7954), the b10 mutant complemented with a genomic fragment covering the complete SSIIIa wild-type gene (SSIIIa:gSSIIIa/b10), and the b10 mutant complemented with a SSIIIa cDNA driven by the ubiquitin promoter (Ubi:cSSIIIa/b10). Error bars indicate ±SEM (n = 3). (B) qRT-PCR of SSIIIa expression levels in RNA isolated from developing seeds of the genotypes described in A. Reference gene was Actin, and results are presented relative to the expression level in R7954. Different letters above bars indicate significant differences at P < 0.05, using Tukey's multiple comparison test. (C) Immunoblotting of protein isolated from developing grains of the genotypes described in A and probed with polyclonal antibodies raised against rice SSIIIa (Upper) and actin (Lower). Molecular mass markers are shown on the left.
For further confirmation, two T-DNA mutants were characterized, one in the Dongjin (DJ) variety and one in Zhonghua 11 (ZH11), both with insertions in the 11th exon of the SSIIIa gene (Fig. S2A). The mutant in the DJ variety was previously described as the white-core floury-endosperm mutant flo5-1 (21). The two homozygous T-DNA insertion mutants increased RS content from ∼1% to 4.2% and 3.5%, respectively (Fig. S2 B and C), consistent with a fourfold increase from ∼1.5% to nearly 6% in b10 (Fig. 2A), but the absolute RS contents in both DJ and ZH11 mutants were significantly lower than that in b10. Because the DJ and ZH11 varieties are both japonica subspecies, the differences in RS content might be attributed to an interaction between the ssIIIa allele and genes that differ between japonica and indica (see below).
Fig. S2.
Identification of T-DNA insertion mutants and their contents of RS. (A) Schematic representation of T-DNA insertions in the SSIIIa gene. The position of the T-DNA inserts are indicated above the gene for the DJ variety and below the gene for the ZH11 variety. The ssIIIa mutant in DJ variety was previously characterized and named flo5-1 (21), but was independently characterized in the present work. Positions of primers for PCR are indicated. (B) PCR identification of mutant genotypes using leaf DNA templates. The deduced genotypes of DNA in lanes 1–4 are indicated below the gels. M, size markers. (C) Content of RS in grains of T-DNA insertion mutants and the wild-type controls. Error bars indicate ±SEM. Different letters above bars indicate significant differences at P < 0.05 (n = 3), using Tukey’s multiple-comparison test.
Grain Qualities and Physicochemical Properties of Starch Are Determined by SSIIIa.
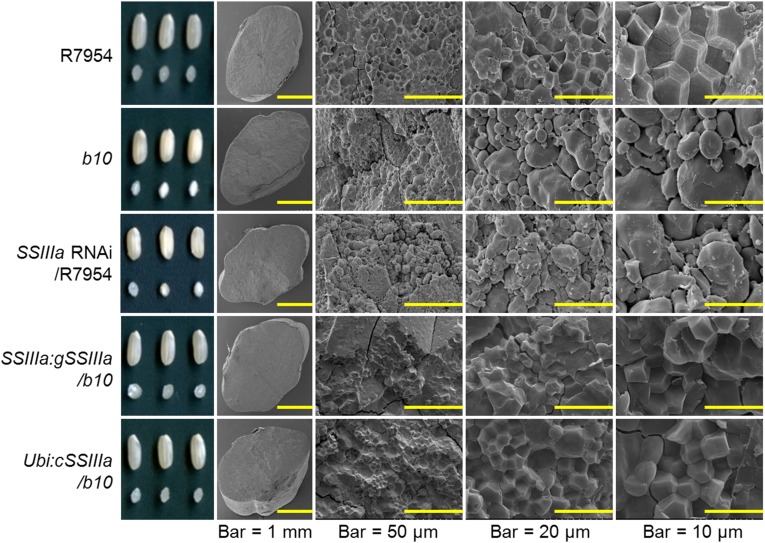
Examination of polished grains by light microscopy showed that b10 and SSIIIa RNAi transgenic lines have a floury appearance, compared with R7954 and transgenic lines expressing SSIIIa (Fig. 3). Scanning electron microscopy (SEM) of fractured surfaces of grains of R7954 revealed similarly sized polygonal starch granules with sharp edges, smooth flat surfaces, and compound starch granules (Fig. 3). In contrast, the granules in b10 were rounded, variable in size and shape, and with irregular surfaces. Granules in transgenic lines expressing SSIIIa appeared similar to those of R7954, whereas those of SSIIIa RNAi transgenic lines were similar to those of b10 (Fig. 3). These observations are consistent with those made for flo5 mutants (21).
Fig. 3.
Morphology of seeds and endosperm from plants with different SSIIIa genotypes. Representative samples of intact seeds and transverse sections revealed by light microscopy are shown in Left. Scanning electron micrographs of the endosperm in transverse sections are shown with increasing magnification from left to right. Genotypes are the same as shown in Fig. 2.
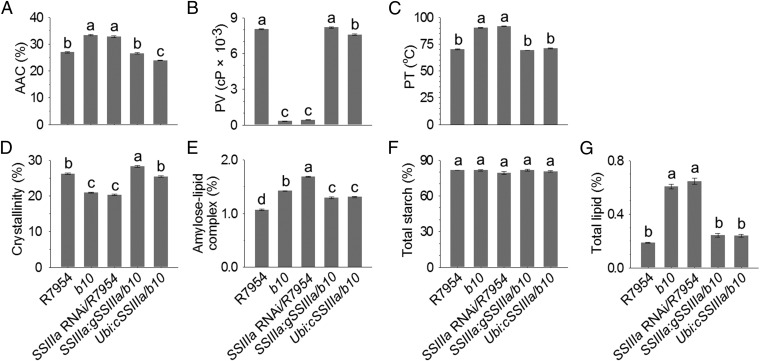
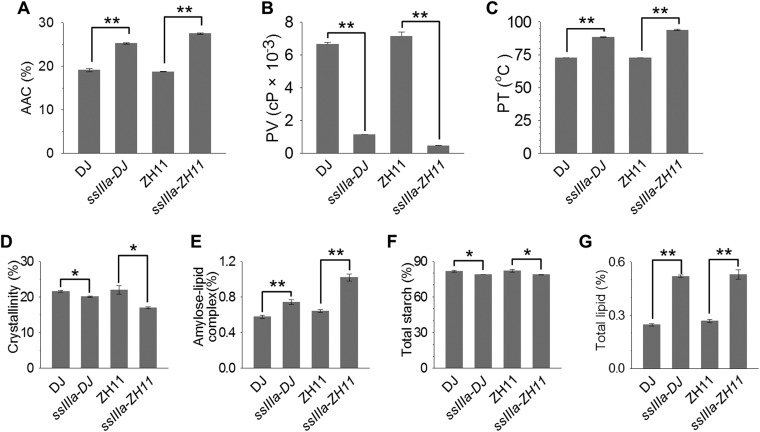
Starch from b10 and SSIIIa RNAi grains showed increased apparent amylose content (AAC), reduced peak viscosity (PV), and elevated pasting temperature (PT) (Fig. 4 A–C), which are also mainly determined by Wx (22) and ALK (23) genes. These properties were restored to wild type in b10 lines transformed with SSIIIa genes, demonstrating that SSIIIa is a key determinant of starch quality (Fig. 4 A–C). Starch from T-DNA mutants showed similar changes in AAC, PT, and PV (Fig. S3 A–C), and these findings are consistent with the previous report of increased amylose in starch of flo5 mutants (21). The increase in PT is consistent with previous report in SSIIIa RNAi (24), whereas the reported decrease in gelatinization temperature (21) is apparently inconsistent with the observed increase in PT (Fig. S3C); these results could be attributed to the use of different techniques of differential scanning calorimetry and Rapid Visco Analysis, respectively.
Fig. 4.
Physicochemical properties of starch from grains of plants with different SSIIIa genotypes. (A) AAC expressed as a percentage of dry weight. (B) PVs measured in centipoise (cP). (C) PTs. (D) Crystallinity values determined from X-ray diffraction patterns. (E) Content of amylose–lipid complex determined from X-ray diffraction patterns. (F) Total starch content of grains. (G) Total lipid content. Starch was isolated from mature grains. Genotypes are the same as described in Fig. 2. Error bars show ±SEM. Different letters above bars indicate significant differences at P < 0.05 (n = 3), using Tukey’s multiple-comparison test.
Fig. S3.
Physicochemical properties of grains from ssIIIa T-DNA insertion mutants. (A) AAC expressed as a percentage of dry weight. (B) PVs measured in centipoise (cP). (C) PTs. (D) Crystallinity values determined from X-ray diffraction patterns. (E) Content of amylose–lipid complex determined from X-ray diffraction patterns. (F) Total starch content of grains. (G) Total lipid content. Starch was isolated from mature grains. Genotypes are the same as shown in Fig. S2, Error bars show ±SEM. Asterisks * and ** indicate significant differences in Student's t test at P < 0.05 and P < 0.01, respectively (n = 3).
Isolated starch was analyzed by X-ray diffraction (Fig. S4), revealing that b10 and SSIIIa RNAi lines had lower crystallinity (Fig. 4D) and greater amylose-lipid complex (Fig. 4E), as did the T-DNA mutants (Fig. S3 D and E). This observation is important because amylose–lipid complex constitutes RS type 5 (25). Analysis of chain lengths of amylopectin separated from amylose and then debranched revealed only minor differences between genotypes (Fig. S5), consistent with previous results obtained for ssIIIa mutants (21, 26). The amount of starch was not altered in grains of b10 and SSIIIa RNAi transgenic lines (Fig. 4F) or was slightly reduced by up to 3% (wt/wt) in T-DNA mutants (Fig. S3F), whereas total lipid increased twofold to threefold (Fig. 4G and Fig. S3G), consistent with the increase in amylose–lipid complex.
Fig. S4.
The effects of SSIIIa expression on the crystallinity of starch. Starch granules were prepared from grains and subjected to X-ray diffraction/scattering. (A) X-ray diffraction patterns of starch from SSIIIa mutant b10, the wild-type parent R7954 and transgenic lines. (B) X-ray diffraction patterns of starch from SSIIIa T-DNA mutant lines (ssIIIa-DJ and -ZH11) and the wild-type parents DJ and ZH11.
Fig. S5.
The effects of SSIIIa expression on the chain length distribution of amylopectin. (A) Chain-length distribution patterns of endosperm amylopectin from SSIIIa mutant b10, the wild-type parent R7954, and transgenic lines. (B) Chain-length distribution patterns of endosperm amylopectin from SSIIIa T-DNA mutant lines (ssIIIa-DJ and -ZH11) and the wild-type parents DJ and ZH11.
Increased RS Content Mediated by SSIIIa Requires High Expression Level of the Waxy Gene That Encodes Granule-Bound Starch Synthase I.
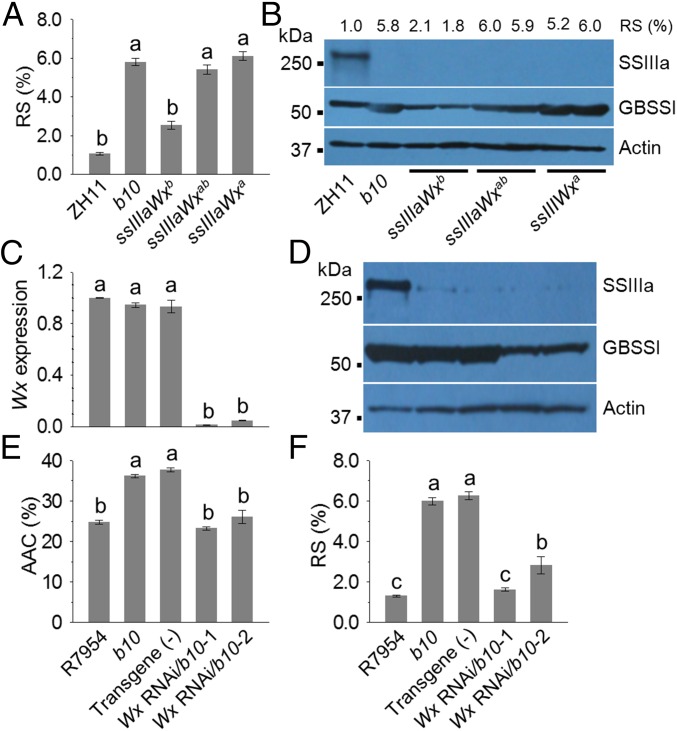
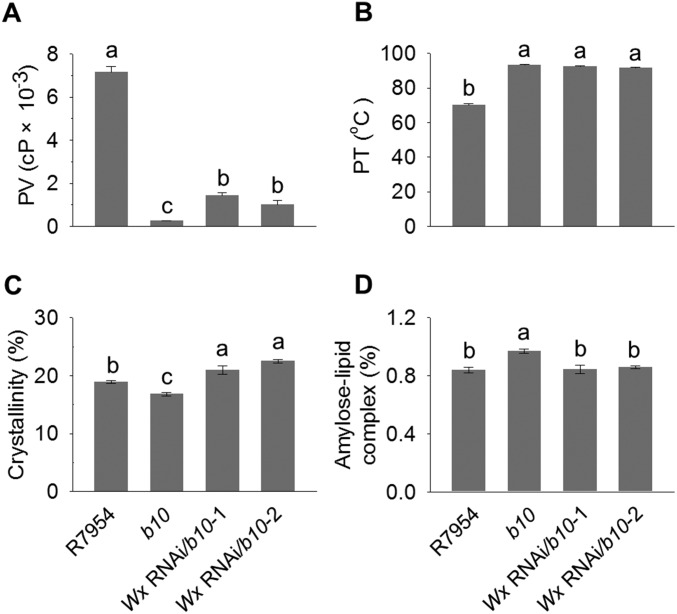
The Wx gene encoding granule-bound starch synthase I (GBSSI) has two major alleles, Wxa and Wxb, which occur predominantly in indica and japonica subspecies, respectively (27). The japonica Wxb allele carries a substitution mutation at the 5′ splice site of the first intron, which reduces the amounts of Wx mRNA and GBSSI in developing endosperm (28, 29). Genetic interactions between SSIIIa and Wx genes are known to influence amylose content in japonica rice (26). We therefore analyzed the Wx genotype of the F2 populations from a cross between homozygous ZH11 (SSIIIa, Wxb) and b10 (ssIIIa, Wxa). Combining the homozygous ssIIIa mutant with homozygous indica WxaWxa alleles resulted in high RS (6.1%), whereas the heterozygous WxaWxb alleles had 5.4% and the homozygous japonica WxbWxb alleles resulted in 2.6% RS (Fig. 5A). Immunoblotting analysis confirmed the low amount of GBSSI protein in WxbWxb progeny (Fig. 5B). The highly significant correlation (0.47; P < 0.0001) between RS and Wx strongly suggested that RS variation among plants carrying ssIIIa arises from the different Wx alleles. To confirm that high-level expression of the Wx gene is required for RS production, b10 was transformed with a Wx RNAi construct. Two b10 lines showing strong silencing of Wx at RNA and protein levels (Fig. 5 C and D) showed lower levels of AAC and RS (Fig. 5 E and F), and also showed higher PV and crystallinity with lower amylose–lipid complex content (Fig. S6). These results confirm the importance of Wx in RS production.
Fig. 5.
Effect of different Wx alleles on RS production. The segregating F2 progeny of a cross between b10 (ssIIIa, Wxa) and ZH11 (SSIIIa, Wxb) were screened for plants homozygous for ssIIIa, and homozygous for either Wxa or Wxb alleles, or heterozygous (Wxab). (A) RS contents in grains from plants carrying different Wx alleles. Error bars indicate ±SEM (n = 84). (B) Protein levels in grains from plants were detected by immunoblotting using antibodies recognizing SSIIIa, GBSSI and Actin. The wild-type ZH11 and mutant b10 were analyzed together with two independent lines (1 and 2) of each Wx genotype. Molecular mass (kDa) markers are shown on the left. The RS content of the seeds of these plants was also analyzed and is shown above the immunoblot. (C) Wx RNA levels in RNA isolated from developing grains, determined by qRT-PCR relative to the Actin reference gene, and results are expressed relative to R7954. Error bars indicate ±SEM (n = 3). (D) Immunoblotting of SSIIIa, GBSSI, and Actin in developing grains from these plants. Molecular mass markers are shown on the left. (E) AAC expressed as a percentage of dry weight. (F) RS contents of grains from these plants expressed as percent (wt/wt). Starch was isolated from mature grains. Error bars represent ±SEM (n = 3). Different letters above bars indicate significant differences at P < 0.05, using Tukey’s multiple comparison test. For C–F, mutant b10 was transformed with a Wx RNAi transgene driven by the ubiquitin promoter to reduce Wx expression. Two independent lines with low Wx RNA level were shown (Wx RNAi/b10-1 and Wx RNAi/b10-2), whereas a line with no transgene (−) together with R7954 and b10 served as controls.
Fig. S6.
Physicochemical properties of starch from grains of plants with repression of Wx. (A) PVs measured in cP. (B) PTs. (C) Crystallinity values determined from X-ray diffraction patterns. (D) Content of amylose–lipid complex determined from X-ray diffraction patterns. Starch was isolated from mature grains. Genotypes are the same as described in Fig. 5. Error bars show ±SEM. Different letters above bars indicate significant differences at P < 0.05 (n = 3), using Tukey’s multiple comparison test.
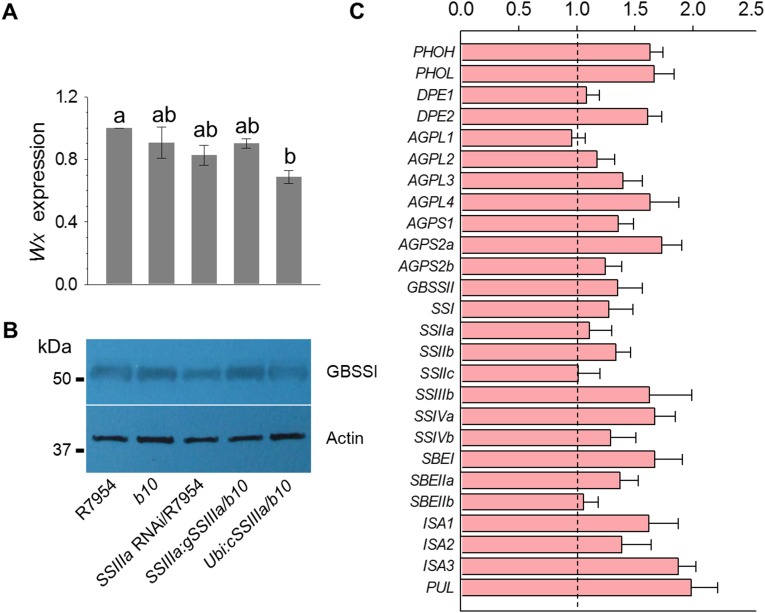
Previous studies of an ssIIIa mutant in japonica reported that the mutation leads to an increase in the expression of the Wxb gene, an increase in the amount of GBSSI protein, and a 1.3-fold increase in the amount of amylose (26). In a subsequent study, a Wxa transgene was introduced into a japonica background, leading to a high level of GBSSI protein as expected, but the expression level was not further increased in a homozygous ssIIIa mutant, potentially because the GBSSI level was already maximal (30). However, the amylose content did increase in a ssIIIa background, suggesting an additional posttranslational control of amylose accumulation. Because our genetic analysis revealed an interaction between the ssIIIa mutation and the Wx allele in RS formation, we investigated whether ssIIIa affects Wx expression in the indica background. The level of Wx RNA was measured by qRT-PCR and the amount of GBSSI protein by immunoblotting in SSIIIa and ssIIIa backgrounds. The ssIIIa mutation did not significantly increase the amount of GBSSI RNA or protein (Fig. S7 A and B), implying that any interactions were likely to occur at the posttranslational level. Furthermore, we analyzed expression of many other genes of starch metabolism in b10 relative to R7954, but observed only minor or moderate changes in expression (Fig. S7C).
Fig. S7.
Expression levels of the genes involved in starch biosynthesis in endosperms from SSIIIa mutant b10, the wild-type parent R7954, and transgenic lines. (A) Level of Wx RNA in the SSIIIa mutant b10, the wild-type parent R7954, or transgenic lines. Reference gene was Actin, and results are presented relative to the expression level in R7954. (B) Level of GBSSI protein (encoded by Wx) in seeds from SSIIIa mutant b10, the wild-type parent R7954, or transgenic lines. Actin is used as a reference protein. Molecular mass markers are shown to the left. (C) Expression levels of genes involved in starch biosynthesis in the b10 mutant. Reference gene was Actin, and results are presented relative to the expression level in R7954, which is set as 1. Each gene name was indicated by a simplified representation. AGPL1, ADP glucose pyrophosphorylase large subunit 1; AGPS1, ADP glucose pyrophosphorylase small subunit 1; DPE1, disproportionating enzyme 1; ISA1, isoamylose 1; PHOH, phosphorylase H; PUL, pullulanase.
Discussion
The high AAC content of starch from plants deficient in SSIIIa could result from increases in amounts of both amylose and extralong chains in amylopectin (26, 31). Furthermore, it is known that high amylose can contribute to RS through the formation of inclusion complexes with lipids (3). The presence of amylose–lipid complex in starch granules restricts their swelling during cooking and thus increases granule resistance of hydrolytic enzymes (25). Consistent with this explanation for increased RS, we observed increased levels of total lipid and amylose–lipid complex in the starch of b10 (Fig. 4 G and E). Furthermore, the chain-length distributions in amylopectin exhibited a small increase in the abundance of branches with degrees of polymerization (DP) in the range 10–20 and a small decrease in chains with DP in the range 35–50 (Fig. S5). These changes to amylopectin might also contribute to the increase in RS in b10, but further analysis is required to investigate this possibility.
Although much more needs to be learned about the mechanisms by which RS is created in the ssIIIa mutant, we now know that it depends on the highly expressed indica Wxa gene and involves accumulation of AAC, lipid, and amylose–lipid complex, which constitutes RS type 5 (RS 5). It is known that the SSIIIa protein is associated with other proteins in developing rice endosperm (32), and in maize a proportion of SSIIIa is also present in a large complex including ADP–glucose pyrophosphorylase (AGPase), pyruvate orthophosphate dikinase (PPDK), SSIIa, and SBEIIa and SBEIIb (33). The enzyme PPDK catalyzes a reversible reaction from pyruvate, ATP, and Pi to phosphoenolpyruvate (PEP), AMP, and PPi (34), but in photosynthesis, it operates in the direction of PEP formation, driven by the hydrolysis of PPi (34). Cereal endosperm contains both cytosolic and plastidial PPDK isoforms. The floury endosperm-4 mutant of rice, which lacks cytosolic OsPPDKB, has smaller kernels and correspondingly less starch, but higher levels of lipid, showing that cytosolic PPDK has a role in the provision of carbon to the plastid, which in turn influences the partitioning of carbon between starch and lipid (35). A key role is also proposed for plastidial PPDK in Zea mays, in which the PPi generated by PPDK can be channeled directly to AGPase within the protein complex, driving the plastidial AGPase reaction in the direction of ADPGlc breakdown to Glc-1-P, which can in turn support amino acid and lipid biosynthesis (33). This close association of PPDK and plastidial AGPase may provide the means to avoid hydrolysis of PPi by a high level of pyrophosphorylase activity in the stroma. It is further proposed that the starch biosynthetic enzymes in the protein complex can exert a constraining effect on PPDK and AGPase to control the partitioning of ADPGlc into lipid or starch. It is known that uptake of ADPGlc by the plastid and the activity of the major SS enzymes do not limit carbon flux into starch, but that other constraints within the stroma control the flux into starch (36).
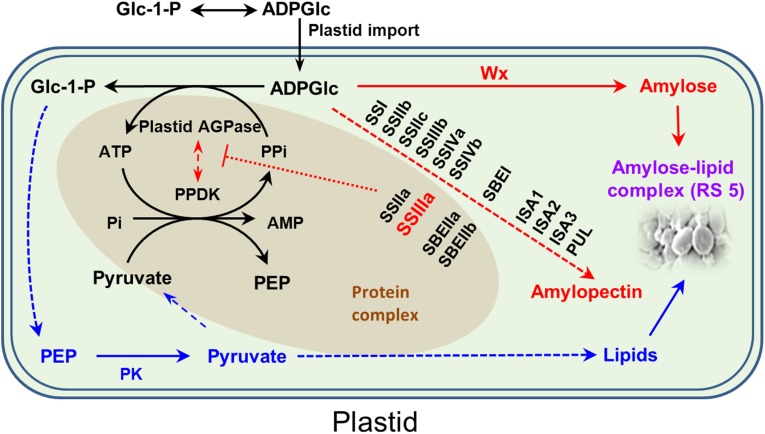
Based on our findings in this work and published results (32–35), we now propose a RS biosynthetic pathway (Fig. 6). We propose that loss of function of SSIIIa will disrupt the protein complex, consisting of PPDK, SSIIIa, AGPase, SSIIa, SBEIIa, and SBEIIb, and that this disruption will reduce the influence on PPDK and AGPase activities so that relatively more ADPGlc is directed toward glycolytic intermediates to support lipid biosynthesis via the action of pyruvate kinase (Fig. 6). Meanwhile, deficiency in SSIIIa will decrease amylopectin biosynthesis and result in a shift in carbon allocation toward amylose biosynthesis by GBSSI encoded by the Wx gene. Consequently, the increased levels of amylose and lipids together give rise to an increase in amylose–lipid complex, constituting RS 5. This proposed RS biosynthetic pathway could also potentially explain the formation of RS in mutants and transgenic plants with impaired expression of SSIIa or SBEII genes (15, 20).
Fig. 6.
A proposed RS biosynthetic pathway in the plastid. Biosynthesis of ADPGlc is brought about primarily by cytosolic AGPase, and ADPGlc is then imported into the plastid for starch biosynthesis. Several amyloplast enzymes exist in a large protein complex, which includes AGPase, PPDK, SSIIa, SSIIIa, SBEIIa, and SBEIIb, and this complex is thought to provide a means to control the partitioning of carbon between starch and lipids. The amyloplast contains a high level of pyrophosphatase, which keeps the concentration of PPi in the stroma very low. The presence of PPDK in a complex with AGPase may enable PPi to be channeled directly to AGPase for the conversion of ADPGlc to G-1-P and subsequently to lipid. The sequestering of PPDK in a protein complex may also prevent a futile cycle operating between PPDK and pyruvate kinase (PK). The starch biosynthetic enzymes in the complex are proposed to inhibit the activity of PPDK and AGPase (red dotted bar). In the absence of a functional SSIIIa protein, the complex is disrupted, and the influence on PPDK and AGPase is reduced, such that more carbon is directed from ADPGlc to Glc-1-P and into lipid. At the same time, the absence of SSIIIa means that relatively more ADPGlc can also be consumed by the Wx protein in the biosynthesis of amylose. This process leads to an increase in amount of amylose–lipid complex and hence RS 5. Dashed arrows indicate multiple steps. AGPase, ADP glucose pyrophosphorylase; ISA, isoamylase; PEP; phosphoenolpyruvate; PUL, pullulanase.
In principle, the same ssIIIa mutation could be used in japonica rice together with introduction of a Wxa gene, but the resulting rice would have higher amylose content than is normally preferred by consumers of japonica varieties. However, in the future, it may be valuable to elevate the lipid content or to pyramid the ssIIIa mutant with selected Wx alleles with intermediate levels of expression to breed new varieties with increased RS, yet with acceptable amylose content. Our discovery provides an immediate and simple way to increase RS in cooked rice, which is a staple food throughout southern Asia.
Materials and Methods
Plant growth, map-based cloning, qRT-PCR, plasmid construction and transformation, X-ray diffraction of starch, and chain-length distribution of amylopectin were carried out as described (37–43). RS, AAC, total starch and lipid contents, pasting properties, and microscopic features of starch granules were measured by using mature seeds. Details of experimental methods are provided in SI Materials and Methods. Primers used in this study are listed in Table S1.
Table S1.
Primers used in this study
| Name | Type | Forward primer (5′–3′) | Reverse primer (5′–3′) |
| M1 | Mapping | AACAAGCTAAGCAAGCAGAA | GATTGCAACCAGTAATCCAT |
| M2 | Mapping | CCAAATCATGTTTCACTCTGT | TAGTTTGATGTGCAGTGTGC |
| M3 | Mapping | AGAGGCCTTTGTAAGGTGAC | TCCACGTATATTTGGAAGAAG |
| M4 | Mapping | ATGGGTGTGTAAGAGCAACT | AGACTCTCCAAGTTTGACCA |
| M5 | Mapping | TATGCACAGCTAACCAACTG | GAATTTTGACCGTGTTTGAT |
| M6 | Mapping | AGAGTAGAAGAAGTCGGAAGAA | TCATTAACATCTATATGAACGTAGG |
| M7 | Mapping | CCAGTGAAGTCAATTGTGG | TCCTCTTCCATACTGCAAAT |
| M8 | Mapping | AGCAACACAAACATCATCAA | ACTGCACAACAGCAACACT |
| M9 | Mapping | TATACATGCTAAATGGCGAA | GAACCTAAGTGACAACTCGC |
| SSIIIa-1 | Sequencing | GAGCAGGCTGAAGGTCGTC | CGTATGAAGGGAAATCGTCC |
| SSIIIa-2 | Sequencing | CAAGTTCAGGTTTGTGTAGGATAGC | GCTTCATCCACCACATCCAC |
| SSIIIa-3 | Sequencing | CTTCAAGCACTGTAATGTATGGG | GACTGGCTTTTCCTATGGACAC |
| SSIIIa-4 | Sequencing | CCAGCGTTTATCAACAAGAAGG | GACTAAACGACCATTGAAGAACAC |
| SSIIIa-5 | Sequencing | TGTCCACATCAAAGGAGCATTC | AGCCAACAAAATACATCAGAACC |
| SSIIIa-6 | Sequencing | ATCAGAGAACGGGAGGAAGC | CTCCAGTTACAGAATTGTCGTAGC |
| SSIIIa-7 | Sequencing | CAAGCACTGTTGAAGTATATGTCTAGC | CTAACTGAGAAAGGAAGGACAACAC |
| SSIIIa-8 | Sequencing | GTTTCTGTGGTGGTTTTGTCG | GCAAAACACATTACATGGATTCTC |
| SSIIIa-9 | Sequencing | CTTTCTTTGTTTCCATGTTTTGC | AAGAGGAGTAAAGTGAATGTAAGGTG |
| SSIIIa-10 | Sequencing | GTTCTTGTTTTCCATGCTTGC | AACCACCTAAAAAGCAAACACATC |
| SSIIIa-11 | Sequencing | ACTTGAACGCAATGGACAGG | GCAGAGGGAGTGGAACCAAC |
| SSIIIa-12 | Sequencing | GCTTGGTGGTCTATTGTTTATGTG | GGCTTTAGGAATCGTGATGG |
| SSIII-2RNAi | RNAi construction | TGCTGTCAGCGAACAAAATC | CTCTTGTGCAGTCTTTCGGTG |
| SSIIIa-OE1 | Overexpression construction | ATGGAGATGGCTCTCCGGCCTCAAA | GCATGAAAATCTTGTCGACCATTGTTGT |
| SSIIIa-OE2 | Overexpression construction | ACAACAATGGTCGACAAGATTTTCATGC | AAACCTAGGCTAAATCAAGTATTCATAATTAAAACTG |
| gSSIIIa-1 | Complementation construction | CGCATGCTTCACCGCCGCTCGTCT | GCTTCCTCCCGTTCTCTGATCTCGTGGA |
| gSSIIIa-2 | Complementation construction | CTGGGTTTTTGCTGACGGGCCACCT | TCACGGCTCAGATCGACGAGTAGACCCA |
| SSIIIa-Pro | Complementation construction | CGCATGCTTCACCGCCGCTCGTCT | TGGCACTGCTAGCTGGCCGGATGACGA |
| rSSIIIa-1 | Sequencing for cDNA | ACACTTAGTGGGGATAAACTTTATAGA | ACTTTCAGACGATCTCATAGACTTGCCA |
| rSSIIIa-2 | Sequencing for cDNA | ACTGGAGCTGCCCATAATGGTTTACCA | ATTGAGAATTCGTAGGCACGCCCAG |
| rSSIIIa-3 | Sequencing for cDNA | ACTAGAGATTATGTAAGCTAACCACGCT | TTAGTGGAGTTTTGCACTGTCCTGACA |
| rSSIIIa-4 | Sequencing for cDNA | ACAGTATGCCACTTACATATTCCTTGTGT | AGGCTTCACTTCAAAACTGAACAG |
| SSIIIa-CAPS | Genotyping | TTGGAACTTTGGTTGGTATATCG | CTTACCTTTGCAATGGGTGC |
| Wx MII | Genotyping | GACAAGGCAAGAATGAGTGACA | GTGCCGACGACCTTGATGG |
| SSIIIa-DJ 1F | Genotyping | CAATTTGGCATGTCTTGTGG | |
| SSIIIa-DJ 1R | Genotyping | TGAGGTGGATACCCTTCTGG | |
| SSIIIa-DJ 2F | Genotyping | ACCCGGGACTGCATATAACCTGC | |
| SSIIIa-DJ 2R | Genotyping | ACCCTTCTGGGCTGTCAGACG | |
| SSIIIa-ZH11 3F | Genotyping | AAGCAATGACATACTGCGACAA | |
| SSIIIa-ZH11 3R | Genotyping | ACCGCAAGGTTCAAAGATGG | |
| SSIIIa-ZH11 4F | Genotyping | AATCCAGATCCCCCGAATTA | |
| Actin | Real-time PCR | CTTCATAGGAATGGAAGCTGCGGGTA | CGACCACCTTGATCTTCATGCTGCTA |
| SSIIIa | Real-time PCR | GAGGAAGTGGATGTGGTAGATGAA | TCTGTTTCGGTGATTGAAGCATTT |
| Wx | Real-time PCR | GGACCTGACACTGGAGTTG | TTTGAAGTATGGGTTGTTGTTGAG |
| PHOH | Real-time PCR | CACCAAGACGAAGCTCATCAAG | TTCACTCGTTGCTGGGTTCTC |
| PHOL | Real-time PCR | TTGGCAGGAAGGTTTCGCT | CGAAGCCTGAAGTGAACTTGCT |
| DPE1 | Real-time PCR | GGCGGTGGTTCTGACAATC | GTCTGCTTCTCTTCCTCTGGTA |
| DPE2 | Real-time PCR | CATTGGATTCGCTGTTGGA | GATACCCTTCGGCTGTTCT |
| AGPL1 | Real-time PCR | GTTGATTCCACATGGCAGAGAA | GTTGCTGCTGCTACTTCACT |
| AGPL2 | Real-time PCR | AGTTCGATTCAAGACGGATAGC | CGACTTCCACAGGCAGCTTATT |
| AGPL3 | Real-time PCR | GGAGAACTGCTGGCTGAA | AATACGATGGTGATGCCTGAT |
| AGPL4 | Real-time PCR | TCCCTTCTGGTTTGTTGCATTTG | CCTCAGTTCCTAGCCTCATTCAT |
| AGPS1 | Real-time PCR | GTGCCACTTAAAGGCACCATT | CCCACATTTCAGACACGGTTT |
| AGPS2a | Real-time PCR | ACTCCAAGAGCTCGCAGACC | GCCTGTAGTTGGCACCCAGA |
| AGPS2b | Real-time PCR | AACAATCGAAGCGCGAGAAA | GCCTGTAGTTGGCACCCAGA |
| GBSSII | Real-time PCR | GCTTGCTGGCTTGTTTAG | TGAAGTAGACGAGAGAAATGG |
| SSI | Real-time PCR | GTGAGCAGGAGTCTGAGAT | TGACCACGAAGAGCAAGA |
| SSIIa | Real-time PCR | CCTATTCCTGCGGTAGAAGA | CCGAATCGTCATCCTGGT |
| SSIIb | Real-time PCR | GTAGGAGCAACGGTGGAAGTG | GGTAATTCAGCGTGAACGTGAGT |
| SSIIIb | Real-time PCR | ATTCCGCTCGCAAGAACTGA | CAACCGCAGGATAACGGAAA |
| SSIIc | Real-time PCR | ACGGTTGTTCAGTCATTCAT | GTCCGCTGCTGTATTCAC |
| SSIVa | Real-time PCR | ATGCAGGAAGCCGAGATGTT | ACGACAATGGGTGCCAAGAT |
| SSIVb | Real-time PCR | GGGAGCGGCTCAAACATAAA | CCGTGCACTGACTGCAAAAT |
| SBEI | Real-time PCR | CCTGCTTCACCTACCATCAA | CGACAAGGCTCCACTGAC |
| SBEIIb | Real-time PCR | CGGTTTCAGCAGGTTCAGA | CTCCAGATGACTCAATCTCAACTT |
| SBEIIa | Real-time PCR | GGAGTTGGTGGTAATGAC | CCCTGGTCTATTTCCTTCA |
| ISA1 | Real-time PCR | TGCTCAGCTACTCCTCCATCATC | AGGACCGCACAACTTCAACATA |
| ISA2 | Real-time PCR | TAGAGGTCCTCTTGGAGG | AATCAGCTTCTGAGTCACCG |
| ISA3 | Real-time PCR | ACAGCTTGAGACACTGGGTTGAG | GCATCAAGAGGACAACCATCTG |
| PUL | Real-time PCR | ACCTTTCTTCCATGCTGG | CAAAGGTCTGAAAGATGGG |
AGPL1, ADP glucose pyrophosphorylase large subunit 1; AGPS1, ADP glucose pyrophosphorylase small subunit 1; DPE1, disproportionating enzyme 1; ISA1, isoamylose 1; PHOH, phosphorylase H; PUL, pullulanase.
SI Materials and Methods
Plant Materials.
A rice mutant, b10 (O. sativa L. ssp. indica), high in RS, was isolated after 60-Cobalt gamma-ray mutagenesis of R7954, a commercial hybrid rice restorer (41). Two F2 segregating populations were generated by crossing b10 to ZH11 (O. sativa L. ssp. japonica). Seeds of SSIIIa-ZH11 and -DJ lines carrying a T-DNA insertion in the SSIIIa gene in the ZH11 or DJ background were obtained from the National Center of Plant Gene Research (Wuhan), Huazhong Agricultural University, China (42), and Crop Biotech Institute, Kyung Hee University, Korea (43), respectively. The rice plants were grown under field conditions at the Experimental Station of the Institute of Genetics and Developmental Biology, Chinese Academy of Sciences in Beijing and Hainan, China.
Sample Preparation.
Harvested rice grains were air-dried before analysis. Fully matured grains were used for measurements of RS and grain quality traits. Rice was dehulled by using a Xinen Dehuller (Taizhou Xinen Corporation). The resulting brown rice was then polished in a KettPolisher (Kett Electric Laboratory) and subsequently ground to flour in a Retsch Mill with a 1.0-mm sieve for measuring RS content and pasting properties. Samples for total starch and lipid content measurements were ground with a 0.5- and 0.2-mm mesh, respectively. Alternatively, the milled grains were finely ground with a 0.2-mm mesh and passed through a 150-μm sieve for apparent amylose content (AAC) analysis.
Physicochemical Properties and RS Analysis.
Milled samples (100 mg per sample) were cooked according to the traditional domestic method, with a ratio of water to rice of 1:1.8 (wt/wt). When cooled to room temperature, the hot-cooked rice was used for RS measurement by using an RS measurement kit (Megazyme International Ireland Ltd.), according to the manufacture’s assay procedure.
Total starch content was analyzed by using a Total Starch measurement kit (Megazyme International Ireland Ltd.). AAC was evaluated following the method of ISO 6647 (International Organization for Standardization), including standard samples of four levels (1.5%, 10.4%, 16.2%, and 26.5%) provided by the China National Rice Research Institute. Total lipid content was measured by Rice Product Quality Inspection and Supervision Testing Center, the Ministry of Agriculture of China.
Starch Pasting Properties.
Four grams of dry rice flour dispersed in 25 mL of distilled water was characterized by using Rapid Visco Analyzer (RVA) (Newport Scientific). The suspension was first retained at 50 °C for 1 min, then heated to 95 °C over a 3-min period and held at 95 °C for 10 min, then cooled to 50 °C over 4 min, and subsequently cooled to 30 °C during a 2-min period. The mixture was stirred at 160 rpm, and viscosity values were expressed as RVA units. PV and PT were determined.
X-Ray Diffraction of Starch.
X-ray diffraction patterns of starch were measured with a Panalytical X'Pert Pro Diffractometer (PANalytical) equipped with Cu-Ka (1.54 Å) radiation. The accelerating voltage and current of 30 kV and 30 mA, respectively, in combination with a scan rate of 1° per min were used. The diffractograms were recorded in a 2θ ranged from 3° to 40°, with a 0.02° sampling width (40).
Chain-Length Distribution of Amylopectin.
Amylopectin was isolated and purified from starch granules by using 1-butanol and was then debranched with amylases as described by Kong et al. (39). High-performance anion-exchange chromatography was used to analyze the chain length distribution of debranched materials as described (39).
Plasmid Construction and Transformation.
A 15,574-bp DNA fragment extending from 1,974 bp upstream of the SSIIIa transcription start to 803-bp downstream of its stop codon was amplified from genomic DNA isolated form Nipponbare rice by using primers (Table S1) digested with KpnI and SbfI and cloned into the binary vector pCAMBIA1300 to generate the complementation construct (SSIIIa:gSSIIIa). The full-length SSIIIa coding sequence was amplified from RNA isolated from R7954 seeds harvested 15 d after fertilization (DAF) and inserted into the plant binary vector pCAMBIA1301 under the control of the ubiquitin promoter (Ubi:cSSIIIa). To prepare the SSIIIa RNAi vector, a 512-bp cDNA fragment was amplified from Nipponbare genomic DNA, double digested with BamHI–KpnI and SpeI–SacI, and fragments were inserted on both sides of the intron in the binary vector pTCK303 in opposite orientations. All transgenic plants were generated by Agrobacterium-mediated transformation. Relevant primer sequences are indicated in Table S1.
Antibody Preparation.
For detection of SSIIIa, a His-fused polypeptide (amino acid residues 432–672 of SSIIIa) was expressed in Rosetta 2 (DE3) cells (Transgene Biotech Company) and then affinity-purified (GE Healthcare). The purified proteins were used to raise polyclonal antibodies in rabbits and the anti-SSIIIa serum was affinity purified before use. Antibody diluted 1:20,000 was used for protein blotting. The loading control used was antiactin (code: M20009, purchased from Abmart).
Extraction of Total Proteins from Endosperm.
Spikelets were marked on the day of flowering and harvested at 15 DAF. All seed samples were immediately frozen in liquid nitrogen and stored at −80 °C until use. Total proteins from endosperm were extracted following methods as described (30).
SEM.
For observation of endosperm cross-section, rice seeds were fractured across the short axis and dried completely under low pressure. The surface was sputter-coated with gold and observed by SEM (26).
Real-Time qRT-PCR Analysis.
Spikelets were marked on the day of flowering and harvested at 15 DAF. All seed samples were immediately frozen in liquid nitrogen and stored at −80 °C until use. Total RNAs from dehulled seeds were extracted by using the EASYspin Plus Plant RNA Kit (Aidlab) following the manufacturer’s protocol. The extracts were treated with DNase I (Ambion), and 2 μg of seed total RNA were used for cDNA synthesis with the SuperScript III (Invitrogen). qPCR experiments were conducted with gene-specific primers (Table S1) in the reaction system of SsoFast EvaGreen Supermix (Bio-Rad) on the CFX96 Real-Time system (Bio-Rad) according to the manufacturer’s instructions. The rice Actin gene (LOC_Os03g50885) was used as internal reference.
Acknowledgments
We thank Gynheung An (Kyung Hee University) and Changyin Wu (Huazhong Agricultural University) for providing T-DNA insertion mutants and Yanbao Tian (Institute of Genetics and Developmental Biology, Chinese Academy of Sciences) for technical assistance. This work was supported by Ministry of Science and Technology Grants 2013CBA014, 2014AA10A6, and 2014ZX08001; Chinese Academy of Sciences Grant XDA08030101; and State Key Laboratory of Plant Genomics Grants 2014B0227-01 and 2015B0129-01. S.M.S. was supported by the High-End Program of Foreign Experts and Chinese Academy of Sciences Senior International Scientist Visiting Professorship 2013T1S0013.
Footnotes
The authors declare no conflict of interest.
See Commentary on page 12616.
This article contains supporting information online at www.pnas.org/lookup/suppl/doi:10.1073/pnas.1615104113/-/DCSupplemental.
References
- 1.Zimmet P, Alberti KG, Shaw J. Global and societal implications of the diabetes epidemic. Nature. 2001;414(6865):782–787. doi: 10.1038/414782a. [DOI] [PubMed] [Google Scholar]
- 2.Chen L, Magliano DJ, Zimmet PZ. The worldwide epidemiology of type 2 diabetes mellitus—present and future perspectives. Nat Rev Endocrinol. 2011;8(4):228–236. doi: 10.1038/nrendo.2011.183. [DOI] [PubMed] [Google Scholar]
- 3.Raigond P, Ezekiel R, Raigond B. Resistant starch in food: A review. J Sci Food Agric. 2015;95(10):1968–1978. doi: 10.1002/jsfa.6966. [DOI] [PubMed] [Google Scholar]
- 4.Qian Q, Guo L, Smith SM, Li J. Breeding high-yield superior quality hybrid super rice by rational design. Natl Sci Rev. 2016 doi: 10.1093/nsr/nww006. [DOI] [Google Scholar]
- 5.Yamada Y, et al. Effect of bread containing resistant starch on postprandial blood glucose levels in humans. Biosci Biotechnol Biochem. 2005;69(3):559–566. doi: 10.1271/bbb.69.559. [DOI] [PubMed] [Google Scholar]
- 6.Baghurst PA, Baghurst KI, Record SJ. Dietary fibre, non-starch polysaccharides and resistant starch: A review. Food Aust. 1996;48(suppl):s3–s35. [Google Scholar]
- 7.Yang CZ, et al. Starch properties of mutant rice high in resistant starch. J Agric Food Chem. 2006;54(2):523–528. doi: 10.1021/jf0524123. [DOI] [PubMed] [Google Scholar]
- 8.Yang R, et al. A putative gene sbe3-rs for resistant starch mutated from SBE3 for starch branching enzyme in rice (Oryza sativa L.) PLoS One. 2012;7(8):e43026. doi: 10.1371/journal.pone.0043026. [DOI] [PMC free article] [PubMed] [Google Scholar]
- 9.Zeng YW, et al. Identification of QTLs for resistant starch and total alkaloid content in brown and polished rice. Genet Mol Res. 2016;15(3):gmr.15037268. doi: 10.4238/gmr.15037268. [DOI] [PubMed] [Google Scholar]
- 10.Lee KW, et al. The effects of Goami No. 2 rice, a natural fiber-rich rice, on body weight and lipid metabolism. Obesity (Silver Spring) 2006;14(3):423–430. doi: 10.1038/oby.2006.56. [DOI] [PubMed] [Google Scholar]
- 11.Wei C, et al. Microstructure and ultrastructure of high-amylose rice resistant starch granules modified by antisense RNA inhibition of starch branching enzyme. J Agric Food Chem. 2010;58(2):1224–1232. doi: 10.1021/jf9031316. [DOI] [PubMed] [Google Scholar]
- 12.Bird AR, Flory C, Davies DA, Usher S, Topping DL. A novel barley cultivar (Himalaya 292) with a specific gene mutation in starch synthase IIa raises large bowel starch and short-chain fatty acids in rats. J Nutr. 2004;134(4):831–835. doi: 10.1093/jn/134.4.831. [DOI] [PubMed] [Google Scholar]
- 13.Topping DL, et al. Resistant starch and health—Himalaya 292, a novel barley cultivar to deliver benefits to consumers. Starke. 2003;55(12):539–545. [Google Scholar]
- 14.Regina A, et al. A genetic strategy generating wheat with very high amylose content. Plant Biotechnol J. 2015;13(9):1276–1286. doi: 10.1111/pbi.12345. [DOI] [PubMed] [Google Scholar]
- 15.Regina A, et al. High-amylose wheat generated by RNA interference improves indices of large-bowel health in rats. Proc Natl Acad Sci USA. 2006;103(10):3546–3551. doi: 10.1073/pnas.0510737103. [DOI] [PMC free article] [PubMed] [Google Scholar]
- 16.Sestili F, et al. TILLING mutants of durum wheat result in a high amylose phenotype and provide information on alternative splicing mechanisms. Plant Sci. 2015;233:127–133. doi: 10.1016/j.plantsci.2015.01.009. [DOI] [PubMed] [Google Scholar]
- 17.Slade AJ, et al. Development of high amylose wheat through TILLING. BMC Plant Biol. 2012;12:69. doi: 10.1186/1471-2229-12-69. [DOI] [PMC free article] [PubMed] [Google Scholar]
- 18.Hazard B, et al. Induced mutations in the starch branching enzyme II (SBEII) genes increase amylose and resistant starch content in durum wheat. Crop Sci. 2012;52(4):1754–1766. doi: 10.2135/cropsci2012.02.0126. [DOI] [PMC free article] [PubMed] [Google Scholar]
- 19.Hazard B, Zhang X, Naemeh M, Dubcovsky J. Registration of durum wheat germplasm lines with combined mutations in SBEIIa and SBEIIb genes conferring Increased amylose and resistant starch. J Plant Regist. 2014;8(3):334–338. doi: 10.3198/jpr2014.02.0007crg. [DOI] [PMC free article] [PubMed] [Google Scholar]
- 20.Yamamori M, Kato M, Yui M, Kawasaki M. Resistant starch and starch pasting properties of a starch synthase IIa-deficient wheat with apparent high amylose. Aust J Agric Res. 2006;57(5):531–535. [Google Scholar]
- 21.Ryoo N, et al. Knockout of a starch synthase gene OsSSIIIa/Flo5 causes white-core floury endosperm in rice (Oryza sativa L.) Plant Cell Rep. 2007;26(7):1083–1095. doi: 10.1007/s00299-007-0309-8. [DOI] [PubMed] [Google Scholar]
- 22.Tian Z, et al. Allelic diversities in rice starch biosynthesis lead to a diverse array of rice eating and cooking qualities. Proc Natl Acad Sci USA. 2009;106(51):21760–21765. doi: 10.1073/pnas.0912396106. [DOI] [PMC free article] [PubMed] [Google Scholar]
- 23.Gao Z, et al. ALK, the key gene for gelatinization temperature, is a modifier gene for gel consistency in rice. J Integr Plant Biol. 2011;53(9):756–765. doi: 10.1111/j.1744-7909.2011.01065.x. [DOI] [PubMed] [Google Scholar]
- 24.Zhang G, et al. Double repression of soluble starch synthase genes SSIIa and SSIIIa in rice (Oryza sativa L.) uncovers interactive effects on the physicochemical properties of starch. Genome. 2011;54(6):448–459. doi: 10.1139/g11-010. [DOI] [PubMed] [Google Scholar]
- 25.Hasjim J, Ai Y, Jane J. Novel applications of amylose-lipid complex as resistant starch type 5. In: Shi Y, Maningat CC, editors. Resistant Starch Sources: Applications and Health Benefits. John Wiley & Sons; Hoboken, NJ: 2013. pp. 79–94. [Google Scholar]
- 26.Fujita N, et al. Characterization of SSIIIa-deficient mutants of rice: The function of SSIIIa and pleiotropic effects by SSIIIa deficiency in the rice endosperm. Plant Physiol. 2007;144(4):2009–2023. doi: 10.1104/pp.107.102533. [DOI] [PMC free article] [PubMed] [Google Scholar]
- 27.Sano Y. Differential regulation of waxy gene expression in rice endosperm. Theor Appl Genet. 1984;68(5):467–473. doi: 10.1007/BF00254822. [DOI] [PubMed] [Google Scholar]
- 28.Wang ZY, et al. The amylose content in rice endosperm is related to the post-transcriptional regulation of the waxy gene. Plant J. 1995;7(4):613–622. doi: 10.1046/j.1365-313x.1995.7040613.x. [DOI] [PubMed] [Google Scholar]
- 29.Okagaki RJ. Nucleotide sequence of a long cDNA from the rice waxy gene. Plant Mol Biol. 1992;19(3):513–516. doi: 10.1007/BF00023402. [DOI] [PubMed] [Google Scholar]
- 30.Crofts N, et al. Lack of starch synthase IIIa and high expression of granule-bound starch synthase I synergistically increase the apparent amylose content in rice endosperm. Plant Sci. 2012;193-194:62–69. doi: 10.1016/j.plantsci.2012.05.006. [DOI] [PubMed] [Google Scholar]
- 31.Hanashiro I, et al. Granule-bound starch synthase I is responsible for biosynthesis of extra-long unit chains of amylopectin in rice. Plant Cell Physiol. 2008;49(6):925–933. doi: 10.1093/pcp/pcn066. [DOI] [PubMed] [Google Scholar]
- 32.Crofts N, et al. Amylopectin biosynthetic enzymes from developing rice seed form enzymatically active protein complexes. J Exp Bot. 2015;66(15):4469–4482. doi: 10.1093/jxb/erv212. [DOI] [PMC free article] [PubMed] [Google Scholar]
- 33.Hennen-Bierwagen TA, et al. Proteins from multiple metabolic pathways associate with starch biosynthetic enzymes in high molecular weight complexes: A model for regulation of carbon allocation in maize amyloplasts. Plant Physiol. 2009;149(3):1541–1559. doi: 10.1104/pp.109.135293. [DOI] [PMC free article] [PubMed] [Google Scholar]
- 34.Chastain CJ, et al. Functional evolution of C(4) pyruvate, orthophosphate dikinase. J Exp Bot. 2011;62(9):3083–3091. doi: 10.1093/jxb/err058. [DOI] [PubMed] [Google Scholar]
- 35.Kang HG, Park S, Matsuoka M, An G. White-core endosperm floury endosperm-4 in rice is generated by knockout mutations in the C-type pyruvate orthophosphate dikinase gene (OsPPDKB) Plant J. 2005;42(6):901–911. doi: 10.1111/j.1365-313X.2005.02423.x. [DOI] [PubMed] [Google Scholar]
- 36.Cakir B, et al. Analysis of the rice ADP-glucose transporter (OsBT1) indicates the presence of regulatory processes in the amyloplast stroma that control ADP-glucose flux into starch. Plant Physiol. 2016;170(3):1271–1283. doi: 10.1104/pp.15.01911. [DOI] [PMC free article] [PubMed] [Google Scholar]
- 37.Xu C, et al. Degradation of MONOCULM 1 by APC/C(TAD1) regulates rice tillering. Nat Commun. 2012;3:750. doi: 10.1038/ncomms1743. [DOI] [PMC free article] [PubMed] [Google Scholar]
- 38.Jiang L, et al. DWARF 53 acts as a repressor of strigolactone signalling in rice. Nature. 2013;504(7480):401–405. doi: 10.1038/nature12870. [DOI] [PMC free article] [PubMed] [Google Scholar]
- 39.Kong X, Bertoft E, Bao J, Corke H. Molecular structure of amylopectin from amaranth starch and its effect on physicochemical properties. Int J Biol Macromol. 2008;43(4):377–382. doi: 10.1016/j.ijbiomac.2008.07.018. [DOI] [PubMed] [Google Scholar]
- 40.Kong X, Zhu P, Sui Z, Bao J. Physicochemical properties of starches from diverse rice cultivars varying in apparent amylose content and gelatinisation temperature combinations. Food Chem. 2015;172:433–440. doi: 10.1016/j.foodchem.2014.09.085. [DOI] [PubMed] [Google Scholar]
- 41.Shu X, Jia L, Ye H, Li C, Wu D. Slow digestion properties of rice different in resistant starch. J Agric Food Chem. 2009;57(16):7552–7559. doi: 10.1021/jf900988h. [DOI] [PubMed] [Google Scholar]
- 42.Wu C, et al. Development of enhancer trap lines for functional analysis of the rice genome. Plant J. 2003;35(3):418–427. doi: 10.1046/j.1365-313x.2003.01808.x. [DOI] [PubMed] [Google Scholar]
- 43.Jeon J-S, et al. T-DNA insertional mutagenesis for functional genomics in rice. Plant J. 2000;22(6):561–570. doi: 10.1046/j.1365-313x.2000.00767.x. [DOI] [PubMed] [Google Scholar]


