Significance
Transcription is the first step toward protein production. During transcription, a polymerase enzyme moves along DNA and copies it to RNA. In the cell, DNA is highly compacted: roughly 150 bp of DNA is wrapped around histone proteins to form a nucleosome. However, little is known about how closely spaced nucleosomes impact polymerase transcription. We performed single-molecule optical tweezers transcription experiments on dinucleosomal DNA templates. We show that the effect of the second nucleosome on polymerase transcription efficiency through the first one depends on the internucleosomal spacing and the rotational arrangement of the nucleosomes on the helical DNA template. Our findings provide insights into how DNA compaction affects transcription in vitro.
Keywords: Pol II, transcription, single-molecule, optical tweezers, internucleosomal distance
Abstract
In eukaryotes, gene expression depends on chromatin organization. However, how chromatin affects the transcription dynamics of individual RNA polymerases has remained elusive. Here, we use dual trap optical tweezers to study single yeast RNA polymerase II (Pol II) molecules transcribing along a DNA template with two nucleosomes. The slowdown and the changes in pausing behavior within the nucleosomal region allow us to determine a drift coefficient, χ, which characterizes the ability of the enzyme to recover from a nucleosomal backtrack. Notably, χ can be used to predict the probability to pass the first nucleosome. Importantly, the presence of a second nucleosome changes χ in a manner that depends on the spacing between the two nucleosomes, as well as on their rotational arrangement on the helical DNA molecule. Our results indicate that the ability of Pol II to pass the first nucleosome is increased when the next nucleosome is turned away from the first one to face the opposite side of the DNA template. These findings help to rationalize how chromatin arrangement affects Pol II transcription dynamics.
To accommodate the massive amount of genetic material within the nucleus, DNA is packaged into chromatin. The level of chromatin compaction determines the accessibility of the underlying DNA, which in turn impacts gene expression (1). The first step in gene expression is transcription, where RNA polymerase II (Pol II) processively moves along the DNA template to generate an RNA copy. However, how chromatin impacts the translocation dynamics of individual RNA polymerases has remained unclear.
The fundamental unit of chromatin is a single nucleosome, which consists of 147 bp of DNA wrapped 1.7 times around a histone octamer (2). In vitro experiments have revealed that a single nucleosome exhibits a significant mechanical barrier to the transcribing Pol II (3–7). Using optical tweezers, it was shown that a nucleosome both decreases the rate of forward translocation and increases polymerase pausing and backtracking (3, 5). These changes have been suggested to depend on the unwrapping dynamics of the nucleosome itself, which are governed by nucleosomal properties such as the histones’ modification state as well as the underlying DNA sequence (3, 5).
In vivo, the process of chromatin transcription is far more complex. Chromatin accessibility is affected by many accessory factors that facilitate the progression of RNA polymerases through nucleosomal obstacles (1). A central outstanding question is to what extent the nucleosomal arrangement affects Pol II transcription behavior. This arrangement might be particularly important in budding yeast, an organism with a compact genome with short internucleosomal distances (8–11).
Here, we study the impact of the arrangement of two nucleosomes on the nucleosomal transcription performance of individual molecules of Pol II. We use dual-trap optical tweezers in a single-molecule approach to follow single enzymes of Pol II as they progress through a dinucleosomal array (3, 5). Specifically we investigate how Pol II passage through the first nucleosome depends on the length of the linker DNA between the two nucleosomes.
Results
Single-Molecule Transcription Through a Single Nucleosome.
We first sought to recapitulate single-molecule results obtained from Pol II transcription experiments along mononucleosomal templates (3, 5). We expressed and purified the four canonical yeast histones from Escherichia coli without posttranslational modifications. After refolding the histone octamers, we assembled the yeast nucleosomes on the artificial Widom601 nucleosome positioning sequence (NPS) (12), which exhibits a high affinity for the histone octamer. Protocols were adapted from refs. 13 and 14 (SI Text). The use of the strong nucleosome positioning sequence, the Widom601, ensures exact positioning of the nucleosomes, which is crucial for our experiments as we analyze changes in transcription dynamics within this well-defined region. We determined the quality of all nucleosomal reconstitutions by both a gel-based assay (SI Text and Fig. S1A) and force–extension measurements (SI Text and Fig. S1B). Pol II was purified from yeast as described in ref. 15. We assembled transcription elongation complexes as described in refs. 15 and 16 and subsequently ligated them in a single ligation reaction to both the naked upstream DNA and the downstream DNA template with already assembled nucleosome(s) (SI Text and Fig. S2 shows all nucleosomal templates used in this study). In the dual-trap optical tweezers, we formed a tether between two polystyrene beads: one attached to the polymerase and the other to the upstream DNA (SI Text and Fig. 1A). On buffer exchange and addition of ribonucleotide triphosphates (NTP), Pol II began to translocate along the DNA toward the nucleosome (SI Text and Fig. 1A). Note that the nucleosome was not under tension from the optical traps, because it is positioned downstream (Fig. 1A). Experiments were done under assisting force (typically 9 1 pN when encountering the nucleosome; SI Text). Experiments were performed in the presence of 60 mM (NH4)2 SO4, which corresponds to an ionic strength of 120 mM. The region of nucleosomal influence (200 bp) was defined according to Bintu et al. (3) (Fig. 1B).
Fig. S1.
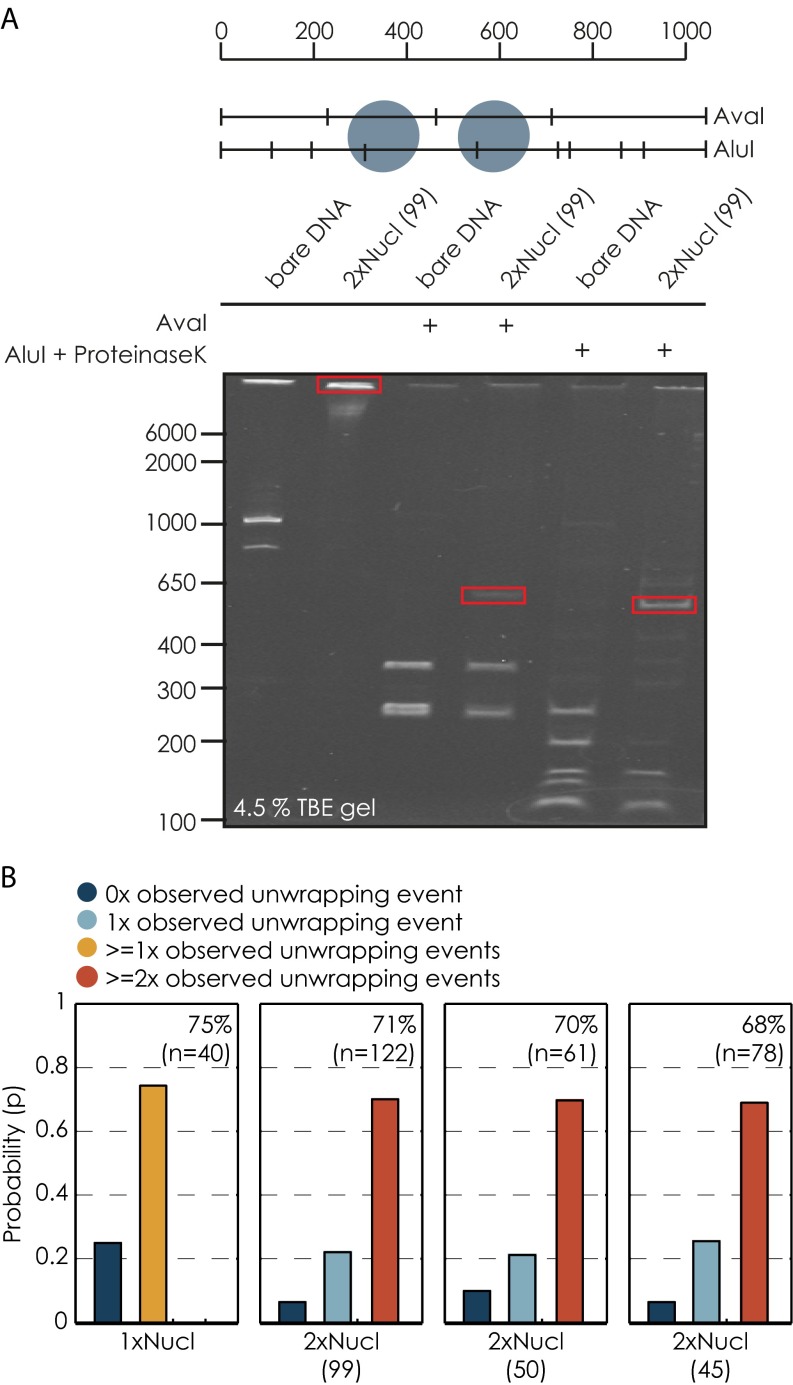
Reconstitution efficiency of nucleosomal templates. (A) Analytical restriction digests with AvaI and AluI of the 99-bp linker DNA template. The drawing on top illustrates the cutting patterns for the 99-bp linker template for the respective enzymes. Changes in band pattern resulting from the presence of a nucleosome are highlighted in red. (B) Reconstitution efficiencies determined from force-extension measurements, the percentage of the number of nucleosomes found on each template. Note that in this representation one + more nucleosomal unwrapping events are binned together for the single nucleosomal condition and two + more nucleosomal unwrapping events are binned together for all dinucleosomal conditions.
Fig. S2.
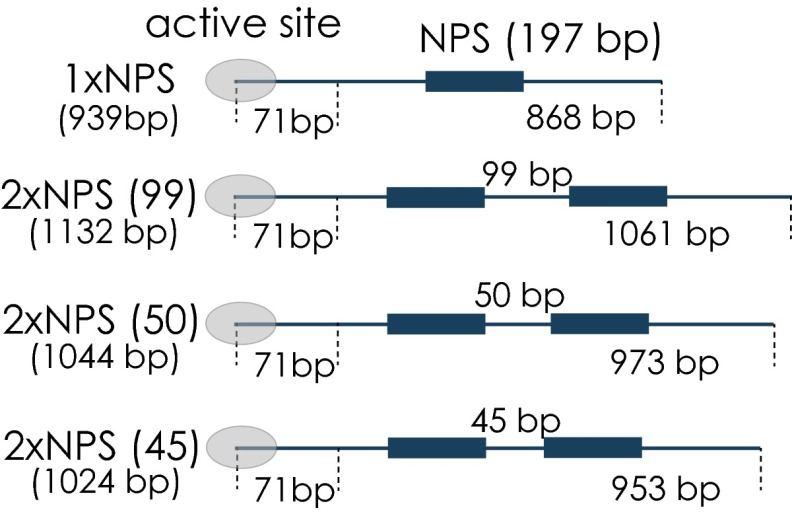
Different downstream DNA templates used in this study. Illustration of different downstream templates (DNA to transcribe by Pol II in bp). The different nucleosomal templates differ in the distances between the two nucleosomes (also see SI Text).
Fig. 1.
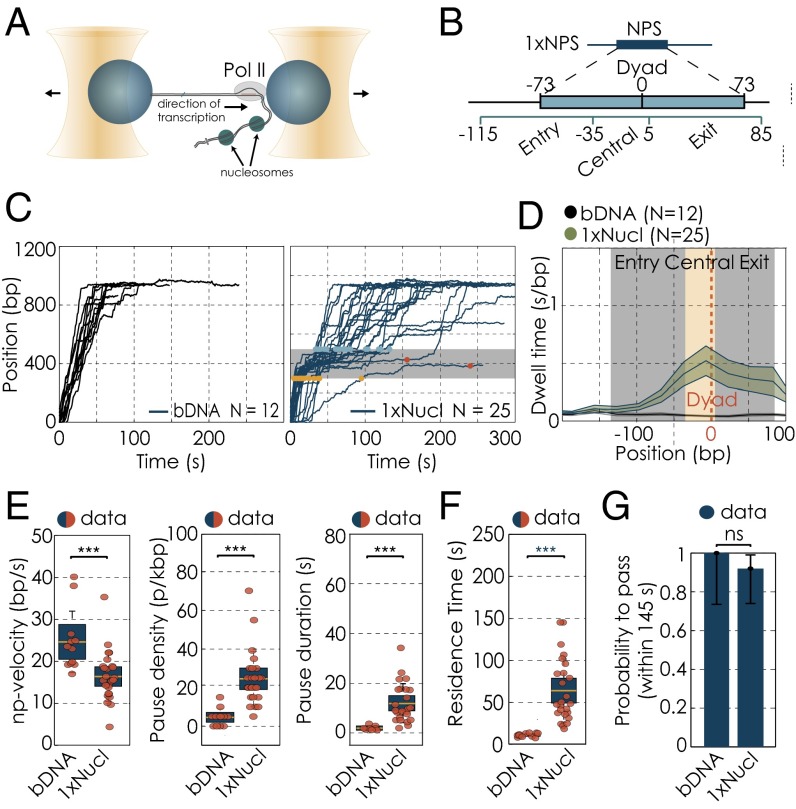
Single-molecule transcription elongation by RNA polymerases II through single nucleosome. (A) Dual-trap optical tweezers, assisting force arrangement. (B) Region of nucleosomal influence according to Bintu et al. (3). (C) Transcription traces of individual Pol II molecules, transcribing along a single nucleosomal templates where no nucleosome has been present, bare DNA (bDNA; Left) or a nucleosome was present (1xNucl; Right) (data filtered at 1-kHz bandwidth). The gray bar illustrates the position of the nucleosome. Yellow and blue dots highlight the position at which polymerases enter and exit the nucleosome, respectively. For polymerases that did not transcribe through the nucleosomal region within 145 s, red dots mark their position at 145 s after entering the nucleosomal region. (D) Changes in dwell time distributions along mononucleosomal DNA template, zoomed into the nucleosomal region. The gray bar illustrates the position of the nucleosome; the yellow area marks the central region. Dwell time distributions for the mononucleosomal DNA template in the absence of a nucleosome (black) and in the presence of a nucleosome (green). The solid line represents the mean, whereas the shaded areas show the respective SEM. (E) Changes in transcription parameters on mononucleosomal DNA template with and without a nucleosome: changes in pause-free velocities (Left). Pause densities (Center) and pause durations (Right). Quantifications for each transcription parameters are shown as box plots, where the central mark is the mean, the edges of the box are the SEM and the whiskers are the SDs. The red dots represent values for single experiments. (F) Residence times for transcription on mononucleosomal DNA template. (G) Quantification of the passage probabilities through the single nucleosomal region. The passage probability refers to the capacity of a polymerase to pass the nucleosomal region within the cutoff time of 145 s. The error bars represent 95% CI. Experimental data are shown in blue; theory is shown in green. We used the Barnard’s exact test to calculate the P values for binary data sets. N indicates the number of Pol II transcription trajectories on each template. Two datasets are considered significantly different if the P value is below or equal to 0.05. Different P values are indicated as follows: ns, P > 0.05; ***P ≤ 0.001.
In agreement with previous work (3, 5), we found that the transcription behavior of Pol II changes significantly in the presence of a nucleosome (Fig. 1C). Dwell times (the average time the polymerase resides at a base pair) were increased at the nucleosome, in particular within its central part. This part of the nucleosomal DNA corresponds to the dyad region, which is known to be difficult to pass for a polymerase (3, 5) (Fig. 1D). This increase in dwell times comes about because the Pol II elongation rate decreases, whereas pause frequency and pause duration increase (Table S1 and Fig. 1E). Furthermore, we find that it takes individual Pol II molecules 63.5 15.5 s (mean SEM unless otherwise noted) to pass a single nucleosome (Table S1). This time, which we refer to as residence time, is approximately five times longer than the average value measured at the same location but without a nucleosome (Fig. 1F). Importantly, detecting this increase in residence time also allows us to test in each experiment for the presence of the first nucleosome (SI Text and Fig. S3A). We operationally define a single Pol II molecule as unable to efficiently pass the nucleosome when it remains for more than 145 s within the nucleosomal region (66.04 + 2 39.68 s, mean + 2 SDs of the nucleosomal residence time of all polymerases that make it through the nucleosomal region; for polymerases that did not pass the first nucleosomal region, only those traces with passage times longer than the cutoff time of 145 s were considered; SI Text and Fig. S3B). With this definition, 8% of all measured Pol II molecules are unable to efficiently pass the single nucleosome (Fig. 1G). To conclude, in agreement with earlier work (3, 5), we find that, although single molecules of Pol II slow down significantly when they encounter a nucleosome, a large majority successfully makes it through.
Table S1.
Transcription parameters for all conditions
| Template | Residence times (s) | Pause-free velocity (bp/s) | Pause density (pauses/kbp) | Pause duration (s) | Passage probability (%) |
| Bare DNA | 10.3 ± 1.4 (10.2) | 24.7 ± 4.1 (23.3) | 4.6 ± 2.8 (5.0) | 2.0 ± 0.7 (1.8) | 100.0 |
| 1×Nucl | 63.5 ± 15.5 (48.0) | 16.5 ± 2.5 (15.6) | 24.6 ± 5.8 (20.0) | 12.0 ± 3.2 (9.1) | 92.0 |
| 2×Nucl (99) | 69.8 ± 16.5 (64.2) | 16.3 ± 1.9 (15.6) | 23.4 ± 5.1 (20.0) | 12.0 ± 3.7 (10.9) | 92.3 |
| 2×Nucl (50) | 118.9 ± 23.0 (145.0) | 12.3 ± 1.8 (11.2) | 38.6 ± 8.3 (41.3) | 37.9 ± 19.2 (23.0) | 27.8 |
| 2×Nucl (45) | 83.3 ± 15.1 (83.9) | 15.6 ± 1.8 (14.6) | 28.4 ± 5.2 (25.0) | 15.9 ± 4.0 (13.9) | 78.9 |
All quantities are reported as mean ± SEM The median is given in parentheses.
Fig. S3.
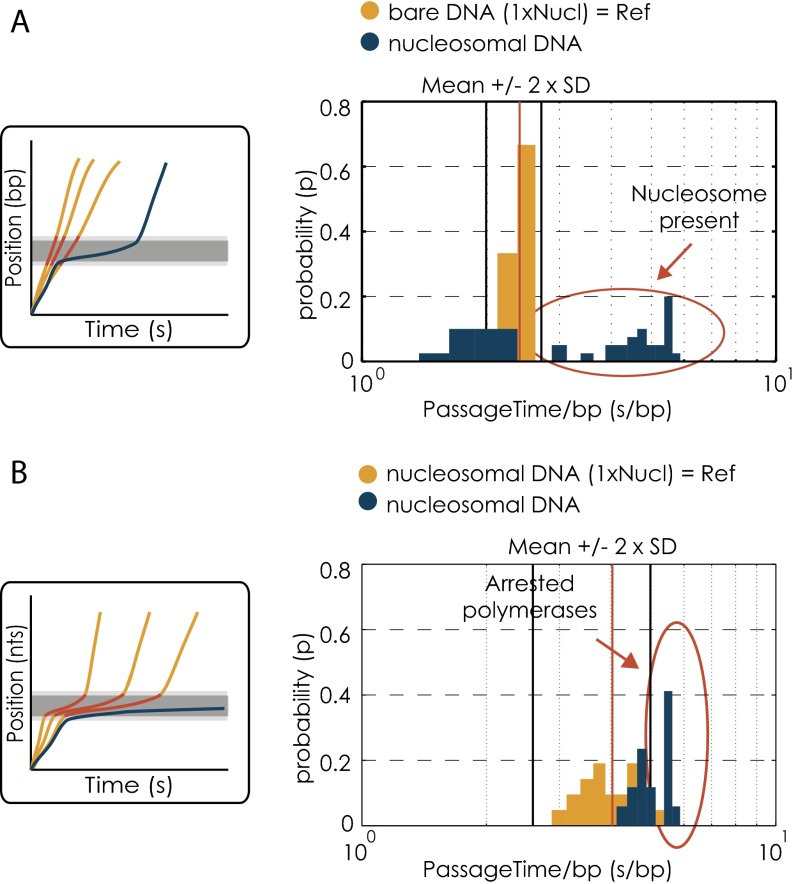
Data quality check for the presence of a nucleosome and sufficient nucleosomal residence time. (A) Quality check for presence of a nucleosome. (Left) Schematic of the data quality check method. The gray bar indicates the position of the nucleosome. The cutoff for determining the presence of a nucleosome was derived from transcription trajectories on bare DNA within the nucleosomal region (red). The blue line corresponds to a trajectory on a single nucleosomal template. (Right) The passage time distribution for the first nucleosome of the dinucleosomal template (50-bp linker) (blue). The yellow bars show the reference distribution of the bare DNA. All passage times longer than the cutoff (mean + 2 × SD = 11.2 + 2 × 1.9 s) are considered to result from the presence of a nucleosome. The x axis is in logarithmic scale. (B) Quality check for long enough residence times within the first nucleosomal region. (Left) Schematic of the data quality check method. The gray bar indicates the position of the nucleosome. The cutoff for selecting for sufficient nucleosomal residence time for all polymerases that did not make it through the nucleosomal region was derived from residence times of transcription trajectories on single nucleosomal templates within the nucleosomal region (red). The blue line represents a trajectory of a polymerase ending within the nucleosomal region. (Right) The passage time distribution for the first nucleosome of the dinucleosomal template (50-bp linker) for all runs that ended in the respective region (blue). The yellow bars show the reference distribution of the single nucleosomal template. All passage times longer than the cutoff (mean + 2 × SD = 66.04 + 2 × 39.68 s) are considered for further analysis. The x axis is in logarithmic scale.
We also observe that most of the Pol II molecules do not return to “normal” transcription behavior after passing the nucleosomal region, but instead appear to pause more frequently than they do on naked DNA (Fig. 1C). This behavior was reported before (at 150 mM salt, comparable to 120 mM used here) (5), but interpreting postpassage pausing is difficult as the measurement of position in the optical tweezers is no longer calibrated (SI Text). It is interesting to speculate that a nucleosome that was passed might remain in contact with Pol II and affect its postpassage pausing behavior. Here, we only analyze changes in transcription dynamics within the nucleosomal region and not beyond.
Although Pol II molecules reduced their elongation rate within the nucleosomal region, we speculated that it was their inability to recover from long pauses which rendered them unable to pass the barrier (within 145 s). Specifically, we speculated that the decreased elongation rate at the nucleosome and the decreased passage probability are quantitatively related. In particular, we wondered if it is possible to predict Pol II nucleosomal passage probabilities from the measured reduction in elongation rate and the increase in the number of pauses within the nucleosomal region, compared with transcription on naked DNA. For this, we extend a stochastic description of transcription dynamics (5), combining the idea that the nucleosome acts as a fluctuating barrier (5) with the biased diffusion model for backtracking (17) to investigate Pol II transcription dynamics on different nucleosomal templates.
A Stochastic Model of Transcription Elongation.
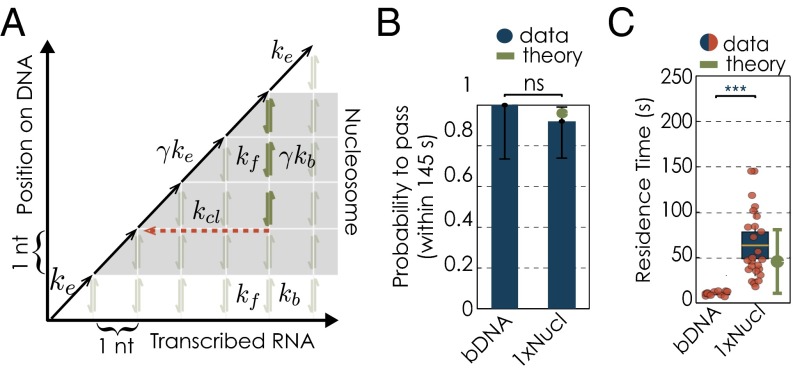
We assume that during active transcription on bare DNA, Pol II elongates with rate (Fig. 2A). This rate is known to be dependent on the force F applied in the optical tweezers (18, 19). However, due to the narrow range of entry forces and the small decrease of the force over the nucleosomal region in our experiments, we expect the applied force to change the elongation rate by less than 5% (SI Text). Therefore, in what follows, we consider to be independent of the applied force. At each template position Pol II can enter a backtrack, which results in the displacement of the RNA 3′ end from the active site and renders Pol II transcriptionally inactive. In the backtracked state, the enzyme can passively diffuse along the DNA with the forward and backtracking rates and , respectively (Fig. 2A). Both the forward and backtracking rates are influenced by the applied force F according to and , where denotes the intrinsic hopping rate in the absence of force (17, 19–21), a is the distance to the transition state, and is the thermal energy. We assume a to be 0.17 nm (5, 17), which places the transition state symmetrically between two base pair positions (spaced 0.34 nm apart). The exit from the backtracked state proceeds in a competition between two processes (22): first, realignment of the RNA 3′ end with the active site when Pol II returns to the starting point of its backtrack by passive diffusion; and second, intrinsic cleavage of the RNA 3′ overhang with rate s−1 (22). Importantly, both processes lead to a reinitiation of active transcription.
Fig. 2.
Stochastic model of transcription elongation in presence of a nucleosome: (A) Illustration of stochastic model: The x axis represents the transcribed RNA, and the y axis the position of Pol II along the DNA template. On bare DNA, the polymerase moves in the diagonal direction with the elongation rate . In the transcriptionally inactive state, the polymerase diffuses forward and backward in the vertical direction with the rates and , respectively. Cleavage of the displaced RNA transcript with the rate results in a horizontal move. The gray region indicates the position of the nucleosome. In the presence of a nucleosome both the elongation rate and the forward hopping rate decrease by the factor γ. (B) Quantification of the passage probabilities through the single nucleosomal region in presence or absence of nucleosome. The passage probability refers to the capacity of a polymerase to pass the nucleosomal region within the cutoff time of 145 s. The error bars represent 95% CI. Experimental data are shown in blue; theory is shown in green. We used the Barnard’s exact test to calculate the P values for binary datasets. Numbers of trajectories per condition as in Fig. 1. Two data sets are considered significantly different if the P value is below or equal to 0.05. Different P values are indicated as follows: ns, P > 0.05; ***P ≤ 0.001. (C) Residence times for all conditions (data in red/blue and theory in green).
To account for the presence of the nucleosomal barrier, the Bustamante laboratory has shown that local transient unwrapping of the DNA from the histone octamer allows the polymerase to pass further into the nucleosome (5). Following Hodges et al., we use γ to denote the fraction of time the downstream DNA is locally unwrapped from the histone octamer (5). Because the polymerase can only step further when the DNA is accessible (unwrapped), both and are decreased by the factor γ within the nucleosomal region (5) (see shaded region in Fig. 2A). The DNA upstream of Pol II is under mechanical tension, and we assume that the DNA remains unwrapped from the nucleosome once the polymerase has passed through it (5). Therefore, the nucleosomal backtracking rate remains unchanged from the value on bare DNA.
Importantly, the parameter γ can be directly obtained from the experimental data as the ratio of pause-free velocities () within the nucleosomal region and pause-free velocities within the same region of the same DNA template but without a nucleosome
| [1] |
From our experiments, we find that γ assumes a value of 0.67 0.11 in the presence of a single nucleosome.
We define the pause density as the number of pauses per kilobase pair, which can be expressed as
| [2] |
From our experimental data, we determine to be 0.56 0.14 s−1, which is in general agreement with earlier results (22) (Table S2).
Table S2.
Parameters used in the model
| Template | γ | Entry force (pN) | χ* | ()* |
| 1×Nucl | 0.67 ± 0.11 | 9.5 ± 1.0 | 1.35 ± 0.25 | 0.56 ± 0.14 |
| 2×Nucl (99) | 0.67 ± 0.12 | 10.4 ± 1.2 | 1.46 ± 0.30 | 0.55 ± 0.12 |
| 2×Nucl (50) | 0.48 ± 0.12 | 8.2 ± 0.8 | 0.87 ± 0.22 | 0.61 ± 0.13 |
| 2×Nucl (45) | 0.63 ± 0.14 | 9.7 ± 0.7 | 1.29 ± 0.30 | 0.61 ± 0.11 |
Values are obtained by using the force in the middle of the nucleosome, i.e., entry force − 1 pN.
Within this model, the ability of Pol II to transcribe through the nucleosome sensitively depends on the effectiveness of the enzyme to recover from a nucleosomal backtrack. The ability to recover from a backtrack, however, depends on whether during backtracking the polymerase is more likely to step further into a backtrack or step in the direction out of the backtrack. If at every nucleosomal backtrack position it is more likely for the polymerase to step further into a backtrack than out, nucleosomal backtracking pauses will be of long duration and the chance of arrest within the nucleosome will be large. The ratio χ between forward and backward hopping rates in the nucleosomal region is given by
| [3] |
This dimensionless “drift coefficient” χ defines two regimes of Pol II nucleosomal transcription dynamics. If χ is larger than 1, Pol II can easily recover and resume active elongation. Conversely for , Pol II is more likely to step deeper into the backtrack. The increased likelihood to step deeper into a backtrack results in longer pauses and even arrest, because backtrack recovery can no longer occur via diffusion but through slow intrinsic transcript cleavage (with a time constant of 80 s) (22). Hence the value of χ determines whether Pol II manages to pass the nucleosome or is likely to get trapped within the nucleosomal region. Because 92% of the polymerases are able to pass the single nucleosome (Fig. 1G), we expect χ to be larger than 1. Consistent with this expectation, we find that χ is equal to 1.35 0.25 for the single nucleosome condition (Table S2). We conclude that the drift coefficient χ quantifies the impact of the nucleosome on Pol II transcription dynamics.
To summarize, the quantities we used in the model were the entry force when Pol II arrives to the nucleosomal DNA, decrease of the pause-free velocity in the nucleosomal region, and the pause density. Although the first two parameters determine the χ parameter, all three of them are related to the elongation of Pol II. The two important quantities that can be calculated with the help of the model are residence time and the passage probability. Importantly, those are determined by both the elongation and the backtracking dynamics together. Our model, however, provides information on the backtracking dynamics from the measurements of the elongation dynamics. In this respect, the results on the passage probability given by the model can be considered as a prediction, based on the empirically determined elongation parameters.
To test whether we are able to predict Pol II nucleosomal passage probabilities from the measured value of χ, we generated Pol II transcription trajectories via kinetic Monte Carlo simulations (23) using the calculated value of χ (SI Text). We find that both passage probabilities and residence times (within 145 s) through the nucleosome obtained from numerical simulations are consistent within errors with those measured in experiments (Fig. 2 B and C). Note that calculated residence times show a broad distribution, owing to the stochasticity of the transcription process. Thus, we are able to predict Pol II nucleosomal passage probabilities from the measured reduction in elongation rate and the increase in the number of pauses within the nucleosomal region as captured by χ. Next, we use this theoretical analysis to quantify which properties of nucleosomal transcription are affected on addition of a second nucleosome.
The Presence of a Second Nucleosome Impairs Pol II Transcription Dynamics Through the First Nucleosome by Reducing the Drift Coefficient χ.
To test whether the presence of a second nucleosome affects Pol II transcription dynamics through the first nucleosome, we investigated transcription dynamics of individual Pol II enzymes along dinucleosomal templates. We performed our initial experiments on dinucleosomal templates with an internucleosomal spacing of 50 bp, which is larger than the typical spacing in yeast (23 bp) (8) but smaller than the typical spacing in higher eukaryotes (60 bp) (24).
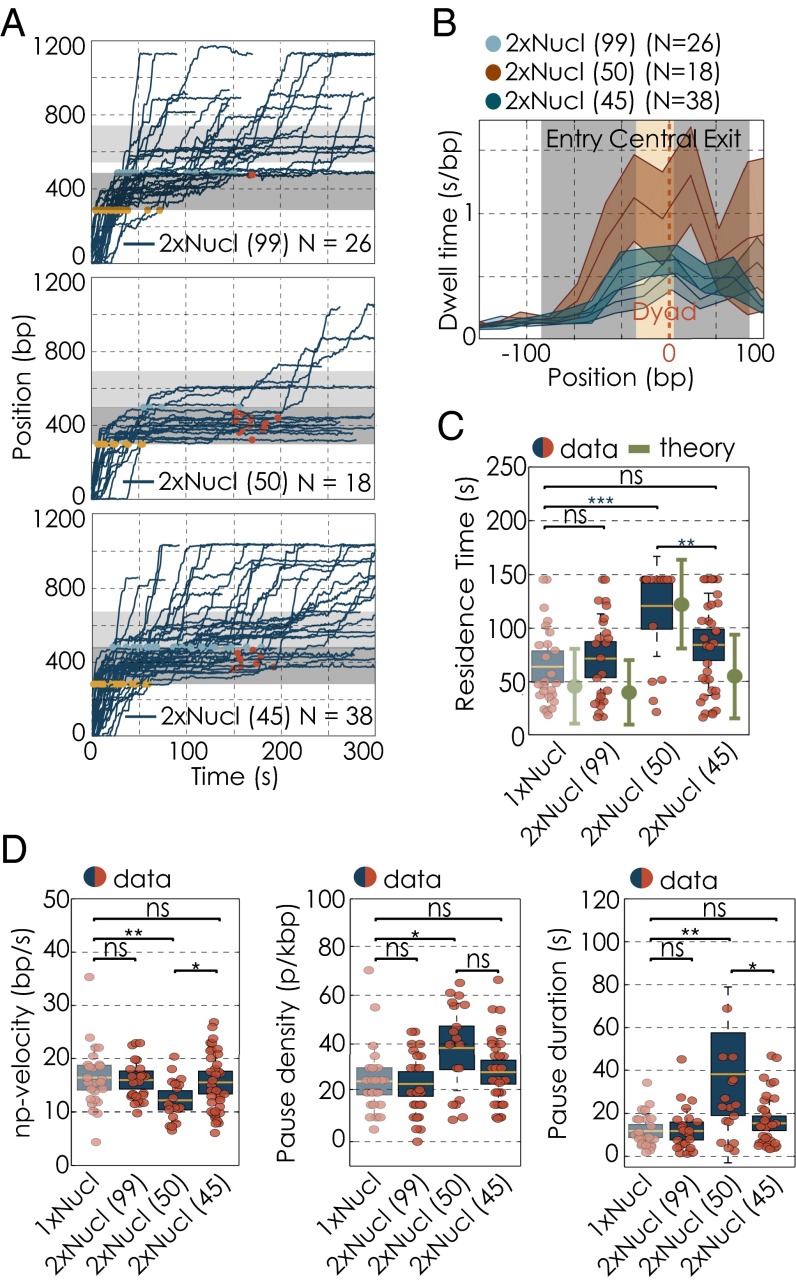
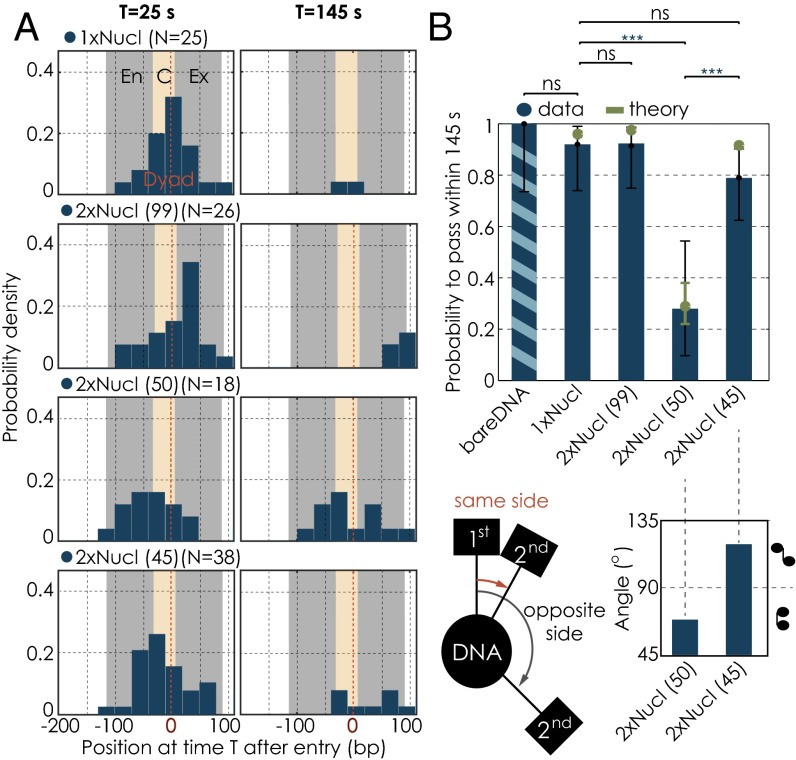
Strikingly, we find that placing a second nucleosome 50 bp downstream of the first one considerably affects Pol II transcription dynamics within the first nucleosome (Fig. 3A): dwell times are highly increased within the central region of the first nucleosome compared with the mononucleosomal condition (Fig. 3B). Nucleosomal residence times increased almost twofold to 118.9 23.0 s (Fig. 3C) due to a decreased elongation rate and an increase of both pause frequency and duration (Fig. 3D). Importantly, the passage probability decreased to 28% (Fig. 4 A and B). Note that, although we used Pol II slowdown dynamics in the first nucleosomal region to detect the presence of the first nucleosome, we cannot perform a similar analysis to detect the presence of the second nucleosome (SI Text). Given that we expect the second nucleosome to actually be absent in a small fraction of experiments (Fig. S1B), we thus slightly underestimate the impact of the second nucleosome on the transcription dynamics through the first.
Fig. 3.
Single-molecule transcription elongation by RNA polymerases II along dinucleosomal DNA templates. (A) Transcription traces of individual Pol II molecules, transcribing along a different dinucleosomal DNA templates: 99-bp linker (Top), 50-bp linker (Middle), and 45-bp linker (Bottom) (data filtered at 1-kHz bandwidth). The gray bar illustrates the position of the nucleosome. Yellow and blue dots highlight the position at which polymerases enter and exit the nucleosome, respectively. For polymerases that did not transcribe through the nucleosomal region within 145 s, red dots mark their position at 145 s after entering the nucleosomal region. (B) Changes in dwell time distributions along different dinucleosomal DNA templates, zoomed into the first nucleosomal region. The gray bar illustrates the position of the nucleosome; the yellow area marks the central region. Dwell time distribution for the 99-bp linker template (light blue), 50-bp linker (red), and 45-bp linker template (dark blue). The solid line represents the mean, whereas the shaded areas show the respective SEM. (C) Residence times for transcription on dinucleosomal DNA template (data in red/blue and theory in green). (D) Changes in transcription parameters on different dinucleosomal DNA templates with and without a nucleosome: changes in pause-free velocities (Left). Pause densities (Center) and pause durations (Right). Quantifications for each transcription parameter are shown as box plots, where the central mark is the mean, the edges of the box are the SEM, and the whiskers are the SDs. The red dots represent values for single experiments. N indicates the number of Pol II transcription trajectories on each template. Two datasets are considered significantly different if the P value is below or equal to 0.05. Different P values are indicated as follows: ns, P > 0.05; *P ≤ 0.05; **P ≤ 0.01; and ***P ≤ 0.001.
Fig. 4.
Change in passage probabilities in the presence of a second nucleosome as a function of internucleosomal distance. (A) Residence distributions of polymerases at 25 s (Left) and 145 s (Right) after entering the first nucleosomal region for the different conditions. Note that some enzymes are outside of the field of view. The gray bar illustrates the position of the nucleosome (En, entry; Ex, exit); the yellow area marks the central region (C, central). (B) Quantification of the passage probabilities through the first nucleosomal region. The passage probability refers to the capacity of a polymerase to pass the nucleosomal region within the cutoff time of 145 s. Note that our results are not sensitive to the precise value of the cutoff chosen to define passage probabilities (Fig. S4) nor is there a dependency on force for the range of forces applied (Fig. S5). Error bars represent the 95% CI. Experimental data are shown in blue; theory is shown in green. We used the Barnard’s exact test to calculate the P values for binary data sets. (C) (Left) Differences in nucleosomal orientations, where the two neighboring nucleosomes lie on the same or on opposite sides of the DNA. (Right) Angular distributions of the two neighboring nucleosomes for the 50- and 45-bp linker templates. Numbers of trajectories per condition as in Fig. 3. Two datasets are considered significantly different if the P value is below or equal to 0.05. Different P values are indicated as follows: ns, P > 0.05; ***P ≤ 0.001.
In the framework of our stochastic model, we expect that this significant reduction in passage probabilities is caused by the factor χ dropping below 1. Indeed, pause densities are increased more than sevenfold and γ drops to 0.48 0.12, resulting in the drift coefficient χ to be reduced to 0.87 0.22 (Tables S1 and S2 and Fig. 3D). Similar to the single nucleosome condition, we are capable with this measured value of χ to recapitulate within errors the residence time within and to predict passage probability through the first nucleosome (Figs. 3C and 4B). To conclude, the ability of Pol II to progress through a nucleosome is severely impeded by placing a second nucleosome 50 bp downstream. The second nucleosome reduces the drift coefficient χ to a value below 1, rendering Pol II ineffective in rapidly recovering from backtracks within the first nucleosome.
The Internucleosomal Arrangement Affects Pol II Transcription Dynamics.
We next sought to investigate whether the impact of the second nucleosome on Pol II transcription dynamics through the first one depends on internucleosomal spacing. We therefore studied dinucleosomal compounds with different spacings. A linker length of 99 bp corresponds to 34 nm, which is approximately three times larger than the diameter of the single nucleosome (11 nm). We thus expect that at this internucleosomal distance, the impact of the second nucleosome on the transcription dynamics through the first one is reduced. Indeed, we observed that increasing the distance between the two nucleosomes to 99 bp resulted in an essentially complete recovery of Pol II transcription dynamics through the first nucleosome, which were now indistinguishable from Pol II dynamics in the presence of a single nucleosome only (Figs. 1C and 3 A–D). Furthermore, the calculated value of χ is 1.46 0.30, and thus the passage probability reached 92%, again both similar to the single nucleosome condition (Fig. 4B and Table S2). This result suggests that the presence of a second nucleosome per se does not impact the transcription dynamics through the first. Instead, this impact only arises when the two neighboring nucleosomes are sufficiently close.
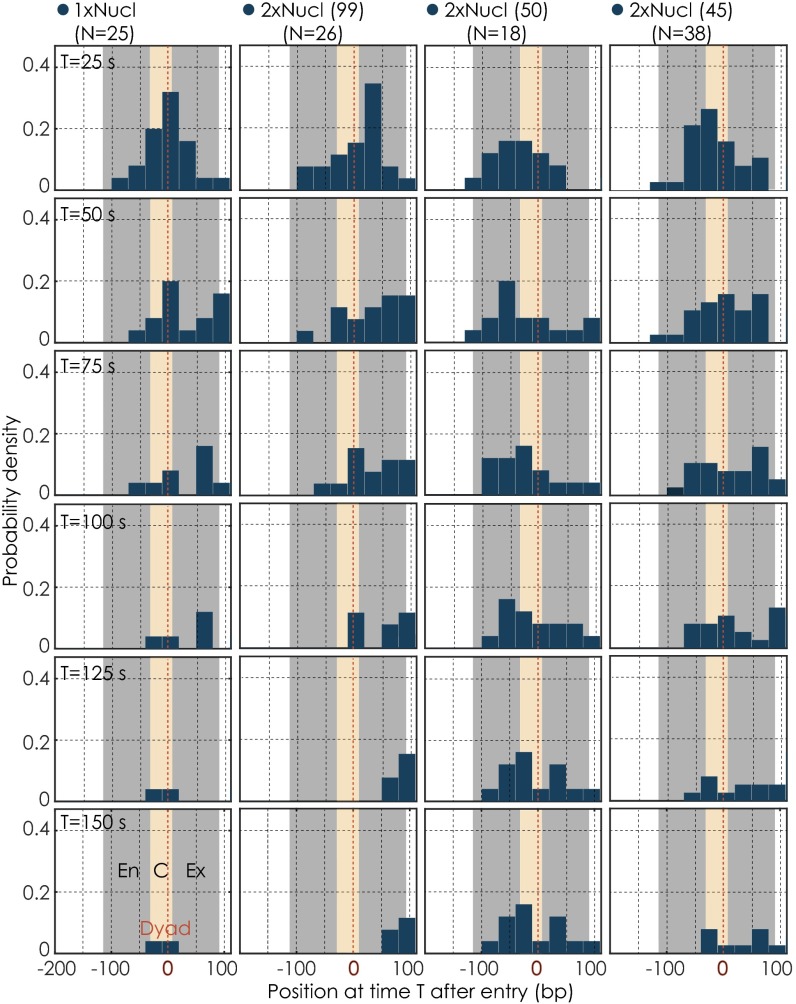
Given the helical nature of the DNA molecule, we hypothesize that not only the distance in base pairs but also the rotational arrangement of the two nucleosomes with respect to each other impact the transcription dynamics through the first nucleosome (Fig. 4C, Left). We thus tested whether changing the rotational arrangement between the two neighboring nucleosomes affects the drift coefficient χ and the Pol II transcription performance through the first nucleosome. With the 50-bp internucleosomal spacing, the two nucleosomes face the same side of the DNA helix (Fig. 4C). Given that 10.4 bp corresponds to one full DNA helical turn, decreasing the spacing by 5 bp (i.e., half a helical turn) brings the two nucleosomes closer together in terms of base pair distance, but now places them toward opposite sides of the DNA and hence further apart overall (8, 25, 26) (Fig. 4C). Strikingly, we find that for the 45-bp linker, nucleosomal residence times are significantly decreased, and passage probabilities are greatly increased compared with the 50-bp linker condition (Tables S1 and S2 and Figs. 3C and 4B). Hence, reducing the internucleosomal distance from 50 to 45 bp greatly reduces the impact of the second nucleosome on the transcription dynamics through the first one. Consistent with this observation, we determine χ to be 1.29 0.30 for a spacing of 45 bp. This value is above 1; hence, Pol II is able to rapidly recover from backtracks. Consequently, 79% of all single RNA polymerases tested on the template with an internucleosomal spacing of 45 bp are able to exit the first nucleosomal region (within 145 s) (Fig. 4 A and B and Fig. S6), in good agreement with the value predicted from theory (Fig. 4B). Although more experiments with a broader range of linker lengths are necessary to demonstrate a helical phasing effect, we conclude that Pol II transcription dynamics and passage probabilities through the first nucleosome depend on the length of the linker DNA and on the rotational offset between the two neighboring nucleosomes.
Fig. S6.
Time evolution of nucleosomal transcription along different nucleosomal templates. Probability densities of polymerases within the first nucleosomal region at different time points (T) during nucleosome transcription. The time points are taken 25 s apart from each other. The gray bar illustrates the position of the first nucleosome (En, entry; Ex, exit); the yellow area marks the central region (C, central). N indicates the number of Pol II transcription trajectories on each template.
Discussion
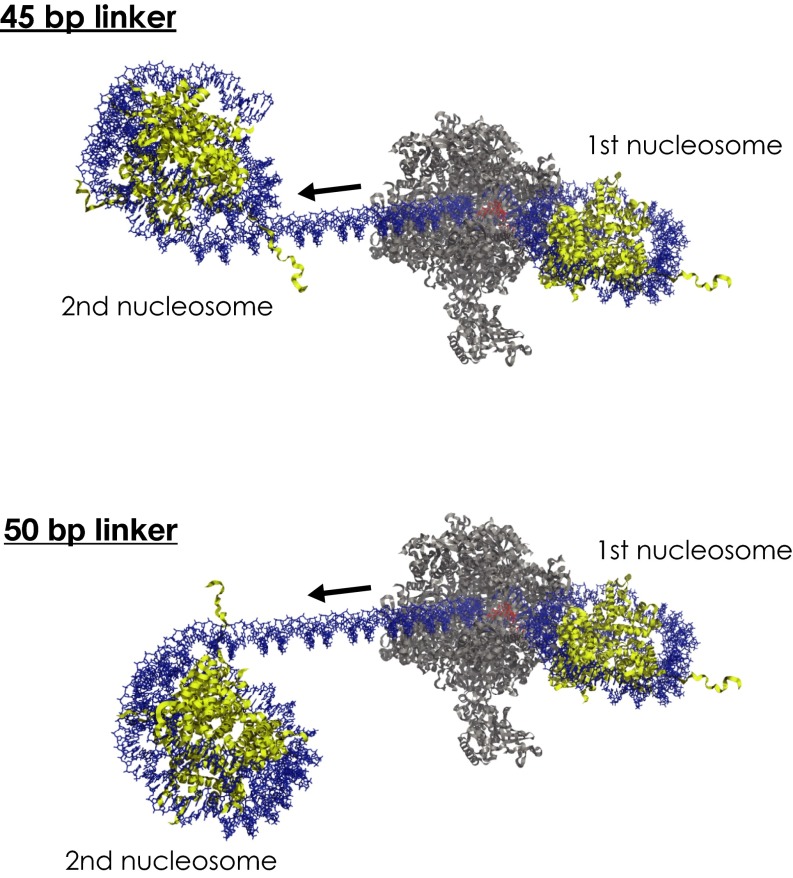
Here, we performed single-molecule transcription experiments along dinucleosomal templates differing in their internucleosomal arrangement. We discover that a second nucleosome affects Pol II nucleosomal transcription dynamics through the first nucleosome (as quantified by the drift coefficient χ) and the ability to pass it, whereby a decreased distance in base pairs between the two neighboring nucleosomes can be compensated by the rotational offset between them. Placing the two nucleosomes on opposite sides of the DNA helix results in Pol II nucleosomal transcription dynamics similar to what is obtained without the second nucleosome. Hence, the internucleosomal arrangement between the two neighboring nucleosomes impacts the transcription dynamics through the first nucleosome. However, how is this effect realized? How can the second nucleosome influence the transcription dynamics through the first one? One possibility is that the stability of the first nucleosome on the DNA templates is affected by the presence of the second nucleosome. We tested for such an effect by performing force–extension measurements, to determine nucleosome–DNA stability by measuring at which forces nucleosomes unwrap from DNA. However, we found that nucleosomal stabilities were similar for all of the different dinucleosomal templates (SI Text, Fig. S7, and Table S3). Thus, we conclude that the observed differences in transcription dynamics cannot be attributed to differences in nucleosomal stabilities for the different dinucleosomal templates. This result suggests that the transcribing Pol II enzyme itself mediates this intercommunication between the two neighboring nucleosomes and the corresponding changes in the transcriptional drift coefficient χ we have measured. A molecular model (Fig. S8), where we positioned the elongating Pol II complex in the exit region (past the dyad) of the first nucleosome, lends credence to this interpretation. The model shows that in the context of an elongating polymerase, internucleosomal distances differ for the two geometries. Contacts between the two neighboring nucleosomes are more likely with the 50-bp linker compared with the 45-bp linker (45-bp linker with 130 Å vs. 50-bp linker with 110 Å; Fig. S8). However, further studies are required to identify the molecular basis of how the second nucleosome influences transcription through the first. Interestingly, in vivo histones are highly modified and known to affect Pol II transcription efficiencies through nucleosomes. An interesting line of future research is to understand to what extent histone modifications modulate this geometry and the impact on the transcribing Pol II enzyme.
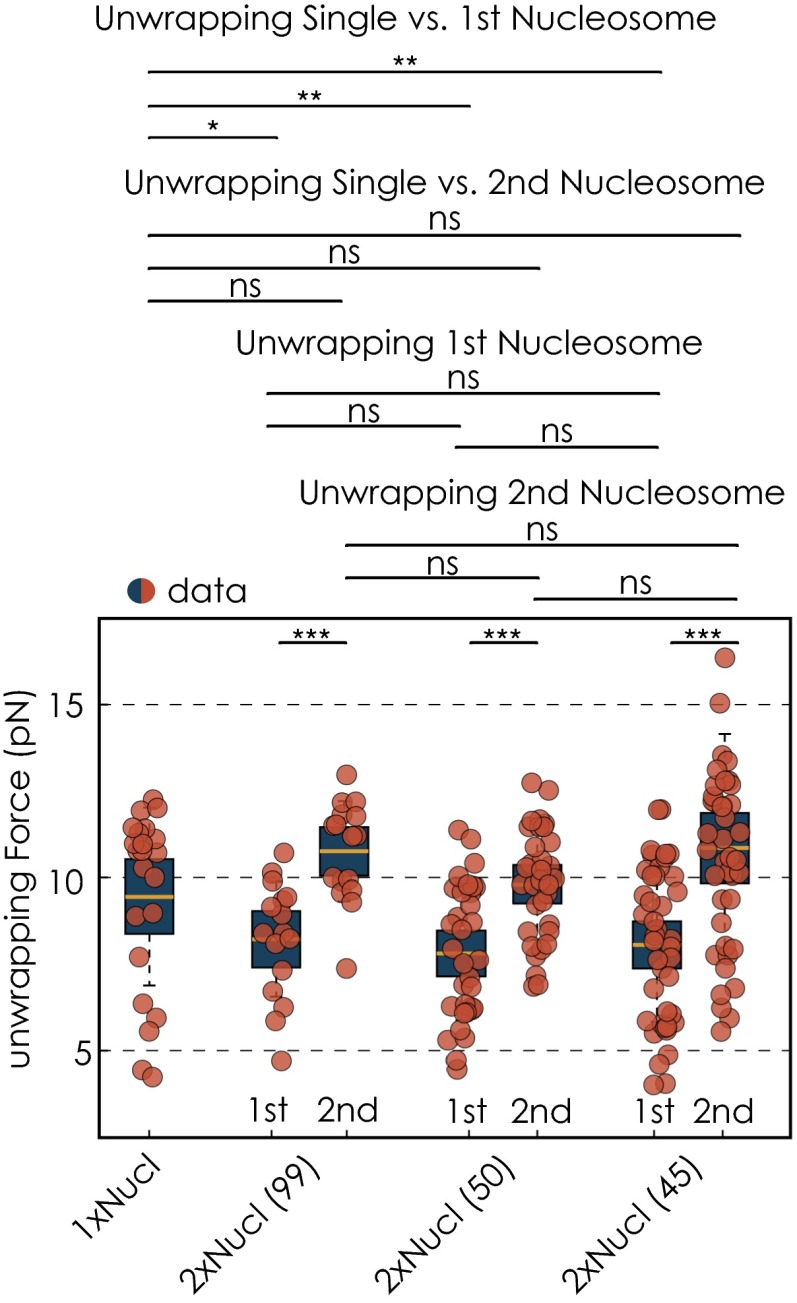
Fig. S7.
Nucleosomal stabilities for different nucleosomal templates. Distributions of unwrapping forces are splitted into the first and the second nucleosomal unwrapping event. Unwrapping forces are in general higher for the second unwrapping event. Quantifications for the unwrapping forces for the different conditions are shown as box plots, where the central mark is the median, the edges of the box are the 25th and 75th percentiles, and the whiskers extend to the most extreme data points not considered outliers. The red dots represent values for single experiments. We used the Wilcoxon rank sum test to compare two sets of data. Two datasets are considered significantly different if the P value is below or equal to 0.05. Different P values are indicated as follows: ns, P > 0.05; *P ≤ 0.05; **P ≤ 0.01; and ***P ≤ 0.001.
Table S3.
Average unwrapping forces for the inner wrap of all nucleosomal conditions
| Template | UW force first Nucl* | UW force second Nucl |
| 1×Nucl | 9.5 ± 2.6 (10.7) | |
| 2×Nucl (99) | 8.2 ± 1.7 (8.4) | 10.8 ± 1.4 (11.2) |
| 2×Nucl (50) | 7.8 ± 1.9 (7.6) | 9.8 ± 1.6 (9.9) |
| 2×Nucl (45) | 8.1 ± 2.2 (8.2) | 10.8 ± 3.3 (10.8) |
Quantity reported as mean ± SD. The median is given in parentheses.
Fig. S8.
Molecular models for the different nucleosomal geometries: Two models with a 45- or 50-bp linker illustrate the angular distribution of two neighboring nucleosomes in the presence of an elongating RNA polymerase II complex. Pol II is situated in the exit side (past the dyad) of the first nucleosome. The black arrow indicates the direction of transcription. RNA polymerase II is rendered in gray, histone octamer in yellow, DNA in blue, and RNA in red. Models were generated using Coot and Pymol.
Finally, we note that earlier work has shown that yeast exhibits a very tight nucleosomal organization, with adjacent nucleosomes placed on opposite sides of the DNA helix due to the offset of one-half a helical turn (8–11). Our results therefore suggest that this type of nucleosomal arrangement might be critical for efficient chromatin transcription by RNA polymerase II.
SI Text
Generating Transcription Elongation Complexes.
The RNA polymerase II used in all transcription experiments was purified from Saccharomyces cerevisiae according to (15). Pol II was biotinylated at the amino terminus of the Rpb3 subunit for use in our setup (27). Pol II transcription elongation complexes (TECs) were generated with a stepwise assembly protocol (15, 16). Polymerases were incubated with an RNA/DNA hybrid (RNA primer annealed to the template DNA strand), followed by the addition of the nontemplate DNA strand (NDS). TECs were subsequently ligated to an 2-kb upstream double-stranded DNA template (labeled with a digoxigenin) and an 1-kb downstream double-stranded DNA template. The upstream DNA template was generated via PCR from plasmid pEG2, which has a uniform GC content (28). The active site of Pol II is located such that 71 bp of the TEC add to the downstream template transcribed by the enzyme (Fig. S2). The different downstream templates are introduced below.
Generating Nucleosomal Templates.
All four canonical yeast core histone proteins were expressed and purified from E. coli. These histone molecules are artificial as they lack any type of posttranslational modification. Nucleosomes were loaded onto the strong NPSs Widom601 (12) using salt dialysis reconstitution. The use of this artificial NPS is crucial for our experiments as it ensures exact and reproducible positioning of the nucleosomes along the downstream templates. Protocols for the histone purification and for the chromatin reconstitution were adapted from refs. 13 and 14. All nucleosome reconstitutions were done with the same batch of yeast histone octamers. The different nucleosomal templates used in this study differ in the number of high-affinity Widom601 sequences, as well as in the spacing between them (Fig. S2). Two adjacent 601 NPSs (each 197 bp) result in a spacing of exactly 50 bp between the two nucleosomes. Internucleosomal spacings of 45 or 99 bp were obtained by removing 5 bp or adding 49 bp to the 50-bp linker, respectively. A fresh PCR of the corresponding DNA template was done before every nucleosome reconstitution. The PCR products were purified and concentrated by phenol-chloroform extraction, followed by ethanol precipitation. The purified DNA templates were further cut with BstXI for further ligation to the TEC. After heat inactivating the enzyme, the cut products were purified with the Wizard SV Gel and PCR Clean-Up System (Promega). The purified DNA templates were further used for nucleosome assembly. Correct positioning of the nucleosomes on the respective templates was tested by analytical restriction digest and a subsequent gel-based assay (Fig. S1A). Furthermore, the reconstitution efficiency of different nucleosomal templates was tested by performing force–extension measurements (Fig. S1B). The TEC was then ligated to both the upstream template and the downstream template in a single ligation reaction using the Quick Ligase (NEB). At least two independent nucleosome reconstitutions were tested for each condition: 1×NPS = 4; 2×NPS (99) = 3; 2×NPS (50) = 7; and 2×NPS (45) = 2.
Force–Extension Measurements: Determining Reconstitution Efficiencies.
All DNA templates to be tested were prepared as explained above, yet no polymerase was assembled onto the TEC, and instead, downstream DNA templates were equipped with a biotin tag. Before optical tweezers experiments, DNA molecules were bound to functionalized polystyrene beads. DNA tethers were formed between the biotinylated downstream DNA attached to a streptavidin coated bead (2.1 μm diameter) on one side and the digoxigenin-labeled upstream DNA template bound to an anti–digoxigenin-coated bead (2.1 μm diameter) on the other side. All experiments were performed in transcription buffer [20 mM Hepes (pH 7.6 at 20 °C), 60 mM (NH4)2 SO4, 8 mM Mg2 SO4, 10 μM ZnCl2, 10% (wt/vol) glycerol] supplemented with an oxygen scavenger system (29). After successful DNA tether formation between the two beads (at forces 2 pN), one optical trap was moved in a stepwise manner away from the second trap (5 nm every 200 ms), constantly increasing the load acting on the DNA template. The loading rate was 0.46 pN/s for the lower force range up to 5 pN, 0.53 pN/s for the force range between 5 and 10 pN and 0.62 pN/s for the force range between 10 and 16 pN. At these loading rates, the system is supposed to be at equilibrium. On increasing the load on the DNA template, individual nucleosomes unwrapped. Most of the nucleosomes were unwrapped after having reached a force of 15 pN. We did not observe a clear signature of the outer unwrapping event of the H2A/H2B dimers. Under the prevalent salt concentration of 60 mM (NH4)2 SO4 (ionic strength of 120 mM), only the inner unwrapping event was observed, which is reflected in a sudden decrease in force and instantaneous increase in the extension (3, 5, 30, 31). The estimated average length increase for each event calculated from all conditions was on the order of 25 nm (74 1 bp, mean SD). Force–extension measurements allow to determine the quality of the chromatin reconstitutions; 75% of all tested single nucleosomal templates exhibited one or more unwrapping events (68% showed a single unwrapping event), whereas for dinucleosomal templates, two or more unwrapping events were seen for ∼68–71% of all tested templates (55–59% showed exactly two unwrapping events; Fig. S1B).
Single-Molecule Optical Tweezers Transcription Assay.
Similar to force–extension experiments, tethers were formed between the biotinylated polymerase attached to a streptavidin coated bead (2.1 μm diameter) on one side and the digoxigenin-labeled upstream DNA template bound to an anti–digoxigenin-coated bead (2.1 μm diameter) on the other side. Experiments were performed with 1 mM NTP in transcription buffer [20 mM Hepes (pH 7.6 at 20 °C), 60 mM (NH4)2 SO4, 8 mM Mg2 SO4, 10 μM ZnCl2, 10% (wt/vol) glycerol] supplemented with an oxygen scavenger system (29). All experiments were performed in the assisting force mode, whereby the force is applied into the direction of polymerase translocation. The force was manually set to 12 pN at the beginning of each experiment. We do not have a force feedback in our transcription experiments. Consequently, during active elongation the applied force decreases while at the same time the distance between the two beads increases. The force applied on the polymerase for the entire length of the experiment was kept between 12 and 4 pN.
Data Acquisition and Analysis.
Data collected from optical tweezers experiments was further analyzed using a custom software written in Matlab (MathWorks; R2013b). The force data were filtered with a Gaussian filter (time constant of 1 s) or a third-order Savitzky–Golay filter (time constant of 2 s). To determine the exact distance in base pairs between the two beads, the extensible worm-like chain model (eWLC) was applied on the force data (32). For transcription experiments, the velocity was calculated as the derivative of the Gaussian-filtered signal (5, 20, 33, 34). Pauses were detected as parts of transcription traces with dwell times longer than the pause threshold (three times the mean dwell time, using the Savizky–Golay filtered data) (35). We analyzed pause densities, calculated as the average number of pauses per kbp, and pause durations, calculated as the average duration of pauses lasting between 1 and 145 s (35).
For force–extension experiments, the force data were filtered with a Savizky–Golay filter. To determine nucleosome unwrapping events, the constantly increasing force signal was scanned for a sudden drop in force. We assigned the corresponding force and position values of the peaks and subsequent valleys to each unwrapping event.
Alignment of Single-Molecule Transcription Traces.
For transcription experiments carried out on bare DNA, we assumed that most polymerases reached the end of the DNA template. Therefore, the experimental run-off length should match the template length. All used DNA templates underwent a quality check by gel electrophoresis before their use in single-molecule experiments. However, in our experiments, the run-off length deviated from the expected run-off length on average by 7.1% (67 bp for the bare DNA template with one NPS). We ascribe these uncertainties to calibration errors, mostly caused by the spread in bead size, viscosity, and temperature. To correct for the length difference, all bare DNA trajectories were linearly scaled to the expected run-off length (3). For transcription experiments performed on nucleosomal templates, however, it is uncertain whether the polymerases reach the end of the template. The presence of a nucleosome can alter the Pol II transcription performance in a way that leads to an early transcriptional arrest due to the increased transcriptional barrier (3, 5). Only transcription trajectories where the difference between the measured and the expected run-off length was smaller than 10% were considered as trajectories where the polymerases reached the final length. All trajectories fulfilling these criteria were linearly scaled to the expected run-off length. To correct for the length uncertainty of transcription traces, where the expected run-off length was larger than the 10% cutoff, we computed a correction factor from the mean run-off length of all runs that were below the 10% cutoff (ratio between mean experimental run-off length and expected run-off length). Correction factors were computed for each nucleosomal template separately. All of the runs with the expected run-off length above the cutoff value were then linearly scaled by the respective correction factor.
Evaluation of Transcription Traces.
We consider the core region consisting of 147 bp of DNA wrapped around a histone octamer plus additional flanking regions upstream and downstream of the respective region, as previously reported in Bintu et al. (3) (Fig. 1B), as the region of nucleosomal influence. Force–extension experiments on different nucleosomal templates revealed a reconstitution efficiency between 68% and 75%. Consequently, it is necessary to test for the presence of nucleosome on each template used in the optical tweezer. However, due to the geometry of the setup we cannot control for the presence of a nucleosome on the respective NPS on our DNA templates before the transcription experiment, because nucleosomes are not under tension at the beginning of our experiment. Furthermore, it is not possible to reliably determine the presence of a nucleosome after the nucleosome was passed (5). We find that in less than 10% of the cases where we performed postpassage force–extension measurements we observed sudden drop in force, characteristic for a nucleosomal unwrapping event, consistent with what was seen in ref. 5. These numbers compare unfavorably to the reconstitution efficiencies that were independently measured in the optical trap (Fig. S1B), and postpassage force extension cannot be used to test for the presence of a nucleosome. The low percentage of postpassage nucleosomal unwrapping is most probably due to the fact that tension is continuously applied and nucleosomes are probably unable to rewrap after passage. For these reasons, we decided to use the distinct increase in pausing and the characteristic slowdown of Pol II that is observed when a nucleosome is present on the DNA template (Fig. 1 C–F) (5) as a method for detecting the presence of the first nucleosome. Note, however, that we cannot use similar criteria to detect the second nucleosome, as transcriptional dynamics after passage of the first nucleosome cannot be accurately quantified in our system. This inaccuracy is because we calibrate our optical tweezers with a histone-free double-stranded DNA tether, where the nucleosomes are initially in a region that is not under tension (Fig. 1A). However, after nucleosomal passage, the tether between the two beads might no longer be nucleosome free, and residual interaction of histones with the upstream DNA or changes in the wrapping state prohibit a correct distance determination. However, our overall reconstitution efficiencies are reasonably high (Fig. S1B): 75% of all tested single nucleosomal templates had at least one nucleosome present, and 68–71% of all tested dinucleosomal templates showed at least two nucleosomal unwrapping events (Fig. S1B). Nonetheless, our inability to check for the presence of the second nucleosome results in a slight underestimation of the influence of the second nucleosome on the Pol II passage probability through the first nucleosomal region, because in some of the cases a second nucleosome was absent.
As an unbiased method for determining whether there was a nucleosome incorporated at the first nucleosomal region, we compared Pol II passage times through the nucleosomal region on the bare DNA template to passage times through the same region on nucleosomal templates. As a cutoff, we took the mean passage time through the nucleosomal region on the bare DNA template plus 2 SDs (11.2 + 2 × 1.9 s). Each first nucleosomal region of each trajectory was evaluated individually. Passage times above the cutoff were considered to result from the presence of a nucleosome (Fig. S3A). Only transcription data where the first nucleosome has been present on the template were included into the subsequent analysis.
The presence of a nucleosome increases Pol II arrest probabilities in the nucleosomal region (3, 5). However, there is a spread in final arrest duration among the polymerases that arrest in the first nucleosomal region, also because there is the possibility of a sudden rip of the DNA tether between the two beads. For these cases, it is unclear whether these polymerases were indeed arrested, i.e., transcriptionally inactive, or whether they would have resumed to transcribe after some further time if the tether had not ripped. Therefore, another quality check was performed on the arrest duration within the first nucleosomal region. Only polymerases that have resided within the first nucleosomal region above a certain time threshold were included in the analysis. To determine whether a final pause within the first nucleosomal region can be considered long enough, we compared the passage times through the entire nucleosomal region of transcription trajectories collected on the single nucleosomal template to the ones of the first nucleosomal region of all trajectories of all other conditions. The cutoff time was calculated from all data (mononucleosomal template) that were previously selected for the presence of a single nucleosome and where the polymerase transcribed past the nucleosome. We took the mean passage time through this region plus 2 SDs (66.04 + 2 × 39.68 s) as a cutoff time and compared it to the passage time through the first nucleosomal region of each individual run of all conditions (Fig. S3B). We considered that all polymerases with passage times above the cutoff value resided long enough in the first nucleosomal region and hence were included in the analysis. Note that changing the cutoff to mean + 1 SD (105 s) does not change our general results (Fig. S4A).
Fig. S4.
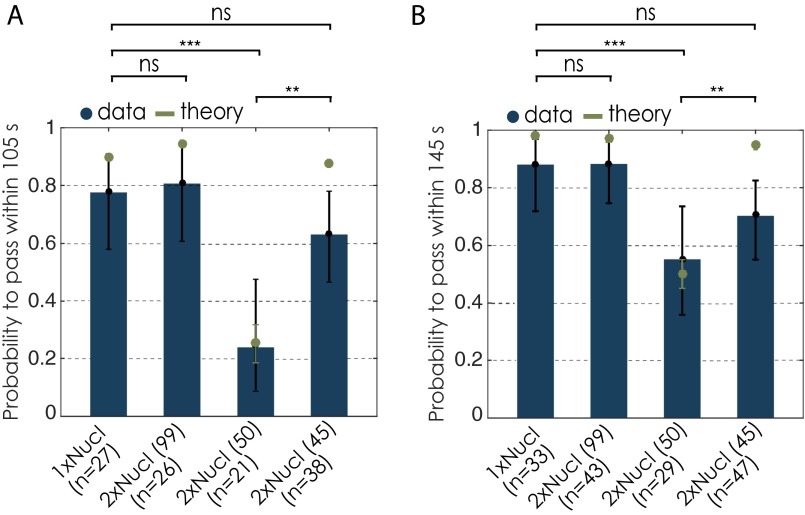
Changes in passage probabilities with different evaluation criteria. (A) Passage probabilities within 105 s (mean + 1 SD of the nucleosomal residence time). The error bars represent 95% CI. Experimental data are shown in blue; theory is shown in green. (B) Passage probabilities for all data before selecting for the presence of the first nucleosome. Note that for polymerases arrested within the first nucleosomal region, only transcription trajectories with an arrest length above 145 s were considered. Furthermore, for the analysis of Pol II transcription dynamics of all data, we also considered only 145 s after encountering the nucleosome. We used the Barnard’s exact test to calculate the P values for binary data sets. Two datasets are considered significantly different if the P value is below or equal to 0.05. Different P values are indicated as follows: ns, P > 0.05; **P ≤ 0.01; and ***P ≤ 0.001.
The analysis of transcription trajectories along different nucleosomal templates is therefore based on the following criteria:
Only transcription traces where the first nucleosome was present were included for further analysis;
For the polymerases that did not pass the first nucleosomal region, only those traces with passage times longer than the cutoff time of 145 s were considered;
We only consider changes in Pol II transcription dynamics within the first nucleosomal region; and
Only a time window of 145 s after encountering the first nucleosome was considered for the final analysis of Pol II transcription dynamics (pause-free velocity, pause density, pause duration) in the first nucleosomal region or the single nucleosome region. All polymerases that did not transcribe through the nucleosome in this time window were considered to be ‘arrested’.
It is important to mention that our results are not sensitive to the precise value of the cutoff chosen to define passage probabilities (Fig. S4A). Also, qualitatively similar results are obtained without any type of selection, where, however, less of an impact of the second nucleosome onto the passage through the first one is observed, because now in some cases no nucleosomes were present (Fig. S4B).
Effects of the assisting force.
Because in optical tweezers experiments we apply a force to the polymerase, here we explore the influence of this force on Pol II transcription dynamics in the context of a nucleosome. All transcription parameters discussed here depend to some extent on the applied force (18, 19, 21, 22). Our experiments were done in assisting force mode, where the applied force favors forward translocation of the enzyme along the DNA. In each experiment, the initial starting force was set manually to 12 pN with some variability around this value. When the polymerase encounters the nucleosome, the applied force is typically 9 1 pN. The applied force typically decreases by 2 pN during nucleosomal passage. Therefore, we tested if the observed effect might be due to the effect of forces.
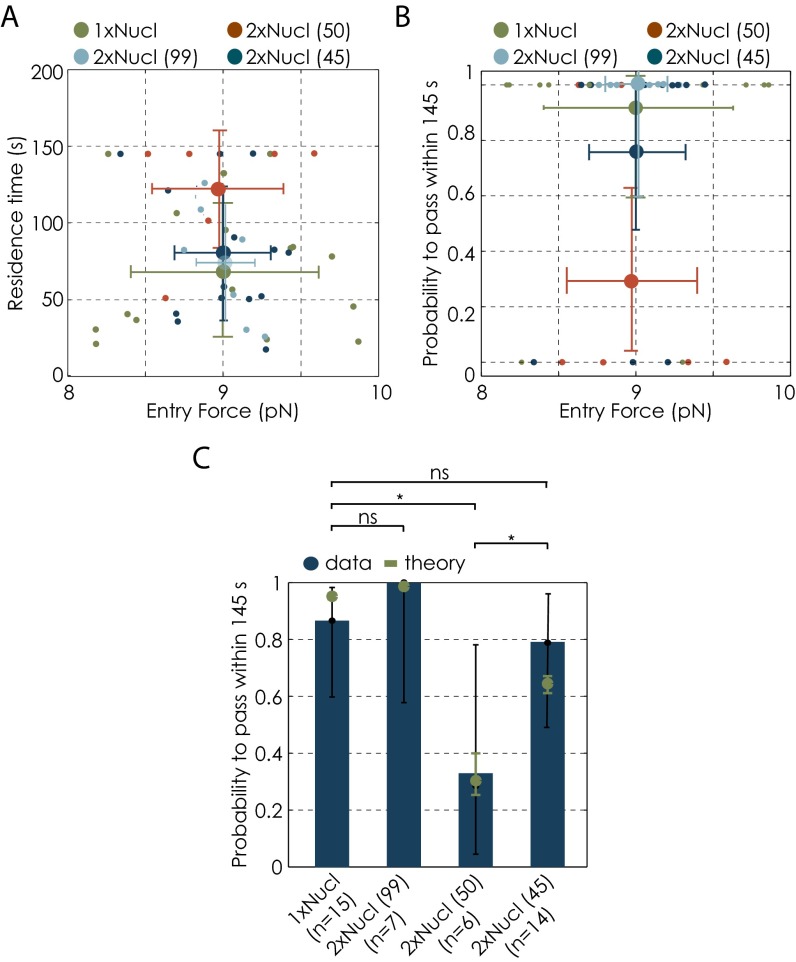
We therefore narrowed down the data to those trajectories that produce an average nucleosome entry force of 9 pN for each nucleosomal arrangement by discarding the extreme force values. The force range within each condition, as well as between different conditions, was therefore narrowed. Note that, as a consequence of this force threshold implementation the statistics was reduced (Fig. S5). Within the adjusted force range, possible dependencies between average transcription parameters and the average applied force were eliminated (Fig. S5 A and B). Furthermore, trends in passage probabilities for different nucleosomal templates are comparable to the trends observed for the full force range (Fig. 4A and Fig. S5C). When setting the force to 9 pN in our stochastic model, passage probabilities were still comparable to the experimental data. Therefore, we conclude that the observed differences between different nucleosomal templates predominantly arise from differences in the nucleosomal geometry rather than from the applied force.
Fig. S5.
Influence of applied force on Pol II transcription behavior. (A) Relationship between residence times and the applied force for all conditions for the defined average entry force of 9.0 pN. Data are shown as mean ± SD. (B) Relationship between passage probabilities and the applied force for all conditions for the defined average entry force of 9.0 pN. Force data are shown as mean ± SD. Error bars for passage probabilities represent 95% CI. Small dots represent single experiments (A and B). (C) Changes in passage probabilities between different conditions for the defined average entry force of 9.0 pN. Theory (green) was done for an entry force of 9.0 pN. Error bars represent 95% CI. We used the Barnard’s exact test to calculate the P values for binary datasets. Two datasets are considered significantly different if the P value is below or equal to 0.05. Different P values are indicated as follows: ns, P > 0.05; *P ≤ 0.05;
Simulation of transcription through nucleosomes.
To simulate Pol II transcription through a nucleosome we used the kinetic Monte Carlo method (23) on a 2D lattice (Fig. 2A). For convenience, we normalized the hopping rates (, , and ) and the cleavage rate by setting the largest one, which in our case is , to be 1/2. At each discrete time step (for now ), we chose the direction of the next move with equal probability: if Pol II is in the active elongation mode, it can elongate 1 bp (step) further or enter a backtrack; in the backtracked state, Pol II can move forward or backward and transit to the elongation mode by the cleavage activity. Hence, the probability is one third for each direction. Next, we generated a random number r from a uniform distribution in the range . If the random number is smaller than the normalized rate multiplied by the number of directions, Pol II makes a step in the chosen direction; otherwise, it remains in its current position. In our Monte Carlo simulations the probability of an actual move was largest for the elongation mode and was equal to 1/2. In physical units it corresponds to . Therefore, in our Monte Carlo simulations, we assigned a physical time of (measured in seconds) to one time step.
In the nucleosomal region, the elongation rate () and forward hopping rate () in the backtracked state are decreased by the factor γ. In our experiments, the assisting force acting on the polymerase is typically = 9 1 pN at the entry region of the nucleosome, and it decreases by about 2 pN as Pol II transcribes through the nucleosomal region (200 bp). We considered the force F to decrease linearly from the entry force. Therefore, the force F at position n bp within the nucleosome is given by . For , we used the mean entry force of the experimental data (entry force; Table S2). Accordingly, the hopping rates and are changing as Pol II progresses through the nucleosomal region as and . Here is the intrinsic hopping rate in the absence of force and nm. The force can also affect the elongation rate as shown in refs. 18 and 19. We estimated the variation of the with F by linearly fitting the force vs. elongation rate data of previous experiments (18, 19) and found that changes only by about 0.3 bp/s as the force changes by 1 pN. In our experiments, because of the narrow range of the entry force and small decrease of the force in the nucleosomal region, the change of is estimated to be less than 5%. For this reason, we assume the elongation rate to be constant in our model. To simulate trajectories, we placed Pol II at the nucleosomal entry point in the elongation mode and allow it to move following the hopping rules until the time reached 145 s. We generated stochastic trajectories using the model parameters extracted from our experiments (Table S2). From the obtained trajectories, we then calculated passage probabilities and residence times.
The combined effect of the force and the nucleosomal barrier is reflected in the drift coefficient, , which is critical for the backtracking dynamics and therefore for the transcription efficiency through the nucleosomal region. Because mean entry forces vary for different DNA templates (Table S2), it is important to determine their effect on the passage probability. To address this question, in the experimental data, we choose the trajectories within a narrow range of the entry force 9.0 0.8 pN for all different conditions. From these, we then determine γ (and χ). We use these parameters to simulate Pol II trajectories and calculate the passage probabilities (shown in Fig. S5C). The results obtained from these simulations using the narrow force range are again in agreement within errors with the experimental results for the same force range. Moreover, the trend remains the same as before when using the parameters from the full force range. We conclude, therefore, that differences in entry force between the different nucleosomal conditions are not the main factor that determines the differences in passage probabilities of different dinucleosomal configurations.
Nucleosomal Stabilities Are Comparable for the Different Dinucleosomal Templates.
Because Pol II transcription dynamics were different for the different dinucleosomal templates, we wondered whether these changes can be directly attributed to differences in nucleosomal stability. To investigate the stabilities of the two neighboring nucleosomes, we performed force extension measurements for all nucleosomal templates. Experiments were done at a slow loading rate to assure that the unwrapping process occurs at equilibrium. The single nucleosome (inner wrap) unwrapped at an average force of 9.45 0.45 pN (mean SD) at a loading rate of 0.5 pN/s (Fig. S7 and Table S3). This value is in good agreement with previously published data collected under similar experimental conditions (5, 30, 31). In general, we observed that unwrapping forces for the first unwrapping event were substantially lower than unwrapping forces for both the single nucleosome, as well as the second nucleosome. All dinucleosomal templates showed the same unwrapping pattern at comparable forces. Hence, stabilities of different dinucleosomal templates are comparable. We conclude, therefore, that changes in transcription dynamics observed on different nucleosomal templates cannot be attributed to differences in nucleosomal stabilities between the different templates.
Molecular Modeling.
Models were generated using Coot, make-na, and Pymol (36–38). The model is based on the following two structures: Protein Data Bank ID code 1AOI and 5C4X (2, 39).
Acknowledgments
We thank M. Jahnel for building and maintaining the optical tweezers instrument; A. Lisica, S. Stoynov, and M. Nishikawa for fruitful discussions and suggestions; S. Sainsbury for providing Pol II; and N. Luzzietti and R. Seidel for providing the NPS. P.C. was supported by Deutsche Forschungsgemeinschaft (DFG) Grants SFB646, SFB960, SFB1064, GRK1721, CIPSM, NIM, and QBM; the Advanced Investigator Grant TRANSIT of the European Research Council; and the Volkswagen Foundation. S.W.G. was supported by the DFG (Grants SPP 1782, GSC 97, GR 3271/2, GR 3271/3, and GR 3271/4), European Research Council Grant 281903, Innovative Training Networks (ITN) Grants 281903 and 641639 from the European Union, the Max Planck Society as a Max Planck Fellow, and Human Frontier Science Program Grant RGP0023/2014.
Footnotes
The authors declare no conflict of interest.
This article is a PNAS Direct Submission.
This article contains supporting information online at www.pnas.org/lookup/suppl/doi:10.1073/pnas.1602764113/-/DCSupplemental.
References
- 1.Elgin SC, Workman JL. Chromatin Structure and Gene Expression. Vol 35 Oxford Univ Press; Oxford, UK: 2000. [Google Scholar]
- 2.Luger K, Mäder AW, Richmond RK, Sargent DF, Richmond TJ. Crystal structure of the nucleosome core particle at 2.8 A resolution. Nature. 1997;389(6648):251–260. doi: 10.1038/38444. [DOI] [PubMed] [Google Scholar]
- 3.Bintu L, et al. Nucleosomal elements that control the topography of the barrier to transcription. Cell. 2012;151(4):738–749. doi: 10.1016/j.cell.2012.10.009. [DOI] [PMC free article] [PubMed] [Google Scholar]
- 4.Bondarenko VA, et al. Nucleosomes can form a polar barrier to transcript elongation by RNA polymerase II. Mol Cell. 2006;24(3):469–479. doi: 10.1016/j.molcel.2006.09.009. [DOI] [PubMed] [Google Scholar]
- 5.Hodges C, Bintu L, Lubkowska L, Kashlev M, Bustamante C. Nucleosomal fluctuations govern the transcription dynamics of RNA polymerase II. Science. 2009;325(5940):626–628. doi: 10.1126/science.1172926. [DOI] [PMC free article] [PubMed] [Google Scholar]
- 6.Izban MG, Luse DS. Transcription on nucleosomal templates by RNA polymerase II in vitro: Inhibition of elongation with enhancement of sequence-specific pausing. Genes Dev. 1991;5(4):683–696. doi: 10.1101/gad.5.4.683. [DOI] [PubMed] [Google Scholar]
- 7.Kireeva ML, et al. Nucleosome remodeling induced by RNA polymerase II: Loss of the H2A/H2B dimer during transcription. Mol Cell. 2002;9(3):541–552. doi: 10.1016/s1097-2765(02)00472-0. [DOI] [PubMed] [Google Scholar]
- 8.Brogaard K, Xi L, Wang JP, Widom J. A map of nucleosome positions in yeast at base-pair resolution. Nature. 2012;486(7404):496–501. doi: 10.1038/nature11142. [DOI] [PMC free article] [PubMed] [Google Scholar]
- 9.Lohr D, Van Holde KE. Organization of spacer DNA in chromatin. Proc Natl Acad Sci USA. 1979;76(12):6326–6330. doi: 10.1073/pnas.76.12.6326. [DOI] [PMC free article] [PubMed] [Google Scholar]
- 10.Lohr D. The salt dependence of chicken and yeast chromatin structure. Effects on internucleosomal organization and relation to active chromatin. J Biol Chem. 1986;261(21):9904–9914. [PubMed] [Google Scholar]
- 11.Wang JP, et al. Preferentially quantized linker DNA lengths in Saccharomyces cerevisiae. PLOS Comput Biol. 2008;4(9):e1000175. doi: 10.1371/journal.pcbi.1000175. [DOI] [PMC free article] [PubMed] [Google Scholar]
- 12.Lowary PT, Widom J. New DNA sequence rules for high affinity binding to histone octamer and sequence-directed nucleosome positioning. J Mol Biol. 1998;276(1):19–42. doi: 10.1006/jmbi.1997.1494. [DOI] [PubMed] [Google Scholar]
- 13.Dyer PN, et al. Reconstitution of nucleosome core particles from recombinant histones and DNA. Methods Enzymol. 2004;375:23–44. doi: 10.1016/s0076-6879(03)75002-2. [DOI] [PubMed] [Google Scholar]
- 14.Luger K, Rechsteiner TJ, Richmond TJ. Expression and purification of recombinant histones and nucleosome reconstitution. Methods Mol Biol. 1999;119:1–16. doi: 10.1385/1-59259-681-9:1. [DOI] [PubMed] [Google Scholar]
- 15.Sydow JF, et al. Structural basis of transcription: Mismatch-specific fidelity mechanisms and paused RNA polymerase II with frayed RNA. Mol Cell. 2009;34(6):710–721. doi: 10.1016/j.molcel.2009.06.002. [DOI] [PubMed] [Google Scholar]
- 16.Komissarova N, Kireeva ML, Becker J, Sidorenkov I, Kashlev M. Engineering of elongation complexes of bacterial and yeast RNA polymerases. Methods Enzymol. 2003;371:233–251. doi: 10.1016/S0076-6879(03)71017-9. [DOI] [PubMed] [Google Scholar]
- 17.Depken M, Galburt EA, Grill SW. The origin of short transcriptional pauses. Biophys J. 2009;96(6):2189–2193. doi: 10.1016/j.bpj.2008.12.3918. [DOI] [PMC free article] [PubMed] [Google Scholar]
- 18.Larson MH, et al. Trigger loop dynamics mediate the balance between the transcriptional fidelity and speed of RNA polymerase II. Proc Natl Acad Sci USA. 2012;109(17):6555–6560. doi: 10.1073/pnas.1200939109. [DOI] [PMC free article] [PubMed] [Google Scholar]
- 19.Dangkulwanich M, et al. Complete dissection of transcription elongation reveals slow translocation of RNA polymerase II in a linear ratchet mechanism. eLife. 2013;2:e00971. doi: 10.7554/eLife.00971. [DOI] [PMC free article] [PubMed] [Google Scholar]
- 20.Galburt EA, et al. Backtracking determines the force sensitivity of RNAP II in a factor-dependent manner. Nature. 2007;446(7137):820–823. doi: 10.1038/nature05701. [DOI] [PubMed] [Google Scholar]
- 21.Ishibashi T, et al. Transcription factors IIS and IIF enhance transcription efficiency by differentially modifying RNA polymerase pausing dynamics. Proc Natl Acad Sci USA. 2014;111(9):3419–3424. doi: 10.1073/pnas.1401611111. [DOI] [PMC free article] [PubMed] [Google Scholar]
- 22.Lisica A, et al. Mechanisms of backtrack recovery by RNA polymerases I and II. Proc Natl Acad Sci USA. 2016;113(11):2946–2951. doi: 10.1073/pnas.1517011113. [DOI] [PMC free article] [PubMed] [Google Scholar]
- 23.Kafri Y, Nelson DR. Sequence heterogeneity and the dynamics of molecular motors. J Phys Condens Matter. 2005;17(47):S3871–S3886. doi: 10.1088/0953-8984/17/47/016. [DOI] [PubMed] [Google Scholar]
- 24.Van Holde KE. Chromatin. Springer Science & Business Media; New York: 2012. [Google Scholar]
- 25.Levitt M. How many base-pairs per turn does DNA have in solution and in chromatin? Some theoretical calculations. Proc Natl Acad Sci USA. 1978;75(2):640–644. doi: 10.1073/pnas.75.2.640. [DOI] [PMC free article] [PubMed] [Google Scholar]
- 26.Wang JC. Helical repeat of DNA in solution. Proc Natl Acad Sci USA. 1979;76(1):200–203. doi: 10.1073/pnas.76.1.200. [DOI] [PMC free article] [PubMed] [Google Scholar]
- 27.Kireeva ML, Lubkowska L, Komissarova N, Kashlev M. Assays and affinity purification of biotinylated and nonbiotinylated forms of double-tagged core RNA polymerase II from Saccharomyces cerevisiae. Methods Enzymol. 2003;370:138–155. doi: 10.1016/S0076-6879(03)70012-3. [DOI] [PubMed] [Google Scholar]
- 28.Galburt EA, Grill SW, Bustamante C. Single molecule transcription elongation. Methods. 2009;48(4):323–332. doi: 10.1016/j.ymeth.2009.04.021. [DOI] [PMC free article] [PubMed] [Google Scholar]
- 29. Selvin PR, et al. (2008). In vitro and in vivo FIONA and other acronyms for watching molecular motors walk. Single-Molecule Techniques: A Laboratory Manual, eds Selvin PR , Ha T (Cold Spring Harbor Press, Cold Spring Harbor, NY), pp 37–71.
- 30.Mack AH, et al. The molecular yo-yo method: Live jump detection improves throughput of single-molecule force spectroscopy for out-of-equilibrium transitions. Rev Sci Instrum. 2013;84(8):085119. doi: 10.1063/1.4819026. [DOI] [PubMed] [Google Scholar]
- 31.Mihardja S, Spakowitz AJ, Zhang Y, Bustamante C. Effect of force on mononucleosomal dynamics. Proc Natl Acad Sci USA. 2006;103(43):15871–15876. doi: 10.1073/pnas.0607526103. [DOI] [PMC free article] [PubMed] [Google Scholar]
- 32.Marko JF, Siggia ED. Stretching DNA. Macromolecules. 1995;28(26):8759–8770. [Google Scholar]
- 33.Adelman K, et al. Single molecule analysis of RNA polymerase elongation reveals uniform kinetic behavior. Proc Natl Acad Sci USA. 2002;99(21):13538–13543. doi: 10.1073/pnas.212358999. [DOI] [PMC free article] [PubMed] [Google Scholar]
- 34.Neuman KC, Abbondanzieri EA, Landick R, Gelles J, Block SM. Ubiquitous transcriptional pausing is independent of RNA polymerase backtracking. Cell. 2003;115(4):437–447. doi: 10.1016/s0092-8674(03)00845-6. [DOI] [PubMed] [Google Scholar]
- 35.Zamft B, Bintu L, Ishibashi T, Bustamante C. Nascent RNA structure modulates the transcriptional dynamics of RNA polymerases. Proc Natl Acad Sci USA. 2012;109(23):8948–8953. doi: 10.1073/pnas.1205063109. [DOI] [PMC free article] [PubMed] [Google Scholar]
- 36.Emsley P, Lohkamp B, Scott WG, Cowtan K. Features and development of Coot. Acta Crystallogr D Biol Crystallogr. 2010;66(Pt 4):486–501. doi: 10.1107/S0907444910007493. [DOI] [PMC free article] [PubMed] [Google Scholar]
- 37.Martinez-Rucobo FW, Sainsbury S, Cheung AC, Cramer P. Architecture of the RNA polymerase-Spt4/5 complex and basis of universal transcription processivity. EMBO J. 2011;30(7):1302–1310. doi: 10.1038/emboj.2011.64. [DOI] [PMC free article] [PubMed] [Google Scholar]
- 38.Stroud J. 2004 The Make-Na Server. Available at structure.usc.edu/make-na/server.html. Accessed June, 2016. [Google Scholar]
- 39.Barnes CO, et al. Crystal structure of a transcribing RNA polymerase II complex reveals a complete transcription bubble. Mol Cell. 2015;59(2):258–269. doi: 10.1016/j.molcel.2015.06.034. [DOI] [PMC free article] [PubMed] [Google Scholar]


