Significance
Human microglia, the resident immune cells of the brain, express only the neurotensin (NT) receptor-3/sortilin. NT significantly increases microglia synthesis and release of proinflammatory cytokine IL-1β and chemokine (C-X-C motif) ligand 8 (CXCL8), chemokine (C-C motif) ligand 2 (CCL2), and CCL5 via NTR3/sortilin. A soluble form of this receptor is secreted from stimulated microglia and is increased in the serum of children with autism spectrum disorders (ASD). These responses and the NT-stimulated increases in microglia numbers are mediated via mammalian target of rapamycin (mTOR) activation and are inhibitable by the natural flavonoids luteolin and methoxyluteolin.
Keywords: autism spectrum disorders, human microglia, methoxyluteolin, mTOR, sortilin
Abstract
We had reported elevated serum levels of the peptide neurotensin (NT) in children with autism spectrum disorders (ASD). Here, we show that NT stimulates primary human microglia, the resident immune cells of the brain, and the immortalized cell line of human microglia-SV40. NT (10 nM) increases the gene expression and release (P < 0.001) of the proinflammatory cytokine IL-1β and chemokine (C-X-C motif) ligand 8 (CXCL8), chemokine (C-C motif) ligand 2 (CCL2), and CCL5 from human microglia. NT also stimulates proliferation (P < 0.05) of microglia-SV40. Microglia express only the receptor 3 (NTR3)/sortilin and not the NTR1 or NTR2. The use of siRNA to target sortilin reduces (P < 0.001) the NT-stimulated cytokine and chemokine gene expression and release from human microglia. Stimulation with NT (10 nM) increases the gene expression of sortilin (P < 0.0001) and causes the receptor to be translocated from the cytoplasm to the cell surface, and to be secreted extracellularly. Our findings also show increased levels of sortilin (P < 0.0001) in the serum from children with ASD (n = 36), compared with healthy controls (n = 20). NT stimulation of microglia-SV40 causes activation of the mammalian target of rapamycin (mTOR) signaling kinase, as shown by phosphorylation of its substrates and inhibition of these responses by drugs that prevent mTOR activation. NT-stimulated responses are inhibited by the flavonoid methoxyluteolin (0.1–1 μM). The data provide a link between sortilin and the pathological findings of microglia and inflammation of the brain in ASD. Thus, inhibition of this pathway using methoxyluteolin could provide an effective treatment of ASD.
Autism spectrum disorders (ASD) are neurodevelopmental disorders (1, 2). The prevalence of ASD is now estimated to be 1 in 45 children (3). Unfortunately, there is still no distinct pathogenesis (4) even though a number of neuropathological defects have been reported in the brains of children with infantile autism (5). Microglia, the highly plastic resident immune cells of the brain (6, 7), have been shown to be activated in the brains of patients with ASD (8–11). Microglia activation and proliferation could lead to focal inflammation of the brain and “choking” of normal synaptic connectivity (12, 13). Microglia express membrane receptors for several neuropeptides, allowing them to communicate with neurons, astrocytes (14), and mast cells (15), known to be involved in allergic and inflammatory processes (16).
Various stimuli, such as the bacterial lipopolysaccharide (LPS) (14, 17), have been shown to switch microglia into the M1 phenotype, denoted by the release of proinflammatory cytokines, interleukin (IL)-1β, IL-6, and tumor necrosis factor (TNF) (18), as well as the chemokines (C-C motif) ligand 2 (CCL2) and CCL5 (8, 19), also found to be increased in brains of deceased patients with ASD. Immune dysfunction (18, 20–22) and inflammation of the brain (23–25) are now invoked in the pathogenesis of ASD. However, the stimuli that promote these inflammatory processes in the brain are presently unknown.
Our laboratory had reported increased serum levels of the peptide neurotensin (NT), but not substance P or β-endorphin (26), in children with ASD (26, 27). NT is found in the brain (28, 29) and is primarily secreted from neurons (29) and astrocytes (30). NT responses are mediated through three receptors: NTR1 (31) and NTR2 (32, 33), which belong to the G protein-coupled seven-transmembrane receptor family (34), and NTR3, also known as sortilin (35). NTR3/sortilin is a type I sorting protein [part of the Vps10p domain single-transmembrane receptor family (31)], a multifaceted receptor mainly expressed in the CNS during embryonic development (36).
NTR3/sortilin has been shown to be expressed in murine microglia through which NT stimulates IL-1β, CCL2, and TNF gene expression (37). However, rodent microglia have major biochemical and pharmacological differences compared with primary human microglia (38). Moreover, animal models do not reflect human inflammatory processes (39). A subset (1–5%) of ASD cases has gene mutations in regulatory proteins upstream of the signaling complexes termed the “mammalian target of rapamycin” (mTOR) (4, 40). These mutations in mice lead to a behavioral phenotype resembling autism (41), and targeting the mTOR pathway has been shown to reverse autism-like behavior (42, 43). The phosphoinositide 3-kinase (PI3K)/AKT/mTOR signaling pathway also regulates the activation of both microglia (44) and mast cells (45), which may cross-talk to exacerbate inflammation of the brain (15).
There are no clinically available drugs addressing the core symptoms of ASD. The natural flavonoid luteolin has potent antioxidant and antiinflammatory properties (46). It also inhibits activation of microglia (17, 47–49). Luteolin also reverses autism-like behavior in mice (50). Two clinical studies further reported that a luteolin-containing dietary formulation significantly improved attention and sociability in children with ASD (51, 52). Its structural analog methoxyluteolin (3′,4′,5,7-tetramethoxyflavone) is a more potent mast cell inhibitor (53) and is more metabolically stable (54); hence, it is more likely to reach therapeutic levels in the brain.
Here, we extend our previous finding of elevated serum NT levels in children with ASD by investigating whether NT stimulates the activation of human microglia, the specific NT receptor involved, and pathways that can be targeted for inhibition of these processes by methoxyluteolin.
Results
NT Induces Expression of Proinflammatory Cytokines and Chemokines in Human Microglia.
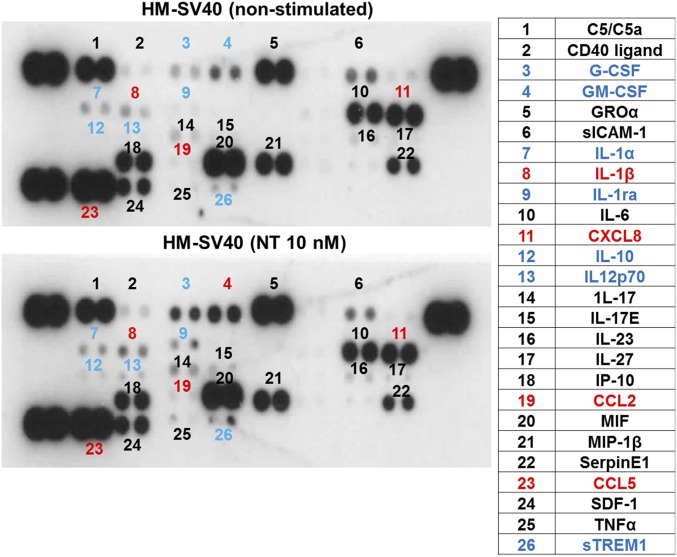
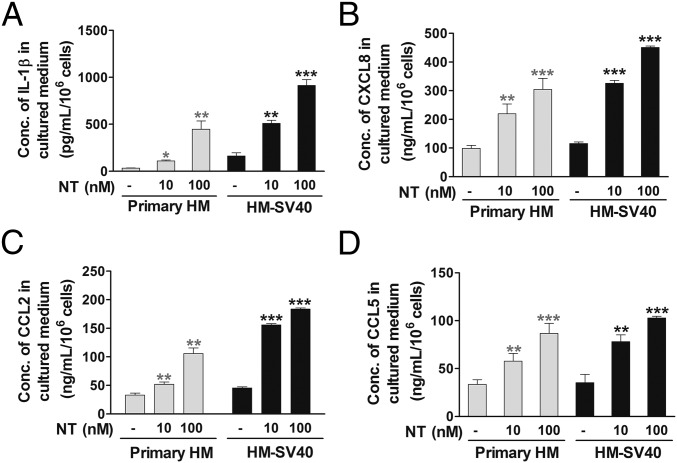
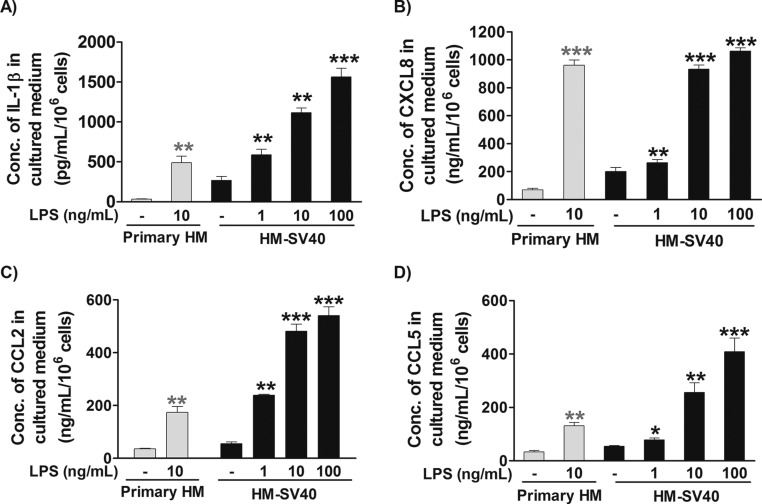
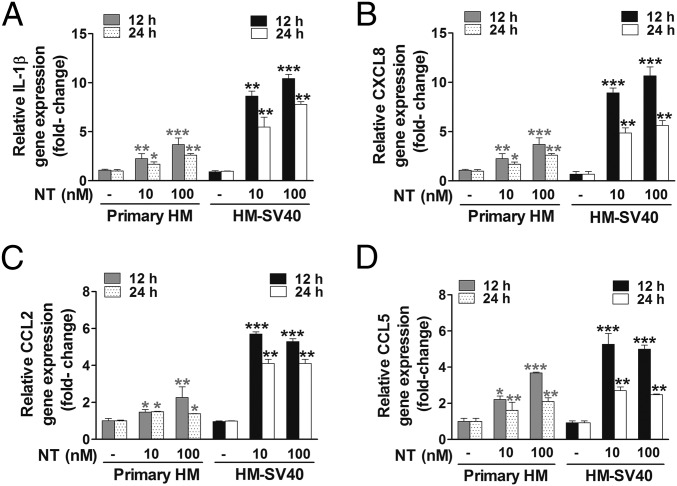
To evaluate whether NT can switch human microglia to the proinflammatory M1 phenotype, we first used a human cytokine and chemokine array blot to identify any cytokines and chemokines differentially expressed in control and NT-stimulated human microglia-SV40. NT increases expression of numerous proinflammatory cytokines and chemokines (Fig. S1), which were then measured by specific ELISAs. NT stimulation at physiological doses (10 or 100 nM) for 24 h increases secretion of the proinflammatory cytokine IL-1β and chemokine (C-X-C) motif ligand 8 (CXCL8), CCL2, and CCL5 (P < 0.001), compared with controls, from both primary human microglia and microglia-SV40 (Fig. 1 A–D). LPS (10 or 100 ng/mL) used as a positive control also increases (P < 0.0001) the secretion of all mediators, including IL-6 and TNF, from both human microglia cell types after 24-h stimulation (Fig. S2). NT stimulation (10 or 100 nM) significantly increases (P < 0.0001) the gene expression of IL-1β, CXCL8, CCL2, and CCL5 after 12 h in both primary human microglia and microglia-SV40 (Fig. 2 A–D). LPS (10 or 100 ng/mL; P < 0.0001) also increases the synthesis of these mediators from human microglia after 12-h stimulation.
Fig. S1.
Identification of proinflammatory mediators differentially expressed in control and NT-stimulated human microglia (HM)-SV40. Immortalized HM-SV40 (10 × 106 cells) were stimulated with NT (10 nM) for 24 h, and the cultured medium/supernatants were subjected to the human cytokine and chemokine array blot to probe for the release of proinflammatory mediators. Increased levels of several proinflammatory cytokines and chemokines (blue), including IL-1β, CXCL8, CCL2, and CCL5 (red), were denoted in NT-stimulated microglia after qualitative comparisons with those levels from control cells were made. All conditions were performed in a single blot as shown (n = 1).
Fig. 1.
Proinflammatory mediator release from human microglia. Primary human microglia (HM) (5 × 10⁴ cells) and immortalized HM-SV40 (5 × 10⁴ cells) were stimulated with NT (10 or 100 nM) for 24 h to measure release of IL-1β (A), CXCL8 (B), CCL2 (C), and CCL5 (D) by specific ELISAs. All conditions were performed in triplicate for each dataset and were repeated three times (n = 3). Significance of comparisons is denoted by *P < 0.05, **P < 0.001, or ***P < 0.0001. Conc., concentration.
Fig. S2.
Proinflammatory mediator release from HM stimulated by LPS. Primary HM (5 × 10⁴ cells) and immortalized HM-SV40 (5 × 10⁴ cells) were stimulated with LPS (1–100 ng/mL) for 24 h to measure release of IL-1β (A), CXCL8 (B), CCL2 (C), and CCL5 (D) by specific ELISAs. All conditions were performed in triplicate for each dataset and were repeated three times (n = 3). Significance of comparisons is denoted by *P < 0.05, **P < 0.001, or ***P < 0.0001. Conc., concentration.
Fig. 2.
Proinflammatory mediator gene expression in HM. Primary HM (2.5 × 10⁵ cells) and immortalized HM-SV40 (2.5 × 10⁵ cells) were stimulated with NT (10 or 100 nM) for 12 or 24 h to determine changes in gene expression levels of IL-1β (A), CXCL8 (B), CCL2 (C), and CCL5 (D) by qRT-PCR. All conditions were performed in triplicate for each dataset and were repeated three times (n = 3). Results were normalized against the endogenous gene, GAPDH, and are expressed relative to the mean of the gene of interest. Significance of comparisons is denoted by *P < 0.05, **P < 0.001, or ***P < 0.0001.
Human Microglia Express Only NTR3/Sortilin, Which Increases in Gene and Surface Protein Localization in Response to NT.
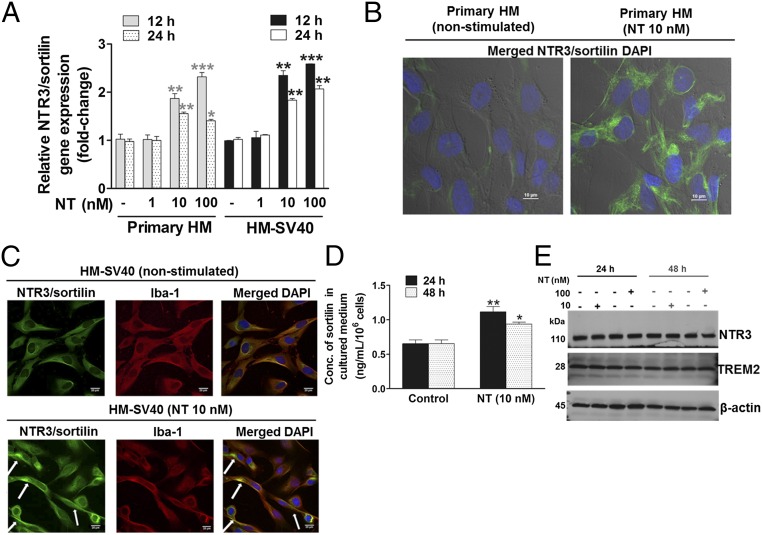
We next investigated the expression of the three types of NT receptors, NTR1, NTR2, and NTR3/sortilin, in both primary human microglia and the human microglia-SV40 cell line. The high-affinity NTR1 and low-affinity NTR2 are undetectable; however, NTR3/sortilin gene expression is detectable, and significantly increases (P < 0.001) after 12 or 24 h of NT treatment (10 or 100 nM) (Fig. 3A). Protein levels of NTR1 and NTR2 are also undetectable by Western blot analysis.
Fig. 3.
NTR3/sortilin gene expression and cellular localization in HM, and its release in response to NT. (A) Primary HM (2.5 × 10⁵ cells) and immortalized HM-SV40 were stimulated with NT for 12 or 24 h to measure gene expression levels of NTR3/sortilin in control and NT-stimulated (10 or 100 nM) microglia by qRT-PCR. All conditions were performed in triplicate for each dataset and were repeated three times (n = 3). Results were normalized against the endogenous GAPDH and expressed relative to the mean of the control for the gene of interest, with significance of comparisons denoted by *P < 0.05, **P < 0.001, or ***P < 0.0001. Microglia-SV40 (5 × 10³ cells per four-well chamber–coated slide) were stimulated with NT (10 nM) for 24 h, and then fixed and permeabilized to stain for nuclei using DAPI (blue), with specific antibodies for Alexa 488-NTR3/sortilin (green) or Alexa 594–Iba-1, a microglial marker protein (red), whereas rabbit IgG was used for the negative control. The cell surface and cytosolic distribution of NTR3/sortilin protein is shown in control and NT-stimulated primary HM (B) and immortalized HM-SV40 (C), where colocalization with Iba-1 is also apparent (white arrows). Qualitative analysis was done using images from triplicates, and representative images are shown. (D) HM-SV40 (1 × 10⁶ cells) were stimulated with NT (10 nM) for 24 or 48 h to measure release of soluble NTR3/sortilin in culture media by ELISA. All conditions were performed in triplicate for each dataset and repeated three times (n = 3). Significance of comparisons is denoted by *P < 0.05 or **P < 0.001. (E) HM-SV40 (1 × 10⁶ cells) were stimulated with NT (10 or 100 nM) for 24 or 48 h to measure total cellular NTR3/sortilin levels by Western blot analysis, where TREM-2 served as a microglial marker protein and β-actin as the loading control. All conditions were performed in triplicate for each dataset and were repeated three times (n = 3), and a representative image is shown.
To determine changes in the cellular localization of NTR3/sortilin after NT stimulation, differential interference contrast (DIC)/confocal immunofluorescence microscopy was carried out. Immunodetectable NTR3/sortilin in control primary human microglia and microglia-SV40 reveals a cytosolic distribution. Stimulation with NT (10 nM) for 24 h increases the surface-associated NTR3/sortilin in primary human microglia (Fig. 3B) and in the microglia-SV40, which appears to be colocalized with the filamentous actin-binding protein ionized calcium-binding adaptor molecule-1 (Iba-1) (Fig. 3C). We hypothesized that surface NTR3/sortilin may also be secreted extracellularly. Stimulation of human microglia-SV40 with NT (10 nM) for 24 h (P < 0.0001) or 48 h (P < 0.05) increases levels of soluble NTR3/sortilin (Fig. 3D). There is no apparent significant difference in the total cellular NTR3/sortilin levels in human microglia stimulated with NT (10 or 100 nM) after 24 or 48 h, compared with control cells (Fig. 3E).
NT Stimulates Proinflammatory Cytokine and Chemokine Release from Human Microglia via NTR3/Sortilin.
Even though human microglia do not express NTR1 and NTR2, we pretreated microglia-SV40 with the NTR1 selective nonpeptide antagonist SR48692 or the dual NTR1/NTR2 antagonist SR142948A (10–1,000 nM for 1 h), before stimulation with NT (10 or 100 nM). Pretreatment with these receptor antagonists did not affect IL-1β, CXCL8, CCL2, and CCL5 mediator release from human microglia-SV40. To determine whether NTR3/sortilin mediates the NT-stimulated proinflammatory cytokine and chemokine release, human microglia were subjected to siRNA down-regulation of NTR3/sortilin levels. Human microglia-SV40 were transfected with two different scrambled and targeted NTR3/sortilin siRNAs.
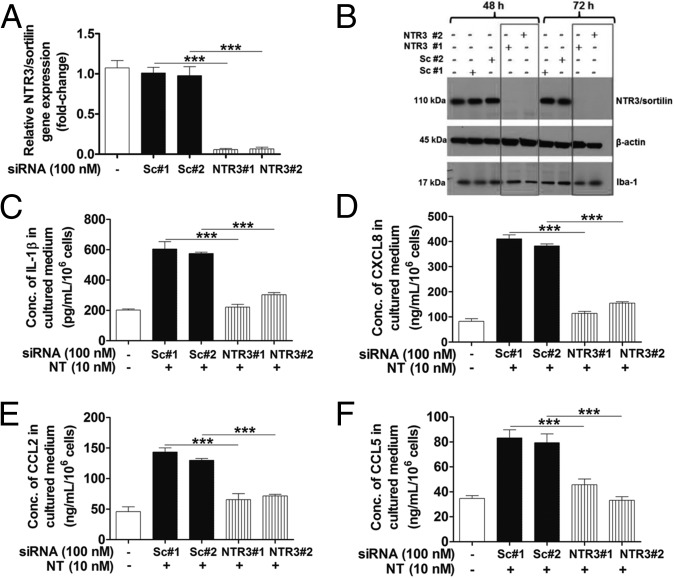
Gene expression analysis by quantitative real-time (qRT)-PCR revealed >95% knockdown of NTR3/sortilin in siRNA-transfected cells after 48 h, compared with control siRNA-transfected or unstimulated microglia (Fig. 4A). Protein levels of NTR3/sortilin in microglia-SV40 transfected with NTR3 siRNA are abolished, whereas the control cells treated with scrambled siRNA retain normal expression levels after 48 or 72 h (Fig. 4B). Stimulation by NT of microglia in which NTR3/sortilin levels were down-regulated significantly decreases (P < 0.001) IL-1β, CXCL8, CCL2, and CCL5 release, compared with control cells (Fig. 4 C–F).
Fig. 4.
NT induces proinflammatory mediator release from human microglia via NTR3/sortilin. Immortalized HM-SV40 (1 × 10⁶ cells) were transfected with two different predesigned and validated siRNAs targeting human NTR3/sortilin (NTR3#1 and NTR3#2) or scrambled controls (Sc#1 and Sc#2) for 48 and 72 h before evaluation of NTR3/sortilin gene levels by qRT-PCR (A) and protein levels by Western blot analysis (B). Control and siRNA-transfected microglia-SV40 (5 × 10⁴ cells) were stimulated with NT (10 nM) for 24 h to measure release of IL-1β (C), CXCL8 (D), CCL2 (E), and CCL5 (F) by ELISA. All conditions were performed in triplicate for each dataset and were repeated three times (n = 3). Significance of comparisons is denoted by ***P < 0.0001.
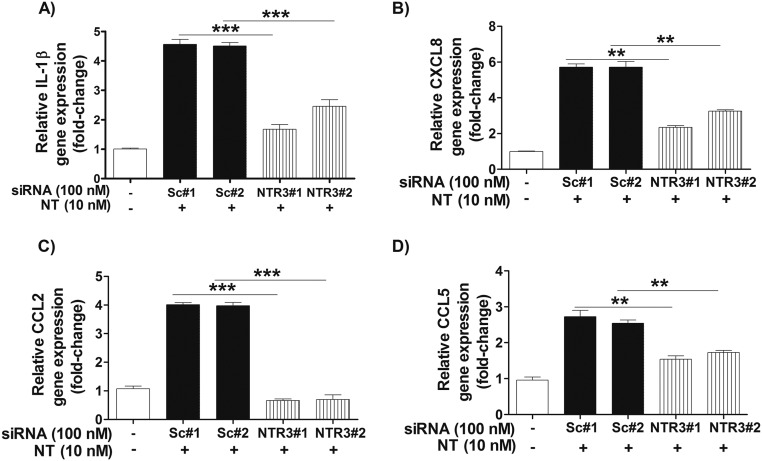
To ensure that the effect of down-regulated NTR3/sortilin was not due to any involvement in intracellular mediator transport or release, we investigated the level of proinflammatory mediator gene expression in NT-stimulated scrambled and targeted NTR3/sortilin siRNA-treated microglia SV40. Gene expression of IL-1β, CXCL8, CCL2, and CCL5 significantly decreases (P < 0.001) after NT stimulation in microglia with down-regulated NTR/sortilin levels, compared with scrambled siRNA-treated or unstimulated microglia (Fig. S3).
Fig. S3.
Proinflammatory mediator gene expression in NT-stimulated human microglia pretreated with control scrambled (Sc) and NTR3/sortilin siRNA. Control and siRNA-transfected microglia-SV40 (2 × 10⁶ cells) were stimulated with NT (10 nM) for 24 h, and the culture medium was concentrated to measure release of IL-1β (A), CXCL8 (B), CCL2 (C), and CCL5 (D) by qRT-PCR. All conditions were performed in triplicate for each dataset and were repeated three times (n = 3). Results were normalized against the endogenous GAPDH and expressed relative to the mean of the control for the gene of interest, with significance of comparisons denoted by **P < 0.001 or ***P < 0.0001.
NT Activates PI3K/mTOR Signaling in Human Microglia That Is Blocked by Luteolin and Methoxyluteolin.
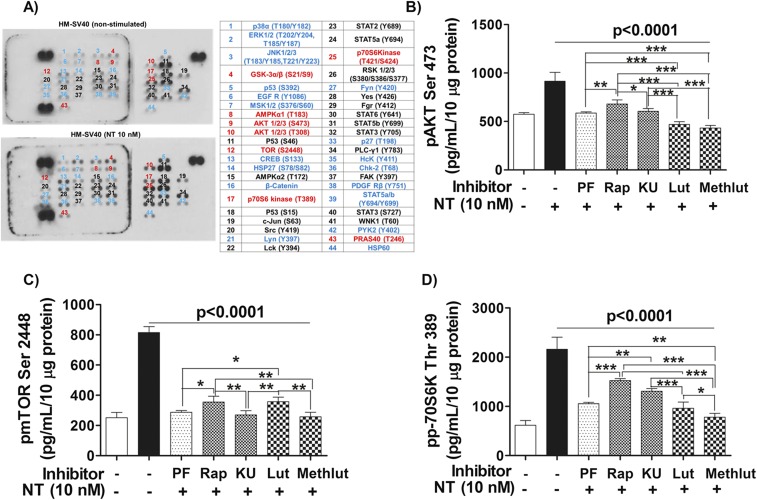
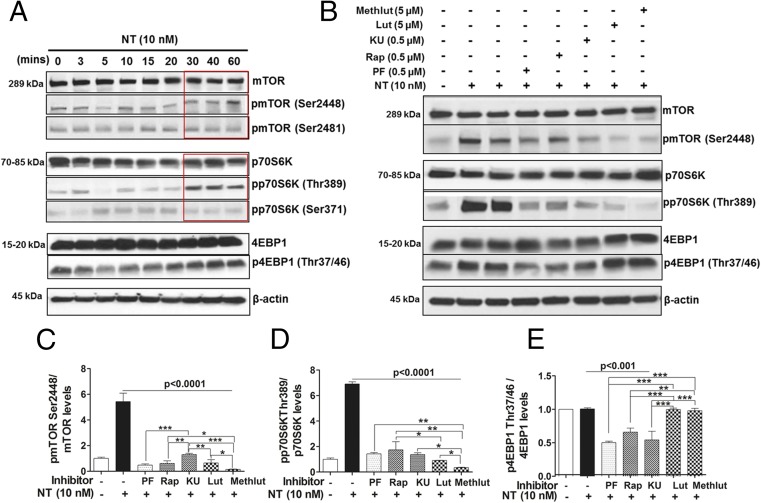
To investigate the signaling pathway involved in the stimulation of human microglia-SV40 in response to NT, a phosphoarray blot to detect the phosphorylated (p) signaling proteins was used. Protein levels of phosphorylated substrates that are up-regulated in microglia-SV40 after NT stimulation include the downstream mTOR substrates, p70 ribosomal 6 kinase (S6K) and eukaryotic initiation factor 4E-binding protein 1 (4EBP1) proteins (Fig. S4A). Western blot analysis was then performed to detect the total and p-levels of mTOR, as well as p70S6K and 4EBP1 proteins after stimulation by NT (10 nM) from 0 to 60 min. NT increases the levels of pmTOR Ser2448 and the downstream mTORC1 substrate pp70S6K Thr389 within 30 min (Fig. 5A).
Fig. S4.
NT stimulation of HM-SV40 involves activation of mTOR signaling, which is inhibited by luteolin (Lut) and methoxyluteolin (Methlut). (A) Immortalized HM-SV40 (10 × 106 cells) were serum-starved overnight and then stimulated with NT (10 nM) for 30 min before cellular lysates were harvested to probe for the phosphorylated levels of intracellular signaling kinases, as shown using a human phosphoarray blot. Increased levels of several phosphoproteins (blue), including components of the mTOR signaling pathway (red), were denoted in NT-stimulated microglia after qualitative comparisons with control cells were made. All conditions were performed in the single blot shown (n = 1). HM-SV40 (1 × 10⁶ cells) were serum-starved and pretreated with PI3K/mTOR inhibitors (0.5 μM) and the flavonoids (Lut and Methlut, 5 μM) overnight, and then stimulated with NT (10 nM) for 30 min to measure the protein levels of the mTORC2 substrate pAKTSer473 (B), pmTORSer2448 (C), and the downstream mTORC1 substrate pp70S6KThr389 (D) using specific phospho-ELISA kits. All conditions were performed in triplicate for each dataset and were repeated three times (n = 3). Significance of comparisons was determined for stimulated cells and for those cells with inhibitors/flavonoids, as denoted by the horizontal lines (P < 0.0001), and also among all of the inhibitor/flavonoid treatments shown by the horizontal brackets and by corresponding *P < 0.05, **P < 0.001, and ***P < 0.0001. Rap, rapamycin.
Fig. 5.
NT stimulates human microglia via activation of mTOR signaling, inhibited by luteolin (Lut) and methoxyluteolin (Methlut). (A) HM-SV40 (1 × 10⁶ cells) were stimulated with NT (10 nM) for 0–60 min. The total and phosphorylated levels of mTOR and mTOR substrates p70S6K (increase after 30 min of NT stimulation, red box) and 4EBP1 were analyzed by Western blot analysis, for which β-actin served as the loading control. (B) HM-SV40 were preincubated with the dual PI3K/mTOR inhibitor (PF, 0.5 μM) and the mTOR [rapamycin (Rap) or KU, 0.5 μM, 24 h] inhibitors or flavonoids (Lut and Methlut, 5 μM) in serum-free media overnight and, and then stimulated with NT (10 nM) for 30 min. The total and phosphorylated levels of mTOR and mTOR substrates were assessed by Western blot analysis. Results from densitometric analysis are presented as normalized phosphorylated-to-total protein levels of pmTORSer2448 and mTOR (C), pp70S6KThr389 and p70S6K (D), and p4EBP1Thr37/46 and 4EBP1 (E). All conditions were performed in triplicate for each dataset and were repeated three times (n = 3). Significance of comparisons was determined for stimulated cells and for those cells with inhibitors/flavonoids, as denoted by the horizontal lines (P < 0.001 or P < 0.0001), and also among each of the inhibitor/flavonoid treatments shown by the horizontal brackets and by the corresponding *P < 0.05, **P < 0.001, or ***P < 0.0001.
We next investigated whether the natural flavonoids luteolin and methoxyluteolin affect mTOR signaling by comparing their inhibitory effect with the inhibitory effect of various mTOR inhibitors in microglia stimulated by NT. We used the first-generation allosteric mTOR inhibitor, rapamycin; the small-molecule ATP-competitive kinase inhibitor of mTORC1 and mTORC2, KU-0063794 (KU); and the dual PI3K/mTOR inhibitor, PF-04691502 (PF). Human microglia-SV40 were serum-starved overnight and preincubated with rapamycin, 0.5 μM KU/PF, or luteolin and methoxyluteolin (0.1–10 µM) for 12 h before NT stimulation (30 min), which significantly decreases levels of pmTORSer2448 and p70S6KThr389 compared with those levels in microglia stimulated by NT alone (Fig. 5 B–D). NT did not increase the levels of total or p4EBP1 proteins in stimulated microglia-SV40; however, the levels p4EBP1 in unstimulated microglia decrease in the presence of mTOR inhibitors, whereas the flavonoids had no effect on these inhibitors (Fig. 5E).
Phospho-ELISAs were also performed on microglia stimulated with NT and/or pretreated with the PI3K/mTOR inhibitors or luteolin and methoxyluteolin to quantify levels of pAKT Ser473, pmTORSer2448, and pp70S6KThr389 to assess activation of mTOR. Levels of pAKT or pmTOR or p70S6K proteins (Fig. S4 B–D) in microglia pretreated with inhibitors before NT stimulation significantly decrease (P < 0.001), compared with NT stimulation. Noteworthy, methoxyluteolin (5 μM) shows greater reduction of phosphorylated levels of pmTORSer2448 and pp70S6KThr389 compared with luteolin (5 μM) or any of the mTOR inhibitors.
NT-Induced Proinflammatory Cytokine and Chemokine Expression in Human Microglia Is Dependent on mTOR Activation, Which Is Inhibited by Luteolin and Methoxyluteolin.
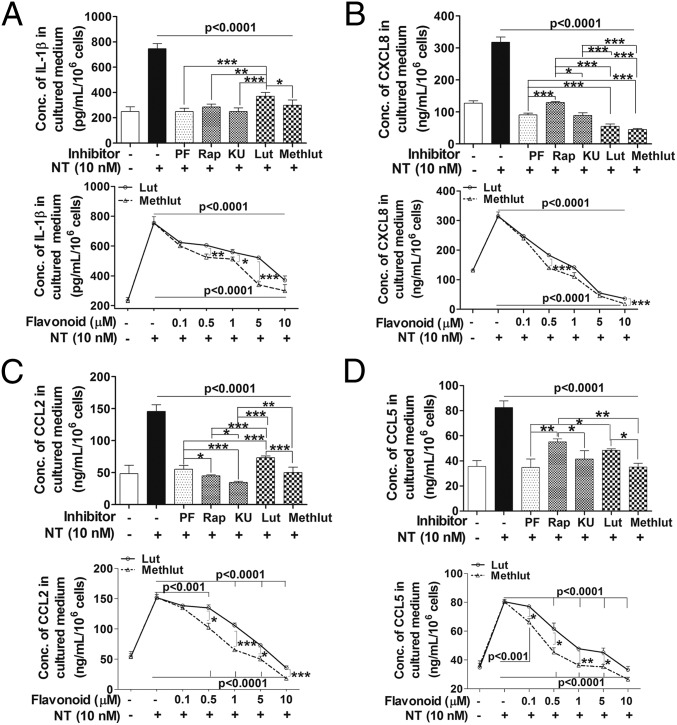
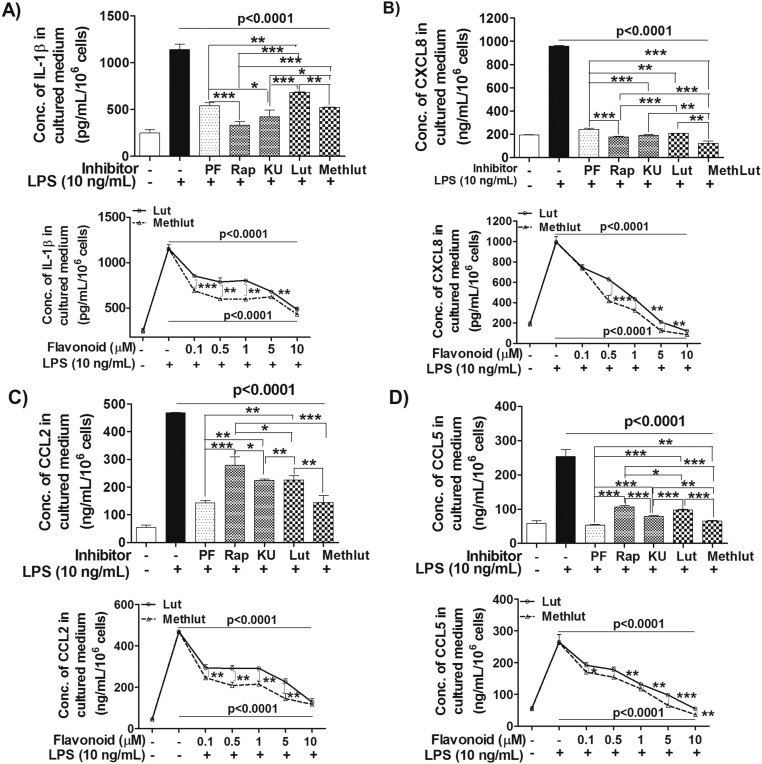
Human microglia-SV40 were serum-starved overnight, pretreated with PI3K and/or mTOR inhibitors (0.1–1 µM, 2 h) or with luteolin and methoxyluteolin (0.1–10 µM, 2 h), and then stimulated by NT (10 nM) for 24 h to measure release of cytokines and chemokines in serum-free media. The release of all proinflammatory significantly decreases (P < 0.001) after treatment with the dual PI3K/mTOR inhibitor PF or the mTOR inhibitors, rapamycin and KU, at optimal inhibitory concentrations of 0.5 µM. The flavonoids luteolin and methoxyluteolin (0.5–10 µM) also inhibit release of these mediators from NT-stimulated human microglia (Fig. 6). As a positive control, the release of proinflammatory cytokine IL-1β and the CXCL8, CCL2, and CCL5 mediators was measured in response to LPS (10 ng/mL), which also significantly decreases (P < 0.001) in the presence of PI3K and/or mTOR inhibitors, as well as luteolin or methoxyluteolin (Fig. S5). Methoxyluteolin is a more potent inhibitor than luteolin at equimolar flavonoid concentrations for the release of proinflammatory cytokine and chemokines from either NT-stimulated microglia (Fig. 6) or LPS-stimulated microglia (Fig. S5), with maximal flavonoid inhibition at 10 μM.
Fig. 6.
Microglia proinflammatory mediator release in response to NT is attenuated by the PI3K/mTOR inhibitors and the flavonoids Lut and Methlut. HM-SV40 (5 × 10⁴ cells) were pretreated with the dual PI3K/mTOR (PF, 0.1 μM) and the mTOR (Rap and KU, 0.1 μM) inhibitors or flavonoids [Lut and Methlut, 5 μM (Upper) or 0.1–10 μM (Lower)] for 2 h, and then stimulated with NT (10 nM) for 24 h in serum-free medium to measure release of IL-1β (A), CXCL8 (B), CCL2 (C), and CCL5 (D) by ELISA. All inhibitors were dissolved in water or DMSO with a final concentration <0.1%. All conditions were performed in triplicate for each dataset and were repeated three times (n = 3). Significance of comparisons was determined for stimulated cells and for those cells with inhibitors/flavonoids, as denoted by the horizontal lines (P < 0.001 or P < 0.0001), and also among each of the inhibitor/flavonoid treatments shown by the horizontal brackets and by corresponding *P < 0.05, **P < 0.001, and ***P < 0.0001.
Fig. S5.
Microglia proinflammatory mediator release in response to LPS is attenuated by the PI3K/mTOR inhibitors and the flavonoids Lut and Methlut. HM-SV40 (5 × 10⁴ cells) were pretreated with the dual PI3K/mTOR (PF, 0.5 μM) and the mTOR inhibitors (Rap and KU, 0.5 μM), as well as the flavonoids [Lut and Methlut, 5 μM (Upper) or 0.1–10 μM (Lower)] for 30 min, and then stimulated with NT (10 nM) for 24 h in serum-free media to measure release of IL-1β (A), CXCL8 (B), CCL2 (C), and CCL5 (D) by ELISA. All inhibitors were dissolved in water or DMSO with a final concentration <0.1%. All conditions were performed in triplicate for each dataset and were repeated three times (n = 3). Significance of comparisons was determined for stimulated cells and for those cells with inhibitors/flavonoids, as denoted by the horizontal lines (P < 0.0001), and also among all of the inhibitor/flavonoid treatments shown by the horizontal brackets and by corresponding *P < 0.05, **P < 0.001, and ***P < 0.0001.
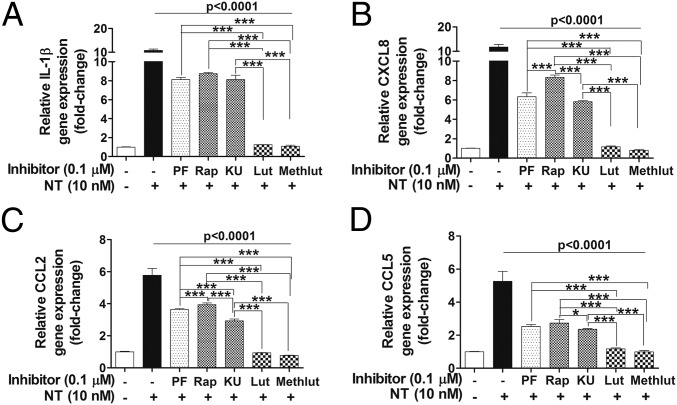
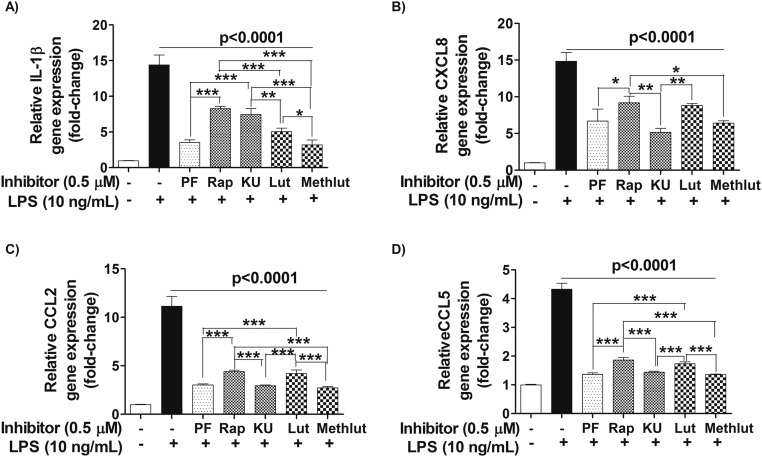
We next investigated whether mTOR signaling is involved in the production of proinflammatory cytokines and chemokines in human microglia after NT stimulation and whether luteolin and methoxyluteolin can inhibit these responses. The gene expression of IL-1β, CXCL8, CCL2, and CCL5 in microglia pretreated with PI3K and/or mTOR inhibitors (0.1–1 µM) and luteolin or methoxyluteolin (0.1–10 µM) for 2 h, before stimulation by NT (10 nM) for 12 h, was measured. Pretreatment with PI3K and/or mTOR inhibitors and luteolin or methoxyluteolin (0.1 μM) significantly decreases (P < 0.001) all cytokine and chemokine gene levels, even after stimulation by NT (Fig. 7) or LPS (Fig. S6). Methoxyluteolin and luteolin (0.1 μM) inhibit the gene expression of CXCL8, CCL2, and CCL5 more potently than the PI3K and/or mTOR inhibitors in human microglia-SV40 stimulated with NT.
Fig. 7.
Microglia proinflammatory mediator gene expression in response to NT is attenuated by the PI3K/mTOR inhibitors and the flavonoids Lut and Methlut. HM-SV40 (5 × 10⁴ cells) were pretreated with the dual PI3K/mTOR (PF, 0.1 μM) and the mTOR (Rap and KU, 0.1 μM) inhibitors or the flavonoids (Lut and Methlut, 0.1 μM) for 2 h, and then stimulated with NT (10 nM) for 12 h in serum-free media to determine changes in gene levels of IL-1β (A), CXCL8 (B), CCL2 (C), and CCL5 (D) by qRT-PCR. All inhibitors were dissolved in water or DMSO with a final concentration <0.1%. Results were normalized against the endogenous gene GAPDH and are expressed relative to the mean of the gene of interest. All conditions were performed in triplicate for each dataset and were repeated three times (n = 3). Significance of comparisons was determined for stimulated cells and for those cells with inhibitors/flavonoids denoted by the horizontal lines (P < 0.001 or P < 0.0001), and also among each of the inhibitor/flavonoid treatments shown by the horizontal brackets and by corresponding *P < 0.05 and ***P < 0.0001.
Fig. S6.
Microglia proinflammatory mediator gene expression in response to LPS is attenuated by the PI3K/mTOR inhibitors and the flavonoids Lut and Methlut. HM-SV40 (2.5 x10⁵ cells) were pretreated with the dual PI3K/mTOR (PF, 0.5 μM), the mTOR (Rap and KU, 0.1 μM) inhibitors, and the flavonoids (Lut and Methlut, 0.1 μM) for 2 h, and then stimulated with NT (10 nM) for 12 h in serum-free media to determine changes in gene levels of IL-1β (A), CXCL8 (B), CCL2 (C), and CCL5 (D) by qRT-PCR. All inhibitors were dissolved in water or DMSO with a final concentration <0.1%. All conditions were performed in triplicate for each dataset and were repeated three times (n = 3). Results were normalized against the endogenous gene GAPDH and are expressed relative to the mean of the gene of interest. Significance of comparisons was determined for stimulated cells and for those cells with inhibitors/flavonoids, as denoted by the horizontal lines (P < 0.0001), and also among all of the inhibitors/flavonoids treatments shown by the horizontal brackets and by corresponding *P < 0.05, **P < 0.001, and ***P < 0.0001.
NT Stimulated-Proliferation of Human Microglia Is Dependent on mTOR Signaling That Is Inhibited by Luteolin and Methoxyluteolin.
Cellular proliferation of human microglia-SV40 stimulated with NT (10 or 100 nM) was assessed by the 3-(4, 5-dimethylthiazol-2-yl)-2,5-diphenyltetrazolium bromide (MTT) assay after 24 or 48 h. Proliferation of microglia increases (P < 0.001) after 48-h stimulation by NT (10 nM), compared with unstimulated microglia (Fig. 8A), and not after 24 h. To evaluate the involvement of mTOR signaling in cellular proliferation, microglia-SV40 were pretreated with the PI3K and/or mTOR inhibitors or luteolin and methoxyluteolin for 2 h before stimulation by NT (10 nM). The PI3K and/or mTOR inhibitors (0.5 μM) and luteolin or methoxyluteolin (5 μM) decrease (P < 0.0001) NT-stimulated proliferation of microglia after 48 h (Fig. 8B).
Fig. 8.
NT-stimulated proliferation of human microglia depends on mTOR signaling and is inhibited by Lut and Methlut. (A) HM-SV40 (5 × 10³ cells per well for 48 h or 10 × 103 cells per well for 24 h) were stimulated with NT (10 or 100 nM) in phenol-free medium, and proliferation was measured using the MTT-based assay. Absorbance of converted dye was measured at a wavelength of 570 nm with background subtraction at 690 nm; cell proliferation was calculated with control cells set at 100%. (B) Microglia (5 × 10³ cells per well) were pretreated with the dual PI3K/mTOR (PF, 0.5 μM) and the mTOR (Rap and KU, 0.5 μM) inhibitors or the flavonoids (Lut and Methlut, 5 μM) for 2 h and then stimulated with NT (10 nM) for 48 h, and an MTT assay was performed. All conditions were done in triplicate for each dataset and were repeated three times (n = 3). Results are expressed as the percentage (%) of cell proliferation relative to the control cells, with significance of comparisons determined for control and stimulated cells, as denoted by *P < 0.05 or **P < 0.001. Multiple comparisons were also made for stimulated cells and for those cells with inhibitors/flavonoids, as denoted by the horizontal lines (P < 0.001 or P < 0.0001), and also among each of the inhibitor/flavonoid treatments shown by the horizontal brackets and by corresponding *P < 0.05 and **P < 0.001.
Increased Levels of Serum NTR3/Sortilin Is Detected in the Serum of Children with ASD.
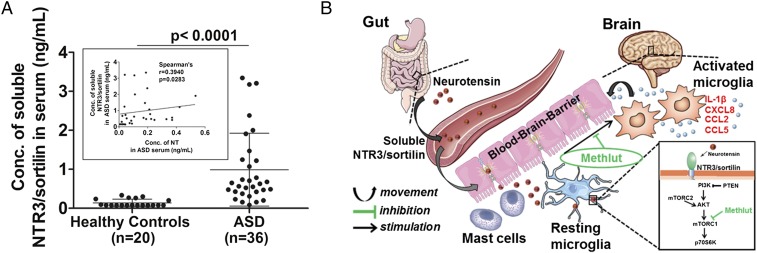
In view of the increased NT in the serum of children with ASD and the extracellular secretion of soluble NTR3/sortilin from NT-stimulated microglia, we measured soluble sortilin in the serum of children with ASD, compared with healthy controls. Increased levels (P < 0.0001) of soluble NTR3/sortilin are detected in the serum of children with ASD (mean levels of normal controls: 0.9063 ng/mL ± 0.895, n = 36), compared with age- and sex-matched healthy controls (0.1395 ng/mL ± 0.094, n = 20) (Fig. 9A). In an attempt to see if there was a correlation between serum-soluble NTR3/sortilin and circulating NT, levels of these proteins were measured in the same group of patients with ASD and controls. There is a significant positive correlation between serum NTR3/sortilin and NT levels (Spearman’s r = 0.3940, P = 0.0283) (Fig. 9A, Inset).
Fig. 9.
Increased serum NTR3/sortilin levels in ASD and the proposed scheme by which NT may contribute to inflammation of the brain. (A) Levels of soluble NTR3/sortilin and circulating NT were measured by ELISA in the serum of children with ASD, compared with age- and sex-matched healthy controls. Significance of comparisons is denoted by P < 0.0001. (Inset) Positive correlation between serum sortilin and NT levels is shown using the Spearman rank correlation test (Spearman’s r = 0.3940, P = 0.0283). (B) Diagrammatic representation of how serum NT could derive primarily from the gut and increase permeability of the intestinal lumen and the BBB by stimulating perivascular mast cells. NT in the brain could then stimulate microglia via NTR3/sortilin, which is elevated in the serum of children with ASD. Proinflammatory mediator release from microglia through activation of mTOR signaling kinase thus may contribute to inflammation of the brain and the pathogenesis of ASD. The flavonoid Methlut inhibits these processes and could be a novel treatment of ASD.
Discussion
The impetus for this present study came from our previous reports that serum NT levels are increased in children with ASD (26, 27). Unlike the previous studies that used murine microglia (55), the present findings show that NT stimulates primary microglia obtained from human brains and also an immortalized human cell line, microglia-SV40. Human microglia express only NTR3/sortilin and not the other known NT receptors, NTR1 or NTR2. NTR3/sortilin was previously shown to be expressed in the immortalized human (37, 56) and murine (55) microglia cell lines. Stimulation with NT (nM) increases gene expression and release of the proinflammatory cytokine IL-1β and chemokines CXCL8, CCL2, and CCL5, relevant to ASD. Increased levels of these mediators have been reported in the brains (8, 19) and blood (57, 58) of patients with ASD, as well as in mice with autistic-like behavior (59).
Stimulation with NT also increases proliferation of human microglia-SV40 only after 48 h, which is in agreement with the previous report that incorporation of 3H-thymidine in human microglia C13NJ in response to NT remains unchanged after 24 h (56). In addition, although the selective NTR1 antagonist SR48692 was previously shown to reduce binding of labeled NT (IC50 of 238 ± 46 nM) to this cell line (56), for our study, neither the NTR1 nor NTR2 antagonists had any effect on proinflammatory cytokine/chemokine release from NT-stimulated human microglia-SV40, implying that these NT responses are mediated via NTR3/sortilin.
The difference in the localization of immunodetectable NTR3/sortilin from the cytosol in nonstimulated microglia to the cell surface after stimulation with NT led us to wonder whether sortilin may be secreted extracellularly. The colocalization of NTR3/sortilin with Iba-1, which interacts with actin and is often used to detect microglia (60), allowed us to speculate that Iba-1 may participate in movement of NTR3/sortilin to the cell surface. The extracellular domain of NTR3/sortilin, known as soluble sortilin (61), is shown here to be secreted from NT-stimulated cultured human microglia. Soluble sortilin is also increased in the serum of children with ASD, compared with normal healthy children. Because there is a strong positive correlation of the soluble receptor with serum NT levels in these same patients with ASD, serum NTR3/sortilin may bind to serum NT and limit its biological activity much like the soluble IL-1 receptor binds to circulating IL-1β (62).
Our experiments next explored the signaling pathways involved following NT stimulation of human microglia mediated by NTR3/sortilin by the use of a kinase array blot that detects phosphorylated substrates; this array shows increased mTOR signaling, following which it was determined that activation of the mTOR pathway is necessary for proinflammatory mediator expression in NT-stimulated human microglia. These findings provide evidence why some patients with ASD who have gene mutations in one negative regulatory protein of mTOR, the phosphatase and tensin homolog (63, 64), develop inflammation of the brain that is linked to ASD pathogenesis (65, 66).
Our findings also suggest that mTOR signaling is involved in the transcriptional regulation of proinflammatory cytokine and chemokine synthesis in human microglia. This effect may be mediated via the activation of nuclear factor-kappa B (NF-ĸB) (67) and the signal transducer and activator of transcription (STAT) pathways (68), critical for transcription of proinflammatory cytokines and chemokines (69). An important finding is that the flavonoids luteolin and methoxyluteolin significantly inhibit gene expression of all the proinflammatory mediators, as well as the activation of mTOR, after stimulation by NT.
Not only did the flavonoids inhibit NT-stimulated microglial responses but they also inhibited LPS-stimulated proinflammatory cytokine and chemokine synthesis in microglia, as previously shown in murine microglia (48, 70). Greater concentrations of flavonoids are required to inhibit cytokine or chemokine protein release, compared with gene expression. This apparent discrepancy may be due to some initial secretion before gene expression is fully inhibited by the lower flavonoid concentrations. Alternatively, there may be differential inhibition of gene expression, involving the inhibition of nuclear transcription targets (NF-kB or STAT), compared with cytokine or chemokine protein secretion. Instead, mediator trafficking and secretion may involve inhibition of specific target proteins involved in vesicle fusion, such as soluble N-ethylmaleimide-sensitive factor attachment protein complexes (71, 72).
The source of the increased levels of serum NT in children with ASD is not known. The highest levels of serum NT we had measured before were present in those children with ASD who had gastrointestinal symptoms (27). NT is also found in the gut (29, 73) and increases permeability of the intestinal lumen (74). NT may enter the blood and reach the brain by stimulating perivascular mast cells (75, 76), which disrupt both the gut–blood barrier (77, 78) and the blood–brain barrier (BBB) (79–81) (Fig. 9B). Microglia-derived IL-1β, CXCL8, CCL2, and CCL5 in response to NT can augment the activation of perivascular mast cells, further disrupting the BBB (82–84), perhaps initiating a feedback mechanism. Microglia are stimulated by mast cell-derived histamine (85) and tryptase (86). Hence, communication between mast cells and microglia (15, 87), found to be activated in brains of patients with ASD (8–11, 88), is implicated in inflammation of the brain (89).
Luteolin had previously been shown to inhibit only LPS-induced IL-6 release from both primary and immortalized murine microglia (17). In vivo, luteolin reversed autism-like behavior in the maternal immune activation mouse model (50, 90, 91). Moreover, two pilot, open-label, clinical studies using a luteolin-containing dietary formulation reported significant improvement in attention and sociability in children with ASD (51, 52). Methoxyluteolin is a more potent inhibitor than luteolin or rapamycin (92) and other mTOR inhibitors (93), indicating that it could be developed into an effective treatment for ASD.
The several findings presented in this report increase our understanding of the mechanistic pathway by which the peptide NT may play an important causal role in the pathogenesis of ASD. Presently, there is no clinically effective drug to treat the pathophysiology of ASD (94). Targeting NTR3/sortilin and/or using methoxyluteolin may provide important novel therapeutic approaches for ASD.
Methods
Human Microglia Cell Culture.
The immortalized human microglia-SV40 cell line derived from primary human microglia was purchased from Applied Biological Materials, Inc. (ABM, Inc.) and cultured in Prigrow III medium supplemented with 10% (vol/vol) FBS and 1% penicillin/streptomycin in type I collagen-coated T25-flasks (ABM, Inc.). Microglia-SV40 maintained specific phenotype and proliferation rates for over 10 passages, during which all experiments were performed using multiple microglia thaws and subcultured cells. Experiments were carried out in type I collagen-coated plates or four-well chamber slides (BD PureCoat ECM Mimetic Cultureware Collagen I peptide plates; Becton Dickinson). Primary human microglia isolated from human brain tissue were purchased from ScienCell Research Laboratories and cultured in microglia medium supplemented with 5% (vol/vol) FBS, 1% penicillin/streptomycin, and 5% (vol/vol) microglia growth supplement in poly-l-lysine–coated T-25 flasks (ScienCell Research Laboratories) or Chamber Slide Lab-Tek II CC2 chamber slides (Thermo Fisher Scientific). Primary human microglia were not subcultured and were used within 7 d after cultures were initiated. Cell viability was determined by trypan blue (0.4%) exclusion.
Microglia Treatments.
Huma microglia were stimulated by NT or LPS, and/or pretreated with NTR1 selective nonpeptide antagonist SR48692 or nonselective antagonist NTR1/2 (10–1,000 nM; Sigma–Aldrich), the dual PI3K/mTOR inhibitor PF (10 nM–1,000 nM, 2 h; TOCRIS Biosciences) or the mTOR inhibitor rapamycin (10 nM–1,000 nM, 24 h) or KU (10–1,000 nM, 2 h); and the flavonoids (luteolin or methoxyluteolin, 0.1–10 µM; 2, 12, or 24 h; PharmaScience Nutrients). All inhibitors were dissolved in water or DMSO (final concentration of <0.1%). For siRNA knockdown experiments, two different predesigned and validated Silencer Select siRNAs targeting human NTR3/sortilin and control siRNAs were purchased from Life Technologies. siRNA (10–100 nM) transfection was carried out using Lipofectamine RNAiMAX in Opti-MEM reduced serum and antibiotic-free medium (Life Technologies) for 48 h before evaluation of gene knockdown qRT-PCR and protein analysis by Western blot analysis.
Detection of NT Receptor Expression.
The presence of gene expression of NTR3/sortilin was determined by quantitative real-time PCR (qRT-PCR) using specific primers and antibodies to distinguish between the three known NT receptor subtypes NTR1, NTR2, and NTR3/sortilin. Receptor gene expression of NTR1, NTR2, and NTR3/sortilin was measured by qRT-PCR using Taqman gene expression assays and validated primers (Applied Biosystems). Total RNA from control and NT-stimulated (NT full length of the active fragment residues 8–13) microglia (2.5 × 10⁵ cells per six-well type I collagen or poly-l-lysine–coated plates; Becton Dickinson) for 24 h before stimulation with NT (1–1,000 nM) or LPS (10–1,000 ng/mL) (Sigma–Aldrich) was carried out was isolated after 6, 12, or 24 h using an RNeasy Mini Kit (Qiagen) according to the manufacturer’s instructions. Reverse transcription was performed with 300 ng of total RNA using the iScript cDNA Synthesis Kit (Bio-Rad). For qRT-PCR, samples were run at 45 cycles using an Applied Biosystems 7300 Real-Time PCR System. Relative mRNA abundance was determined from standard curves run with each experiment. Gene expression was normalized to GAPDH, which was used as an endogenous control. The gene expression of receptors of NT (NTR1, NTR2, and NTR3) and the cell type-specific antigens for the microglial lineage, CD11b and CD86, were also determined.
Protein levels of NTR1, NTR2, and NTR3/sortilin were determined by Western blot analysis on cellular lysates harvested from microglia (1 × 10⁶ cells) stimulated with NT (1–100 nM) for 24 or 48 h. The membranes were probed with the following primary antibodies: NTR1 G9 (Santa Cruz Biotechnology); NTR2 (EMD Millipore Corporation); SORT1 (Sigma–Aldrich); NTR3 C20, triggering receptor expressed on myeloid cells-2 (TREM-2), and Iba-1 (Santa Cruz Biotechnology); and β-actin for the loading control (Cell Signaling Technology). All proteins were visualized with horseradish-peroxidase–conjugated secondary antibodies and then by enhanced SuperSignal West Pico chemiluminescence (Fisher Scientific).
Cellular localization studies on NTR3/sortilin in basal and NT-stimulated microglia were done using confocal microscopy. Microglia (5 × 10³ cells per four-well chamber–coated slide) were stimulated with NT (10 or 100 nM, 12 or 24 h). Cells were fixed in 4% (wt/vol) paraformaldehyde in PBS for 10 min on ice and/or permeabilized using a solution of 0.1% Triton X-100 and 0.05% saponin. Free aldehydes were quenched with 50 mM glycine/lysine in PBS. Blocking was carried out with 1% (wt/vol) BSA in PBS containing 10% (vol/vol) goat or donkey serum (EMD Millipore) for 30 min at room temperature. Cells were incubated overnight with the following monoclonal primary antibodies: NTR3/sortilin C-20, and TREM-2 (from Santa Cruz Biotechnology) at a dilution of 1:500 and CD11b/integrin αM, Iba-1, and NTR3/sortilin (from Abcam). For immunofluorescence detection, the following secondary antibodies were used: anti-rabbit IgG-FITC (Santa Cruz Biotechnology) or anti-rabbit Alexa 488 and/or anti-goat Alexa 594 (Life Technologies) at a dilution of 1:1,000 for 2 h. Nuclei were stained with DAPI or Hoechst (50 ng/mL), and slides were then mounted using ProLong Diamond Antifade Mountant (Life Technologies). Imaging was carried out using a Nikon A1R inverted confocal microscope, with an automated stage using a conventional point scanner (1,020 × 1,020 pixel field view) and equipped with a spectral detector for confocal scanning laser imaging and a transmitted-laser DIC detector (three solid-state lasers and a dual-line argon gas laser, producing excitation lines at 403, 457/476, 488/514, 560, and 640 nm), and NIS-Element Software for image analysis (Nikon Instruments, Inc.).
Protein levels of soluble NTR3/sortilin in culture medium from human microglia after stimulation by NT (10 nM) for 24 or 48 h were measured using the SORT1 ELISA (LifeSpan BioSciences, Inc.). Initially, human microglia were seeded (2 × 10⁶ cells per type I collagen-coated T25-flask) for 24 h and serum-starved for 12 h, before stimulation with NT (10 nM). After 24 or 48 h, supernatant fluids were collected (10 mL) and concentrated (100 μL) using 10-K cellulose membrane centrifugal filter units (Merck Millipore). For all experiments, the control cells were treated with an equal volume of culture medium, and the minimum detectable level for soluble NTR3/sortilin by ELISA was 0.157 ng/mL.
Proinflammatory Mediator Gene Expression.
Microglia (1 ×10⁵ cells per well) were seeded in six-well, type I collagen- or poly-l-lysine–coated plates for 24 h before stimulation with NT (1–1,000 nM) or LPS (10–1,000 ng/mL) was carried out for 12 or 24 h. Total RNA was isolated as described above, and qRT-PCR was performed using Taqman gene expression assays to assess the expression of IL-1β, CXCL8, CCL2, and CCL5 in microglia after NT stimulation for 6, 12, or 24 h. For select experiments, microglia were pretreated with PI3K/mTOR inhibitors before stimulation with NT or LPS for 12 h in serum-free media before harvesting cell lysates. For all qRT-PCR studies, the suggested best-coverage Taqman probes were selected and performed. The gene levels of IL-1β, TNF, CXCL8, CCL2, and CCL5 were measured, and expression was normalized to GAPDH endogenous control.
Proinflammatory Mediator Release.
The detection of the various cytokines/chemokines within human microglia cell-conditioned culture medium/supernatant fluid was carried out using the Human Cytokine Array Panel A (R&D Systems). Thereafter, specific mediator release in human microglia-conditioned culture medium was quantified using commercially available ELISA kits (R&D Systems) as per the manufacturer’s instructions. Microglia (0.5 × 10⁵ cells per well) were seeded in 12- or 24-well type I collagen- or poly-l-lysine–coated plates for 24 h before stimulation with NT (1–1,000 nM) or LPS (10–1,000 ng/mL) was carried out. For select experiments, microglia were pretreated with PI3K/mTOR for 30 min before stimulation with NT or LPS for 24 h in serum-free media. After 12 or 24 h, supernatant fluids were collected and IL-1, IL-6, TNF, CXCL8, CCL2, and CCL5 release was measured. For all experiments, the control cells were treated with an equal volume of culture medium, and the minimum detectable level for all mediators by ELISA was 5 pg/mL.
Assessing mTOR Activation.
The detection of the various signaling proteins within human microglia was carried out using the Human Phospho-Kinase Array (R&D Systems). The activation of mTORC1 was assessed by phosphorylation of pmTOR Ser2448 and the downstream mTORC1 substrates, pp70S6K and p4EBP1, whereas mTORC2 activation was determined by pAKT Ser473 levels, using Western blot analysis. Microglia (1 × 10⁶ cells) were seeded in 100-mm type I collagen-coated dishes for 24 h, serum-starved overnight (or pretreated with inhibitors), and then stimulated with NT (10–100 nM) for 0–60 min before cell lysates were harvested in radioimmunoprecipitation assay buffer (Sigma–Aldrich) containing Halt Protease and Phosphatase Inhibitor Mixtures (Thermo Fisher Scientific). The total protein concentration was determined by the bicinchoninic acid assay (Thermo Fisher Scientific) using BSA protein as a standard. The total cellular proteins (20 or 40 μg) were separated using 4–20% Mini-PROTEAN TGX precast gels (BioRad) under SDS denaturing conditions and electrotransferred onto PVDF membranes (EMD Millipore). Blocking was carried out with 5% (wt/vol) BSA in Tris-buffered saline containing 0.1% Tween-20. The membranes were probed with the following primary antibodies: mTOR (7C10); pmTOR Ser2448; mTORC1 substrates p70S6K, pp70SK Thr389, 4EBP1, and p4EBP1 Thr37/46; and β-actin as the loading control. All proteins were visualized with horseradish peroxidase-conjugated secondary antibodies and then by SuperSignal West Pico enhanced chemiluminescence (Thermo Fisher Scientific). In parallel experiments, using Pathscan Phospho-ELISA Kits (R&D Systems) for the detection of pAKTSer473, pmTORSer2448, and pp70S6K proteins, the levels of phosphorylated proteins were measured in microglia after the treatments described.
Microglia Proliferation.
Microglia (1 × 10⁴ cells per well for 24 h or 5 × 10³ cells per well for 48 h) were seeded in type I collagen-coated, 96- or 48-well flat-bottomed plates (Becton Dickinson) for 24 h before pretreatment with PI3K/mTOR inhibitors for 30 min and/or stimulation with NT (10–100 nM). All experiments were conducted in phenol-free PriGrow III media (ABM, Inc.). Proliferation was measured using the MTT-based in vitro toxicology assay kit (Sigma–Aldrich); according to the manufacturer’s instructions, MTT stock solution (5 mg/mL) was added to each culture being assayed to equal one-tenth of the original culture volume and incubated for 3–4 h, after which the converted dye was solubilized with acidic isopropanol (HCl, 0.04–0.1 N, in absolute isopropanol). Absorbance of converted dye was measured at a wavelength of 570 nm with background subtraction at 690 nm, and the percentage of cell proliferation was calculated as percent total with control cells as 100%.
Human Subjects.
Fasting blood was obtained from Caucasian male children (n = 36, range: 4–13 y of age), whose blood was obtained as part of their diagnostic workup at the Attikon General Hospital in Athens, Greece. Children were diagnosed with ASD based on clinical assessment and corroborated by meeting the cutoff scores on both the Diagnostic and Statistical Manual of Mental Disorders, Fifth Edition (DSM-5) symptom list and the autism diagnostic observation schedule algorithm. They were medication-free before blood draw for at least 2 wk for all psychotropic medications and 4 wk for fluoxetine or depot neuroleptics. The exclusion criteria were as follows: (i) any genetic condition linked to ASD (e.g., Rett syndrome, fragile X syndrome, tuberous sclerosis, focal epilepsy); (ii) any genetic syndrome involving the CNS, even if the link with ASD was uncertain; (iii) any neurological disorder involving pathology above the brainstem, other than uncomplicated nonfocal epilepsy; (iv) contemporaneous evidence, or unequivocal retrospective evidence, of probable neonatal brain damage; (v) clinically significant visual or auditory impairment, even after correction; (vi) any severe nutritional or psychological deprivation; (vii) cutaneous or systemic mastocytosis; (viii) history of allergies and upper airway diseases; and (ix) history of inflammatory diseases (e.g., juvenile rheumatoid arthritis, inflammatory bowel disease). Informed consent was obtained from all parents. Serum was also collected from normally developing, healthy male children (n = 20, range: 4–13 y of age) unrelated to subjects with ASD, who were seen for routine health visits at the Pediatric Department of the Social Security Administration polyclinic. Serum samples were labeled only with a code number and with the age and sex of the subjects. All ASDs and control blood samples were prepared immediately, and serum was stored at −80 °C. All samples were de-identified except for age and sex, and were considered under Exemption number 4 as per institutional review board (IRB) guidelines. This study was approved by the IRB decision 8/20–7-11 of the Attikon General Hospital and confirmed by the Tufts Medical Center IRB. Samples were then transported on dry ice to Boston for analysis. The detection of soluble NTR3/sortilin in serum was done using the human SORT1 ELISA (LifeSpan BioSciences, Inc.).
Statistical Analysis.
All conditions were performed in triplicate, and all experiments were repeated at least three times (n = 3). Results from cultured cells are presented as mean ± SD. Comparisons were made between (i) control and stimulated cells and (ii) stimulated cells with and without siRNA pretreatment using the unpaired, two-tailed, Student’s t test, with significance of comparisons denoted by the horizontal lines and by *P < 0.05, **P < 0.001, and ***P < 0.0001. Comparisons were also made between (i) all conditions with stimulated cells and with inhibitors using one-way ANOVA followed by post hoc analysis by Dunnett’s multiple comparison test, for which significance is denoted by horizontal lines and indicated values of P < 0.001 or P < 0.0001 and (ii) all of the inhibitors/flavonoids among themselves using one-way ANOVA followed by post hoc analysis by Tukey’s multiple comparison test, with those conditions for which there is significance denoted by the horizontal brackets and by the corresponding probability value (*P < 0.05, **P < 0.001, and ***P < 0.0001). Analysis of human serum samples is presented as a scattergram with symbols representing individual data points and horizontal lines representing the mean for each group. Normality of distribution was checked with the Shapiro–Wilk’s test. Comparison between the healthy control and ASD groups was performed using the Mann–Whitney U test and the Wilcoxon matched pair test. Correlations between serum sortilin and NT levels were examined using the Spearman rank correlation test. Significance of comparisons is denoted by P < 0.0001.The analysis was performed using GraphPad Prism version 5.0 software (GraphPad Software). Representative images for Western blots were scanned and analyzed using ImageJ (NIH; https://imagej.nih.gov/ij/) and confocal images were analyzed using Fiji ImageJ.
Acknowledgments
We thank Christopher Talbot (Tufts University School of Medicine) for assistance with troubleshooting experimental methodologies. We also thank Jerold Harmatz (Tufts University School of Medicine) for advice with the statistical analysis. We thank Drs. William Bachovchin, David Sanford, and Yuhong Zhou (Tufts University School of Medicine) for checking the purity of methoxyluteolin using nuclear magnetic resonance and mass spectroscopy, as well as Dr. Chia-Ling Tsai (Kainan University) for providing us with a chemically synthesized methoxyluteolin standard. This work was supported, in part, by a grant from the Jane Botsford Johnson Foundation (to T.C.T.) and a Predoctoral Fellowship from the Nancy Lurie Marks Family Foundation (to A.B.P.).
Footnotes
Conflict of interest statement: T.C.T. has been awarded, under an agreement with Tufts University, the following patents: US 9,050,275 - Methods of Screening for and Treating Autism Spectrum Disorders and Compositions for Same and US 9,176,146 - Methods of Treating Autism Spectrum Disorders and Compositions for Same. A Provisional Patent Application was also filed by Tufts University as US 62/396,546 - Compositions and Methods of Autism Treatment. T.C.T. is also the Scientific Director of Algonot, LLC (Sarasota, FL) that has developed the flavonoid-containing trademarked dietary supplement NeuroProtek, for which Tufts receives royalties. No portion of the work described in this paper was funded by Algonot.
This article contains supporting information online at www.pnas.org/lookup/suppl/doi:10.1073/pnas.1604992113/-/DCSupplemental.
References
- 1.Lai MC, Lombardo MV, Baron-Cohen S. Autism. Lancet. 2014;383(9920):896–910. doi: 10.1016/S0140-6736(13)61539-1. [DOI] [PubMed] [Google Scholar]
- 2.Volkmar FR, McPartland JC. From Kanner to DSM-5: Autism as an evolving diagnostic concept. Annu Rev Clin Psychol. 2014;10:193–212. doi: 10.1146/annurev-clinpsy-032813-153710. [DOI] [PubMed] [Google Scholar]
- 3.Zablotsky B, Black LI, Maenner MJ, Schieve LA, Blumberg SJ. Estimated prevalence of autism and other developmental disabilities following questionnaire changes in 2014 national health interview survey. Natl Health Stat Report. 2015;87:1–20. [PubMed] [Google Scholar]
- 4.Willsey AJ, State MW. Autism spectrum disorders: From genes to neurobiology. Curr Opin Neurobiol. 2015;30:92–99. doi: 10.1016/j.conb.2014.10.015. [DOI] [PMC free article] [PubMed] [Google Scholar]
- 5.Kemper TL, Bauman ML. Neuropathology of infantile autism. Mol Psychiatry. 2002;7(Suppl 2):S12–S13. doi: 10.1038/sj.mp.4001165. [DOI] [PubMed] [Google Scholar]
- 6.Paolicelli RC, et al. Synaptic pruning by microglia is necessary for normal brain development. Science. 2011;333(6048):1456–1458. doi: 10.1126/science.1202529. [DOI] [PubMed] [Google Scholar]
- 7.Shemer A, Erny D, Jung S, Prinz M. Microglia plasticity during health and disease: An immunological perspective. Trends Immunol. 2015;36(10):614–624. doi: 10.1016/j.it.2015.08.003. [DOI] [PubMed] [Google Scholar]
- 8.Vargas DL, Nascimbene C, Krishnan C, Zimmerman AW, Pardo CA. Neuroglial activation and neuroinflammation in the brain of patients with autism. Ann Neurol. 2005;57(1):67–81. doi: 10.1002/ana.20315. [DOI] [PubMed] [Google Scholar]
- 9.Morgan JT, et al. Microglial activation and increased microglial density observed in the dorsolateral prefrontal cortex in autism. Biol Psychiatry. 2010;68(4):368–376. doi: 10.1016/j.biopsych.2010.05.024. [DOI] [PubMed] [Google Scholar]
- 10.Rodriguez JI, Kern JK. Evidence of microglial activation in autism and its possible role in brain underconnectivity. Neuron Glia Biol. 2011;7(2-4):205–213. doi: 10.1017/S1740925X12000142. [DOI] [PMC free article] [PubMed] [Google Scholar]
- 11.Morgan JT, Barger N, Amaral DG, Schumann CM. Stereological study of amygdala glial populations in adolescents and adults with autism spectrum disorder. PLoS One. 2014;9(10):e110356. doi: 10.1371/journal.pone.0110356. [DOI] [PMC free article] [PubMed] [Google Scholar]
- 12.Suzuki K, et al. Microglial activation in young adults with autism spectrum disorder. JAMA Psychiatry. 2013;70(1):49–58. doi: 10.1001/jamapsychiatry.2013.272. [DOI] [PubMed] [Google Scholar]
- 13.Edmonson C, Ziats MN, Rennert OM. Altered glial marker expression in autistic post-mortem prefrontal cortex and cerebellum. Mol Autism. 2014;5(1):3. doi: 10.1186/2040-2392-5-3. [DOI] [PMC free article] [PubMed] [Google Scholar]
- 14.Pannell M, Szulzewsky F, Matyash V, Wolf SA, Kettenmann H. The subpopulation of microglia sensitive to neurotransmitters/neurohormones is modulated by stimulation with LPS, interferon-γ, and IL-4. Glia. 2014;62(5):667–679. doi: 10.1002/glia.22633. [DOI] [PubMed] [Google Scholar]
- 15.Skaper SD, Giusti P, Facci L. Microglia and mast cells: Two tracks on the road to neuroinflammation. FASEB J. 2012;26(8):3103–3117. doi: 10.1096/fj.11-197194. [DOI] [PubMed] [Google Scholar]
- 16.Theoharides TC, Valent P, Akin C. Mast cells, mastocytosis, and related disorders. N Engl J Med. 2015;373(2):163–172. doi: 10.1056/NEJMra1409760. [DOI] [PubMed] [Google Scholar]
- 17.Jang S, Kelley KW, Johnson RW. Luteolin reduces IL-6 production in microglia by inhibiting JNK phosphorylation and activation of AP-1. Proc Natl Acad Sci USA. 2008;105(21):7534–7539. doi: 10.1073/pnas.0802865105. [DOI] [PMC free article] [PubMed] [Google Scholar]
- 18.Li X, et al. Elevated immune response in the brain of autistic patients. J Neuroimmunol. 2009;207(1-2):111–116. doi: 10.1016/j.jneuroim.2008.12.002. [DOI] [PMC free article] [PubMed] [Google Scholar]
- 19.Ashwood P, et al. Elevated plasma cytokines in autism spectrum disorders provide evidence of immune dysfunction and are associated with impaired behavioral outcome. Brain Behav Immun. 2011;25(1):40–45. doi: 10.1016/j.bbi.2010.08.003. [DOI] [PMC free article] [PubMed] [Google Scholar]
- 20.Zimmerman AW, et al. Cerebrospinal fluid and serum markers of inflammation in autism. Pediatr Neurol. 2005;33(3):195–201. doi: 10.1016/j.pediatrneurol.2005.03.014. [DOI] [PubMed] [Google Scholar]
- 21.Estes ML, McAllister AK. Immune mediators in the brain and peripheral tissues in autism spectrum disorder. Nat Rev Neurosci. 2015;16(8):469–486. doi: 10.1038/nrn3978. [DOI] [PMC free article] [PubMed] [Google Scholar]
- 22.Young AM, et al. From molecules to neural morphology: Understanding neuroinflammation in autism spectrum condition. Mol Autism. 2016;7:9. doi: 10.1186/s13229-016-0068-x. [DOI] [PMC free article] [PubMed] [Google Scholar]
- 23.Hagberg H, Gressens P, Mallard C. Inflammation during fetal and neonatal life: Implications for neurologic and neuropsychiatric disease in children and adults. Ann Neurol. 2012;71(4):444–457. doi: 10.1002/ana.22620. [DOI] [PubMed] [Google Scholar]
- 24.Theoharides TC, Asadi S, Patel AB. Focal brain inflammation and autism. J Neuroinflammation. 2013;10:46. doi: 10.1186/1742-2094-10-46. [DOI] [PMC free article] [PubMed] [Google Scholar]
- 25.Theoharides TC, Stewart JM, Panagiotidou S, Melamed I. Mast cells, brain inflammation and autism. Eur J Pharmacol. 2015;778:96–102. doi: 10.1016/j.ejphar.2015.03.086. [DOI] [PubMed] [Google Scholar]
- 26.Angelidou A, et al. Neurotensin is increased in serum of young children with autistic disorder. J Neuroinflammation. 2010;7:48. doi: 10.1186/1742-2094-7-48. [DOI] [PMC free article] [PubMed] [Google Scholar]
- 27.Tsilioni I, et al. Elevated serum neurotensin and CRH levels in children with autistic spectrum disorders and tail-chasing Bull Terriers with a phenotype similar to autism. Transl Psychiatry. 2014;4:e466. doi: 10.1038/tp.2014.106. [DOI] [PMC free article] [PubMed] [Google Scholar]
- 28.Carraway R, Leeman SE. The isolation of a new hypotensive peptide, neurotensin, from bovine hypothalami. J Biol Chem. 1973;248(19):6854–6861. [PubMed] [Google Scholar]
- 29.Dobner PR, Barber DL, Villa-Komaroff L, McKiernan C. Cloning and sequence analysis of cDNA for the canine neurotensin/neuromedin N precursor. Proc Natl Acad Sci USA. 1987;84(10):3516–3520. doi: 10.1073/pnas.84.10.3516. [DOI] [PMC free article] [PubMed] [Google Scholar]
- 30.Vincent B, Vincent JP, Checler F. Neurotensin and neuromedin N undergo distinct catabolic processes in murine astrocytes and primary cultured neurons. Eur J Biochem. 1994;221(1):297–306. doi: 10.1111/j.1432-1033.1994.tb18741.x. [DOI] [PubMed] [Google Scholar]
- 31.Navarro V, et al. Pharmacological properties of the mouse neurotensin receptor 3. Maintenance of cell surface receptor during internalization of neurotensin. FEBS Lett. 2001;495(1-2):100–105. doi: 10.1016/s0014-5793(01)02367-5. [DOI] [PubMed] [Google Scholar]
- 32.Chalon P, et al. Molecular cloning of a levocabastine-sensitive neurotensin binding site. FEBS Lett. 1996;386(2-3):91–94. doi: 10.1016/0014-5793(96)00397-3. [DOI] [PubMed] [Google Scholar]
- 33.Mazella J, et al. Structure, functional expression, and cerebral localization of the levocabastine-sensitive neurotensin/neuromedin N receptor from mouse brain. J Neurosci. 1996;16(18):5613–5620. doi: 10.1523/JNEUROSCI.16-18-05613.1996. [DOI] [PMC free article] [PubMed] [Google Scholar]
- 34.Vincent JP, Mazella J, Kitabgi P. Neurotensin and neurotensin receptors. Trends Pharmacol Sci. 1999;20(7):302–309. doi: 10.1016/s0165-6147(99)01357-7. [DOI] [PubMed] [Google Scholar]
- 35.Petersen CM, et al. Molecular identification of a novel candidate sorting receptor purified from human brain by receptor-associated protein affinity chromatography. J Biol Chem. 1997;272(6):3599–3605. doi: 10.1074/jbc.272.6.3599. [DOI] [PubMed] [Google Scholar]
- 36.Hermans-Borgmeyer I, Hermey G, Nykjaer A, Schaller C. Expression of the 100-kDa neurotensin receptor sortilin during mouse embryonal development. Brain Res Mol Brain Res. 1999;65(2):216–219. doi: 10.1016/s0169-328x(99)00022-4. [DOI] [PubMed] [Google Scholar]
- 37.Martin S, Dicou E, Vincent JP, Mazella J. Neurotensin and the neurotensin receptor-3 in microglial cells. J Neurosci Res. 2005;81(3):322–326. doi: 10.1002/jnr.20477. [DOI] [PubMed] [Google Scholar]
- 38.Smith AM, Dragunow M. The human side of microglia. Trends Neurosci. 2014;37(3):125–135. doi: 10.1016/j.tins.2013.12.001. [DOI] [PubMed] [Google Scholar]
- 39.Seok J, et al. Inflammation and Host Response to Injury, Large Scale Collaborative Research Program Genomic responses in mouse models poorly mimic human inflammatory diseases. Proc Natl Acad Sci USA. 2013;110(9):3507–3512. doi: 10.1073/pnas.1222878110. [DOI] [PMC free article] [PubMed] [Google Scholar]
- 40.Lee Y. Roles of mTOR signaling in brain development. Exp Neurobiol. 2015;24(3):177–185. doi: 10.5607/en.2015.24.3.177. [DOI] [PMC free article] [PubMed] [Google Scholar]
- 41.Kwon CH, et al. Pten regulates neuronal arborization and social interaction in mice. Neuron. 2006;50(3):377–388. doi: 10.1016/j.neuron.2006.03.023. [DOI] [PMC free article] [PubMed] [Google Scholar]
- 42.Wang H, Doering LC. Reversing autism by targeting downstream mTOR signaling. Front Cell Neurosci. 2013;7:28. doi: 10.3389/fncel.2013.00028. [DOI] [PMC free article] [PubMed] [Google Scholar]
- 43.Huber KM, Klann E, Costa-Mattioli M, Zukin RS. Dysregulation of mammalian target of rapamycin signaling in mouse models of autism. J Neurosci. 2015;35(41):13836–13842. doi: 10.1523/JNEUROSCI.2656-15.2015. [DOI] [PMC free article] [PubMed] [Google Scholar]
- 44.Dello Russo C, Lisi L, Tringali G, Navarra P. Involvement of mTOR kinase in cytokine-dependent microglial activation and cell proliferation. Biochem Pharmacol. 2009;78(9):1242–1251. doi: 10.1016/j.bcp.2009.06.097. [DOI] [PubMed] [Google Scholar]
- 45.Kim MS, Kuehn HS, Metcalfe DD, Gilfillan AM. Activation and function of the mTORC1 pathway in mast cells. J Immunol. 2008;180(7):4586–4595. doi: 10.4049/jimmunol.180.7.4586. [DOI] [PMC free article] [PubMed] [Google Scholar]
- 46.Middleton E, Jr, Kandaswami C, Theoharides TC. The effects of plant flavonoids on mammalian cells: Implications for inflammation, heart disease, and cancer. Pharmacol Rev. 2000;52(4):673–751. [PubMed] [Google Scholar]
- 47.Dirscherl K, et al. Luteolin triggers global changes in the microglial transcriptome leading to a unique anti-inflammatory and neuroprotective phenotype. J Neuroinflammation. 2010;7:3. doi: 10.1186/1742-2094-7-3. [DOI] [PMC free article] [PubMed] [Google Scholar]
- 48.Kao TK, et al. Luteolin inhibits cytokine expression in endotoxin/cytokine-stimulated microglia. J Nutr Biochem. 2011;22(7):612–624. doi: 10.1016/j.jnutbio.2010.01.011. [DOI] [PubMed] [Google Scholar]
- 49.Zhu L, et al. Luteolin inhibits SH-SY5Y cell apoptosis through suppression of the nuclear transcription factor-κB, mitogen-activated protein kinase and protein kinase B pathways in lipopolysaccharide-stimulated cocultured BV2 cells. Exp Ther Med. 2014;7(5):1065–1070. doi: 10.3892/etm.2014.1564. [DOI] [PMC free article] [PubMed] [Google Scholar]
- 50.Parker-Athill E, et al. Flavonoids, a prenatal prophylaxis via targeting JAK2/STAT3 signaling to oppose IL-6/MIA associated autism. J Neuroimmunol. 2009;217(1-2):20–27. doi: 10.1016/j.jneuroim.2009.08.012. [DOI] [PMC free article] [PubMed] [Google Scholar]
- 51.Theoharides TC, Asadi S, Panagiotidou S. A case series of a luteolin formulation (NeuroProtek®) in children with autism spectrum disorders. Int J Immunopathol Pharmacol. 2012;25(2):317–323. doi: 10.1177/039463201202500201. [DOI] [PubMed] [Google Scholar]
- 52.Taliou A, Zintzaras E, Lykouras L, Francis K. An open-label pilot study of a formulation containing the anti-inflammatory flavonoid luteolin and its effects on behavior in children with autism spectrum disorders. Clin Ther. 2013;35(5):592–602. doi: 10.1016/j.clinthera.2013.04.006. [DOI] [PubMed] [Google Scholar]
- 53.Weng Z, Patel AB, Panagiotidou S, Theoharides TC. The novel flavone tetramethoxyluteolin is a potent inhibitor of human mast cells. J Allergy Clin Immunol. 2015;135(4):1044–52.e5. doi: 10.1016/j.jaci.2014.10.032. [DOI] [PMC free article] [PubMed] [Google Scholar]
- 54.Walle T. Methylation of dietary flavones greatly improves their hepatic metabolic stability and intestinal absorption. Mol Pharm. 2007;4(6):826–832. doi: 10.1021/mp700071d. [DOI] [PubMed] [Google Scholar]
- 55.Dicou E, Vincent JP, Mazella J. Neurotensin receptor-3/sortilin mediates neurotensin-induced cytokine/chemokine expression in a murine microglial cell line. J Neurosci Res. 2004;78(1):92–99. doi: 10.1002/jnr.20231. [DOI] [PubMed] [Google Scholar]
- 56.Martin S, Vincent JP, Mazella J. Involvement of the neurotensin receptor-3 in the neurotensin-induced migration of human microglia. J Neurosci. 2003;23(4):1198–1205. doi: 10.1523/JNEUROSCI.23-04-01198.2003. [DOI] [PMC free article] [PubMed] [Google Scholar]
- 57.Masi A, et al. Cytokine aberrations in autism spectrum disorder: A systematic review and meta-analysis. Mol Psychiatry. 2015;20(4):440–446. doi: 10.1038/mp.2014.59. [DOI] [PubMed] [Google Scholar]
- 58.Tsilioni I, Taliou A, Francis K, Theoharides TC. Children with autism spectrum disorders, who improved with a luteolin-containing dietary formulation, show reduced serum levels of TNF and IL-6. Transl Psychiatry. 2015;5:e647. doi: 10.1038/tp.2015.142. [DOI] [PMC free article] [PubMed] [Google Scholar]
- 59.Choi GB, et al. The maternal interleukin-17a pathway in mice promotes autism-like phenotypes in offspring. Science. 2016;351(6276):933–939. doi: 10.1126/science.aad0314. [DOI] [PMC free article] [PubMed] [Google Scholar]
- 60.Ito D, et al. Microglia-specific localisation of a novel calcium binding protein, Iba1. Brain Res Mol Brain Res. 1998;57(1):1–9. doi: 10.1016/s0169-328x(98)00040-0. [DOI] [PubMed] [Google Scholar]
- 61.Navarro V, Vincent JP, Mazella J. Shedding of the luminal domain of the neurotensin receptor-3/sortilin in the HT29 cell line. Biochem Biophys Res Commun. 2002;298(5):760–764. doi: 10.1016/s0006-291x(02)02564-0. [DOI] [PubMed] [Google Scholar]
- 62.Hannum CH, et al. Interleukin-1 receptor antagonist activity of a human interleukin-1 inhibitor. Nature. 1990;343(6256):336–340. doi: 10.1038/343336a0. [DOI] [PubMed] [Google Scholar]
- 63.Butler MG, et al. Subset of individuals with autism spectrum disorders and extreme macrocephaly associated with germline PTEN tumour suppressor gene mutations. J Med Genet. 2005;42(4):318–321. doi: 10.1136/jmg.2004.024646. [DOI] [PMC free article] [PubMed] [Google Scholar]
- 64.Varga EA, Pastore M, Prior T, Herman GE, McBride KL. The prevalence of PTEN mutations in a clinical pediatric cohort with autism spectrum disorders, developmental delay, and macrocephaly. Genet Med. 2009;11(2):111–117. doi: 10.1097/GIM.0b013e31818fd762. [DOI] [PubMed] [Google Scholar]
- 65.Costa-Mattioli M, Monteggia LM. mTOR complexes in neurodevelopmental and neuropsychiatric disorders. Nat Neurosci. 2013;16(11):1537–1543. doi: 10.1038/nn.3546. [DOI] [PubMed] [Google Scholar]
- 66.Kassai H, et al. Selective activation of mTORC1 signaling recapitulates microcephaly, tuberous sclerosis, and neurodegenerative diseases. Cell Reports. 2014;7(5):1626–1639. doi: 10.1016/j.celrep.2014.04.048. [DOI] [PubMed] [Google Scholar]
- 67.Dan HC, et al. Akt-dependent regulation of NF-kappaB is controlled by mTOR and Raptor in association with IKK. Genes Dev. 2008;22(11):1490–1500. doi: 10.1101/gad.1662308. [DOI] [PMC free article] [PubMed] [Google Scholar]
- 68.Saleiro D, Platanias LC. Intersection of mTOR and STAT signaling in immunity. Trends Immunol. 2015;36(1):21–29. doi: 10.1016/j.it.2014.10.006. [DOI] [PMC free article] [PubMed] [Google Scholar]
- 69.Weichhart T, et al. The TSC-mTOR signaling pathway regulates the innate inflammatory response. Immunity. 2008;29(4):565–577. doi: 10.1016/j.immuni.2008.08.012. [DOI] [PubMed] [Google Scholar]
- 70.Park JS, et al. Anti-inflammatory mechanisms of isoflavone metabolites in lipopolysaccharide-stimulated microglial cells. J Pharmacol Exp Ther. 2007;320(3):1237–1245. doi: 10.1124/jpet.106.114322. [DOI] [PubMed] [Google Scholar]
- 71.Yang Y, et al. Polyphenols differentially inhibit degranulation of distinct subsets of vesicles in mast cells by specific interaction with granule-type-dependent SNARE complexes. Biochem J. 2013;450(3):537–546. doi: 10.1042/BJ20121256. [DOI] [PMC free article] [PubMed] [Google Scholar]
- 72.Yang Y, et al. Dynamic light scattering analysis of SNARE-driven membrane fusion and the effects of SNARE-binding flavonoids. Biochem Biophys Res Commun. 2015;465(4):864–870. doi: 10.1016/j.bbrc.2015.08.111. [DOI] [PubMed] [Google Scholar]
- 73.Carraway RE, Mitra SP, Evers BM, Townsend CM., Jr BON cells display the intestinal pattern of neurotensin/neuromedin N precursor processing. Regul Pept. 1994;53(1):17–29. doi: 10.1016/0167-0115(94)90155-4. [DOI] [PubMed] [Google Scholar]
- 74.Castagliuolo I, et al. Neurotensin is a proinflammatory neuropeptide in colonic inflammation. J Clin Invest. 1999;103(6):843–849. doi: 10.1172/JCI4217. [DOI] [PMC free article] [PubMed] [Google Scholar]
- 75.Miller LA, Cochrane DE, Carraway RE, Feldberg RS. Blockade of mast cell histamine secretion in response to neurotensin by SR 48692, a nonpeptide antagonist of the neurotensin brain receptor. Br J Pharmacol. 1995;114(7):1466–1470. doi: 10.1111/j.1476-5381.1995.tb13371.x. [DOI] [PMC free article] [PubMed] [Google Scholar]
- 76.Donelan J, et al. Corticotropin-releasing hormone induces skin vascular permeability through a neurotensin-dependent process. Proc Natl Acad Sci USA. 2006;103(20):7759–7764. doi: 10.1073/pnas.0602210103. [DOI] [PMC free article] [PubMed] [Google Scholar]
- 77.Wallon C, et al. Corticotropin-releasing hormone (CRH) regulates macromolecular permeability via mast cells in normal human colonic biopsies in vitro. Gut. 2008;57(1):50–58. doi: 10.1136/gut.2006.117549. [DOI] [PubMed] [Google Scholar]
- 78.Theoharides TC, Doyle R. Autism, gut-blood-brain barrier, and mast cells. J Clin Psychopharmacol. 2008;28(5):479–483. doi: 10.1097/JCP.0b013e3181845f48. [DOI] [PubMed] [Google Scholar]
- 79.Theoharides TC. Mast cells: The immune gate to the brain. Life Sci. 1990;46(9):607–617. doi: 10.1016/0024-3205(90)90129-f. [DOI] [PubMed] [Google Scholar]
- 80.Esposito P, et al. Corticotropin-releasing hormone and brain mast cells regulate blood-brain-barrier permeability induced by acute stress. J Pharmacol Exp Ther. 2002;303(3):1061–1066. doi: 10.1124/jpet.102.038497. [DOI] [PubMed] [Google Scholar]
- 81.Ribatti D. The crucial role of mast cells in blood-brain barrier alterations. Exp Cell Res. 2015;338(1):119–125. doi: 10.1016/j.yexcr.2015.05.013. [DOI] [PubMed] [Google Scholar]
- 82.Theoharides TC, Weinkauf C, Conti P. Brain cytokines and neuropsychiatric disorders. J Clin Psychopharmacol. 2004;24(6):577–581. doi: 10.1097/01.jcp.0000148026.86483.4f. [DOI] [PubMed] [Google Scholar]
- 83.Takeshita Y, Ransohoff RM. Inflammatory cell trafficking across the blood-brain barrier: Chemokine regulation and in vitro models. Immunol Rev. 2012;248(1):228–239. doi: 10.1111/j.1600-065X.2012.01127.x. [DOI] [PMC free article] [PubMed] [Google Scholar]
- 84.Rochfort KD, Cummins PM. The blood-brain barrier endothelium: A target for pro-inflammatory cytokines. Biochem Soc Trans. 2015;43(4):702–706. doi: 10.1042/BST20140319. [DOI] [PubMed] [Google Scholar]
- 85.Dong H, et al. Histamine induces upregulated expression of histamine receptors and increases release of inflammatory mediators from microglia. Mol Neurobiol. 2014;49(3):1487–1500. doi: 10.1007/s12035-014-8697-6. [DOI] [PubMed] [Google Scholar]
- 86.Zhang S, Zeng X, Yang H, Hu G, He S. Mast cell tryptase induces microglia activation via protease-activated receptor 2 signaling. Cell Physiol Biochem. 2012;29(5-6):931–940. doi: 10.1159/000171029. [DOI] [PubMed] [Google Scholar]
- 87.Skaper SD, Facci L, Giusti P. Mast cells, glia and neuroinflammation: Partners in crime? Immunology. 2014;141(3):314–327. doi: 10.1111/imm.12170. [DOI] [PMC free article] [PubMed] [Google Scholar]
- 88.Gupta S, et al. Transcriptome analysis reveals dysregulation of innate immune response genes and neuronal activity-dependent genes in autism. Nat Commun. 2014;5:5748. doi: 10.1038/ncomms6748. [DOI] [PMC free article] [PubMed] [Google Scholar]
- 89.Theoharides TC, Tsilioni I, Patel AB, Doyle R. Atopic diseases and inflammation of the brain in the pathogenesis of autism spectrum disorders. Transl Psychiatry. 2016;6(6):e844. doi: 10.1038/tp.2016.77. [DOI] [PMC free article] [PubMed] [Google Scholar]
- 90.Hsiao EY, McBride SW, Chow J, Mazmanian SK, Patterson PH. Modeling an autism risk factor in mice leads to permanent immune dysregulation. Proc Natl Acad Sci USA. 2012;109(31):12776–12781. doi: 10.1073/pnas.1202556109. [DOI] [PMC free article] [PubMed] [Google Scholar]
- 91.Garay PA, Hsiao EY, Patterson PH, McAllister AK. Maternal immune activation causes age- and region-specific changes in brain cytokines in offspring throughout development. Brain Behav Immun. 2013;31:54–68. doi: 10.1016/j.bbi.2012.07.008. [DOI] [PMC free article] [PubMed] [Google Scholar]
- 92.Li J, Kim SG, Blenis J. Rapamycin: One drug, many effects. Cell Metab. 2014;19(3):373–379. doi: 10.1016/j.cmet.2014.01.001. [DOI] [PMC free article] [PubMed] [Google Scholar]
- 93.Wander SA, Hennessy BT, Slingerland JM. Next-generation mTOR inhibitors in clinical oncology: How pathway complexity informs therapeutic strategy. J Clin Invest. 2011;121(4):1231–1241. doi: 10.1172/JCI44145. [DOI] [PMC free article] [PubMed] [Google Scholar]
- 94.Ghosh A, Michalon A, Lindemann L, Fontoura P, Santarelli L. Drug discovery for autism spectrum disorder: challenges and opportunities. Nat Rev Drug Discov. 2013;12(10):777–790. doi: 10.1038/nrd4102. [DOI] [PubMed] [Google Scholar]


