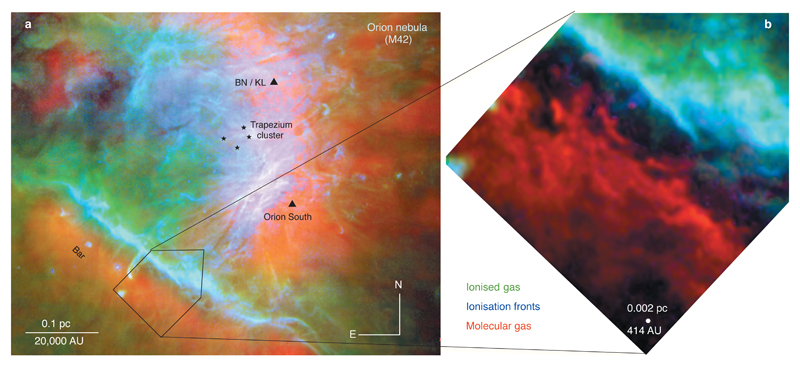
Figure 1. Multi-phase view of the Orion nebula and molecular cloud.
a, Overlay of the HCO+ J=3-2 emission (red) tracing the Orion molecular cloud. The hot ionised gas surrounding the Trapezium stars is shown by the [SII]6731Å emission (green). The interfaces between the ionised and the neutral gas, the ionisation fronts, are traced by the [OI]6300Å emission (blue), both lines imaged with VLT/MUSE15. The size of the image is ~5.8’x4.6’. b, Blow-up of the Bar region imaged with ALMA in the HCO+ J=4-3 emission (red). The black-shaded region is the atomic layer.

