

Abstract
The pharmacokinetics (PK) and pharmacodynamics (PD) of omarigliptin, a novel once‐weekly DPP‐4 inhibitor, were assessed following single and multiple doses in healthy subjects. Absorption was rapid, and food did not influence single‐dose PK. Accumulation was minimal, and steady state was reached after 2 to 3 weeks. Weekly (area under the curve) AUC and Cmax displayed dose proportionality within the dose range studied at steady state. The average renal clearance of omarigliptin was ∼2 L/h. DPP‐4 inhibition ranged from ∼77% to 89% at 168 hours following the last of 3 once‐weekly doses over the dose range studied. Omarigliptin resulted in ∼2‐fold increases in weighted average postprandial active GLP‐1. Omarigliptin acts by stabilizing active GLP‐1, which is consistent with its mechanism of action as a DPP‐4 inhibitor. Administration of omarigliptin was generally well tolerated in healthy subjects, and both the PK and PD profiles support once‐weekly dosing. A model‐based assessment of QTc interval risk from the single ascending dose study predicted a low risk of QTc prolongation within the likely clinical dose range, a finding later confirmed in a thorough QT trial.
Keywords: DPP‐4 activity, omarigliptin, once‐weekly, pharmacokinetics, type 2 diabetes mellitus
Type 2 diabetes mellitus (T2DM) is a chronic, progressive disease that affects more than 380 million people worldwide, including nearly 26 million people in the United States alone.1 Despite the availability of several new antihyperglycemic agents (AHA), many treated patients still fail to achieve optimal glycemic control. One reason for the high proportion of treated patients with T2DM not meeting glycemic goals is poor medication adherence.2 An increasing number of studies have demonstrated that adherence to AHAs is related to the number of dosage units prescribed; that is, adherence falls when the number of concomitant drugs increases with reported reductions of up to ∼54%.3 One study conducted in patients with T2DM revealed a mean adherence of 79% for a once‐daily regimen, 65% for a twice‐daily regimen, and 38% for a thrice‐daily regimen.4 Patients initiating once‐weekly exenatide, a glucagon‐like peptide‐1 receptor (GLP‐1) agonist, had significantly higher adjusted odds of adherence compared with patients initiating other more frequent dosing regimens of similar agents, namely twice‐daily exenatide or once‐daily liraglutide.5 Thus, weekly dosing of an efficacious, well‐tolerated, safe, orally administered AHA agent that reduces pill burden has the potential to increase treatment adherence,4 which in turn may improve long‐term outcomes.
Dipeptidyl peptidase‐4 (DPP‐4) inhibitors are a class of oral AHA approved for the management of patients with T2DM. DPP‐4 inhibitors have been shown to be generally well tolerated, with a low risk of hypoglycemia and neutral weight gain, and have anticipated long‐term beneficial effects on β‐cell function and mass.6, 7, 8 To date, several DPP‐4 inhibitors have been approved for the treatment of T2DM as twice‐daily or once‐daily regimens;9, 10 however, a once‐weekly DPP‐4 inhibitor is not yet available.
Omarigliptin is a novel once‐weekly DPP‐4 inhibitor.11 It has been shown to be a competitive, reversible inhibitor of DPP‐4 (IC50 = 1.6 nM, Ki = 0.8 nM) and is more potent than sitagliptin (IC50 = 18 nM). The preclinical PK of omarigliptin in rats and dogs was characterized by nearly complete bioavailability, a low plasma clearance (0.9‐1.1 mL min‐1 kg‐1), a volume of distribution at steady state of 0.8 to 1.3 L/kg, and a long terminal half‐life (∼11 to 22 hours). Omarigliptin‐mediated plasma DPP‐4 inhibition and plasma drug concentrations were dose dependent. Administration of omarigliptin dose‐dependently increased plasma concentrations of active GLP‐1 (GLP‐17‐36 amide and GLP‐17‐37), with maximal increases in active GLP‐1 observed at the 0.3 to 1 mg/kg doses.11 Omarigliptin is currently approved in Japan.
The studies reported here represent the first introduction of omarigliptin to humans, with the objectives being to evaluate the PK, PD, and tolerability of single (0.5 to 400 mg) and multiple, once‐weekly, oral doses (10 to 100 mg) of omarigliptin in healthy normoglycemic male subjects. In addition to the pharmacokinetic and DPP‐4 inhibition results presented, a model‐based assessment of QTc prolongation risk utilizing QT data obtained from the single ascending dose data is presented. Such a model‐based QTc approach could facilitate an early assessment of the potential effects of omarigliptin on QTc and offer an accelerated evaluation in lieu of the more resource‐intensive thorough QT trials that are often conducted late in development. The rich sampling feature of a first‐in‐humans (FIH) trial offers intensive cardiac telemetry monitoring in addition to extensive pharmacokinetic sampling that can be effectively leveraged to provide this risk assessment.13
Methods
The study protocols were conducted in accordance with the guidelines on good clinical practice (GCP) and with ethical standards for human experimentation established by the Declaration of Helsinki. The study protocols were approved by the Ethics Review Committees for the individual study centers. Each subject provided written informed consent prior to the conduct of any study procedures.
Subjects
A total of 56 healthy male volunteers were enrolled into 2 separate study protocols (n = 24 and n = 32 in study 1 and study 2, respectively). In both studies, all subjects were healthy, nonobese (body mass index, 18 to 30 kg/m2), nonsmokers with an age range of 19 to 45 years, weighed within 15% of the ideal height/weight range with a body weight in the range of 59 to 106 kg, had a creatinine clearance of at least 80 mL/min, and were normoglycemic. Subjects were in good general health according to routine medical histories, physical examinations, vital signs, and electrocardiogram (ECG) and laboratory data. Subjects were excluded if they had any relevant history of renal, hepatic, cardiovascular, gastrointestinal, or neurologic disease or had diabetes or impaired glucose tolerance. Subjects also were excluded if they had donated blood, participated in another clinical study within 4 weeks before study start, or anticipated needing any prescription or nonprescription drugs.
Study Design
Two double‐blind, randomized, placebo‐controlled studies were conducted to assess the pharmacokinetics, pharmacodynamics, and tolerability of omarigliptin, 1 after single rising doses (study 1) and another after multiple rising doses (study 2). Both studies were conducted at a single site. Study 1 was conducted at SGS Life Science Services, Antwerpen, Belgium, and study 2 was conducted at Center for Clinical Pharmacology, Leuven, Belgium.
Subjects reported to the study unit on the evening before study drug administration and remained in the clinical research unit for up to 48 hours after dosing. Each dose was administered after an overnight fast with the exception of the 1 panel enrolled to investigate the effect of a high‐fat meal on the pharmacokinetics of omarigliptin (study 1).
Study 1 was a multiple‐period, alternating‐panel, rising single oral dose study. Two panels (panels A and B) of subjects alternately received single rising oral doses of omarigliptin ranging from 0.5 to 400 mg (n = 6 per panel) or matching placebo (n = 2 per panel) in up to 5 treatment periods. At least 2 days elapsed before administration of the next higher dose in the alternate panel. In a third panel (panel C), 8 subjects received study drug as single oral doses (n = 6 had 10 mg omarigliptin, and n = 2 placebo) in a 2‐period, fixed‐sequence design, with study drug administered in the fasted state in period 1 and after consumption of a standard high‐fat breakfast in period 2 (ie, total fat, 55.6 g; total carbohydrates, 55 g; total protein, 31.1 g; with the distribution of total calories of 500.4 calories in fat, 220 calories in carbohydrates, and 124.4 calories in protein). There was a minimum of a 2‐week washout between the administration of study drug within each treatment panel for all treatment periods.
Study 2 was a serial‐panel, rising‐multiple‐dose study in which 4 serial panels (10 mg in panel A, 25 mg in panel B, 50 mg in panel C, and 100 mg in panel D) of subjects received oral doses of omarigliptin (n = 6) or placebo (n = 2) once weekly for 3 weeks (culminating in a total of 3 doses, 1 dose on days 1, 8, and 15).
Pharmacokinetics
Blood and urine samples for the determination of plasma and urine omarigliptin concentrations were collected from each subject at predose and at specified time points following administration of omarigliptin or placebo. Blood samples were collected in prechilled dipotassium ethyldiaminetetraacetic acid (K2EDTA)‐containing tubes and were centrifuged between 1000g and 1300g RCF at 4ºC to 10ºC for 10 minutes and stored at –20ºC until analysis. For urine samples, the subject was instructed to void directly into a preweighed collection bottle, and urine was stored at –20°C until analysis.
Plasma and urine samples for omarigliptin were analyzed using a validated assay utilizing liquid chromatography and tandem mass spectrometric (LC/MS/MS) detection with a turbo ionspray interface. The lower limit of quantitation (LLOQ) for the plasma assay was 1.0 ng/mL, and the analytical range was 1.0 to 1000 ng/mL. The sample preparation utilized liquid‐liquid extraction of omarigliptin and stable isotope–labeled internal standard in the 96‐well format. The LLOQ for the urine assay was 40.0 ng/mL with an analytical range of 40.0 to 40,000 ng/mL. Urine samples fortified with 0.2% Tween 20 were processed using protein precipitation in the 96‐well format.
Plasma pharmacokinetic parameters for omarigliptin were calculated from individual plasma concentration‐time curves and actual sampling times, including AUC0‐∞ (for study 1 only), AUC0‐168h, AUC0‐last, Cmax, C168h, Tmax, and t½. Urine pharmacokinetic parameters included the cumulative amount of unchanged drug excreted in urine (Ae) determined by the sum of the product of urine concentration and the urine volume per collection interval; the fraction of omarigliptin dose that was excreted unchanged in urine over the collection interval (fe) was calculated as the ratio of Ae0‐48h and dose; and the renal clearance (CLr) calculated by the ratio of Ae and AUC0‐48h.
Pharmacodynamics
DPP‐4 Activity and PK‐PD Analysis
Blood samples for the determination of plasma DPP‐4 activity were collected at predose and at specified time points following administration of omarigliptin or placebo. The pharmacodynamic effect of omarigliptin on DPP‐4 activity was evaluated by the percentage inhibition of plasma DPP‐4 activity (baseline‐adjusted) over 168 hours after a single dose and after the first and last doses in the multiple‐dose study. Blood samples (2 mL) were collected into EDTA spray‐dried vacutainer tubes and were processed for the analysis of DPP‐4 plasma activity. The samples were centrifuged at 1700g (∼3000 RPM) for 10 minutes at 4°C and stored at –20°C or below until bioanalytical analysis. Enzymatic activity of DPP‐4 was determined by incubating EDTA plasma with the substrate glycyl‐prolylparanitraniline and measuring the release of peptide nucleic acid by an increase in absorbance at 390 nm from 4 to 14 minutes. The assay's limit of quantitation was 0.6 mOD/min.
DPP‐4 inhibition was calculated as the percentage change from predose baseline. In the single ascending dose study, the period 1 predose was used as baseline for all subsequent periods in the calculation of DPP‐4 inhibition. For the multiple‐dose study, the baseline was defined as the predose value on day 1. Concentration and DPP‐4 inhibition data were analyzed using a population‐based 3‐parameter Emax model in SAS version 9.3 (SAS Institute, Cary, North Carolina) with parameters Emax, IC50, and Hill slope γ.
Active and Total GLP‐1
Blood samples were obtained for active and total plasma GLP‐1 measurements predose and at specified time points following administration of omarigliptin or placebo. The 4‐hour sample was obtained prior to administration of the standardized meal. The pharmacodynamic effect of single and multiple doses of omarigliptin on the weighted average augmentation (WAA) of active and total plasma GLP‐1 levels following the administration of a standard meal and following an overnight fast was assessed. Total and active GLP‐1 samples were collected into specialized 3‐mL BDTM P700 tubes at each time point. These tubes contained spray‐dried K2EDTA and proprietary additives to inhibit protein degradation. The samples were centrifuged at 1100g to 1300g for 15 minutes at 4ºC, immediately frozen, and stored between –70ºC and –80ºC until analysis. Plasma samples collected for total and active GLP‐1 were analyzed by Pacific Biometrics, Inc (PBI) (Seattle, Washington). Meso Scale Discovery MULTI‐ARRAY® kits were used to quantify the active and total forms of GLP‐1 in human plasma by electrochemiluminescent immunoassays. The active GLP‐1 assay measures the active forms of GLP‐1 (GLP‐17‐36 amide and GLP‐17‐37 amide), utilizing a capture antibody specific to the seventh amino acid of the GLP‐1 peptide, which is immobilized in the wells of the MSD MULTI‐ARRAY® microplate, and detection antibodies specific to the C‐terminal 36th and 37th amino acids. The total assay measures all GLP‐1 forms, utilizing a capture antibody that binds to the middle region of GLP‐1 immobilized in the wells of the MSD MULTI‐ARRAY® microplate. Antibodies specific to the C‐terminal 36th and 37th amino acids are used for detection.
ECG Analysis and PK/QTc Relationships
Proarrhythmic risk associated with QT interval prolongation and torsades de pointes is an important issue in new drug development. Traditionally, ICH E14 requires the conduct of a thorough QT study for a new drug application.12 To assess whether the first‐in‐human (FIH) study was conducive to an early assessment of QTc interval risk, enhanced ECG collection was performed in the single‐dose study. Such an assessment provides valuable information in the context of a FIH study given the wide range of doses and exposures that are feasible, pairing of ECGs with PK sampling, as well as valuable within‐subject data due to the alternating panel design.13
Robust sampling of drug concentrations and ECG parameters, as assessed by both 5‐lead cardiac telemetry and 12‐lead ECGs, were integrated into study 1. Time‐matched omarigliptin plasma concentrations (independent variable) and averages of triplicate QTcF measurements at each time point (dependent variable) were used to develop a linear mixed‐effects model with slope and intercept parameters. Inferential statistics testing the difference of the slope relative to zero was used to assess if there was a relationship between QTcF interval and PK.
Statistical Analysis
The pharmacokinetic parameters of omarigliptin (AUC and Cmax) were analyzed by use of a mixed‐effect ANOVA model appropriate for an alternating‐panel (study 1) or serial‐panel (study 2) rising‐dose design. The effects of a standardized breakfast on log‐transformed AUC0‐∞ and Cmax values for a single omarigliptin dose were also assessed by use of an ANOVA model. The pharmacokinetic parameters AUC0‐168h, Cmax, and C168h following once‐weekly (QW) single oral dose (study 1) and multiple oral dose (study 2) administration of omarigliptin were natural log‐transformed and analyzed using a linear mixed‐effects model containing treatment (studies 1 and 2), day, and treatment‐by‐day interaction (study 2) as fixed effects and subject as a random effect. In the multiple‐dose protocol, the accumulation of omarigliptin was assessed through the construction of a 90%CI for the geometric mean ratio (day 15/day 1) of AUC0‐168h, Cmax, and Ctrough. The PD effect of omarigliptin, as compared to placebo, on the percentage inhibition of DPP‐4 activity at 168 hours postdose was analyzed using a linear mixed‐effects model containing treatment (studies 1 and 2), day, and treatment‐by‐day interaction (for study 2) as fixed effects and subject as a random effect. The WAA of GLP‐1 was analyzed using an ANOVA model for study 2.
Safety and Tolerability
Physical examinations, vital signs, 12‐lead ECGs (including assessment of QTc [the period measured in milliseconds extending between the start of the Q wave and the end of the T wave] and PR interval duration [the period measured in milliseconds extending from the onset of atrial depolarization until the onset of ventricular polarization]), and safety laboratory measurements comprising routine hematology, serum chemistry (including liver transaminases), and urinalysis were performed prior to dosing, at various time points after dosing and at the poststudy visit. Assessment for potential hypoglycemia was also monitored by frequent glucometer measurements over the first 24‐hour period after each dose in the single‐dose study and after the last dose in the multiple‐dose study as well as by clinical assessment. Adverse experiences were monitored throughout the study. Investigators evaluated all clinical adverse experiences in terms of intensity (mild, moderate, or severe), duration, severity, seriousness, outcome, and relationship to study drug.
Results
Pharmacokinetics
Tables 1 and 2 summarize the single‐ and multiple‐dose omarigliptin plasma and urine pharmacokinetic parameters, respectively. Mean plasma concentration‐time profiles after oral single (0.5 to 400 mg) and multiple (10, 25, 50, and 100 mg on days 1, 8, and 15) doses are shown in Figure 1.
Table 1.
Pharmacokinetic Parameters Following Single‐Dose Administration of Omarigliptin in Healthy Male Subjects Following an Overnight Fast
| 0.5 mg | 1.5 mg | 5 mg | 12.5 mg | 25 mg | 50 mg | 100 mg | 200 mg | 400 mg | |
|---|---|---|---|---|---|---|---|---|---|
| AUC0‐∞ a (μM·h) | |||||||||
| N | 0 | 6 | 6 | 6 | 6 | 6 | 6 | 6 | 12 |
| GMh (95%CI) | NA | 1.7 (1.5, 1.9) | 5.3 (4.8, 6.0) | 12.0 (10.6, 13.3) | 22.5 (20.0, 25.3) | 41.6 (37.1, 46.7) | 86.9 (77.4, 97.6) | 162 (145, 182) | 335 (304, 369) |
| AUC0‐last b (μM·h) | |||||||||
| N | 6 | 6 | 6 | 6 | 6 | 6 | 6 | 6 | 12 |
| GM (95%CI) | 0.15 (0.12, 0.17) | 1.3 (1.1, 1.5) | 4.7 (4.0, 5.6) | 11.4 (9.6, 13.5) | 22.4 (18.9, 26.5) | 41.0 (34.6, 48.5) | 88.6 (74.8, 105) | 158 (133, 187) | 334 (294, 378) |
| AUC0‐24h c (μM·h) | |||||||||
| N | 6 | 6 | 6 | 6 | 6 | 6 | 6 | 6 | 12 |
| GM (95%CI) | 0.092 (0.085, 0.10) | 0.34 (0.32, 0.44) | 1.5 (1.4, 1.6) | 4.2 (3.9, 4.5) | 8.2 (7.5, 8.8) | 16.4 (15.1, 17.7) | 34.5 (31.9, 37.3) | 69.0 (63.8, 74.7) | 145 (135, 155) |
| AUC0‐168h d (μM·h) | |||||||||
| N | 0 | 6 | 6 | 6 | 6 | 5 | 6 | 6 | 12 |
| GM (95%CI) | NA | 1.2 (1.1, 1.3) | 4.1 (3.8, 4.5) | 10.6 (9.7, 11.6) | 20.9 (19.1, 22.9) | 39.4 (35.9, 43.3) | 82.5 (75.3, 90.4) | 155 (142, 170) | 323 (298, 349) |
| Cmax e (nM) | |||||||||
| N | 6 | 6 | 6 | 6 | 6 | 6 | 6 | 6 | 12 |
| GM (95%CI) | 6.5 (5.6, 7.4) | 20.7 (17.9, 23.8) | 88.2 (76.4, 102) | 219 (190, 253) | 484 (419, 559) | 904 (783, 1040) | 2210 (1910, 2550) | 3850 (3340, 4440) | 9290 (8300, 10400) |
| C168h f (nM) | |||||||||
| N | 0 | 6 | 6 | 6 | 6 | 5 | 6 | 6 | 12 |
| GM (95%CI) | NA | 3.3 (2.5, 4.2) | 6.75 (5.2, 8.8) | 10.8 (8.4, 14.0) | 20.6 (15.9, 26.7) | 26.7 (20.4, 35.0) | 54.3 (41.9, 70.4) | 79.5 (61.4, 103) | 174 (142, 213) |
| Tmax (h) | |||||||||
| N | 6 | 6 | 6 | 6 | 6 | 6 | 6 | 6 | 12 |
| Median (Min, Max) | 0.75 (0.50, 2.0) | 1.0 (1.0, 6.0) | 2.0 (1.0, 6.0) | 4.0 (1.0, 6.0) | 0.75 (0.50, 2.0) | 1.5 (1.0, 4.0) | 0.75 (0.50, 4.0) | 1.5 (0.50, 4.0) | 1.0 (0.50, 1.0) |
| t½ (h) | |||||||||
| N | 0 | 6 | 6 | 6 | 6 | 6 | 6 | 6 | 12 |
| GM (GMCV) | NA | 93.3g (43.2) | 115.9g (62.4) | 68.9 (42.2) | 49.5 (24.9) | 47.7 (31.2) | 42.6 (26.5) | 45.2 (22.3) | 42.5 (21.5) |
| CLr (L/h) | |||||||||
| N | 0 | 6 | 6 | 6 | 6 | 6 | 6 | 6 | 12 |
| GM (95%CI) | NA | 1.6 (1.3, 1.9) | 2.1 (1.9, 2.4) | 2.3 (1.9, 2.8) | 2.2 (1.9, 2.4) | 2.4 (2.1, 2.7) | 2.1 (1.8, 2.5) | 2.7 (2.2, 3.3) | 2.7 (2.4, 3.0) |
CI, confidence interval; CLr, renal clearance; GM, geometric least‐squares mean; GMCV, geometric coefficient of variation; NA, not assessable.
a‐frMSE: a0.1; b0.2; c0.1; d0.1; e0.1; f0.2.
gValues were estimated to exceed 3 half‐lives of available data and therefore are considered only an approximation.
Table 2.
Pharmacokinetic Parameters Following the Administration of Multiple, Once‐Weekly Doses of Omarigliptin (Days 1, 8, and 15) in Healthy Male Subjects After an Overnight Fast
| Dose | Day | AUC0‐24h (μM·h) | AUC0‐168h (μM·h) | Cmax (nM) | C168h (nM) | Tmax a (h) | t½ b (h) | fe (%) | CLr (L/h) |
|---|---|---|---|---|---|---|---|---|---|
| 10 mg | Day 1 GMb (95%CI) | 3.1 (2.7, 3.4) | 7.4 (6.4, 8.5) | 184 (158, 214) | 8.8 (5.8, 13.3) | 3.0 (0.50, 4.0) | – | – | – |
| Day 15 GM (95%CI) | 3.5 (3.1, 3.9) | 8.8 (7.6, 10.1) | 195 (167, 227) | 11.9 (7.8, 18.1) | 4.0 (1.0, 8.0) | 83.2 (59.3) | 70.1 (14.1) | 2.0 (1.8, 2.3) | |
| AR GMR (90%CI) | – | 1.2 (1.1, 1.3) | 1.1 (1.0, 1.2) | 1.4 (1.1, 1.7) | – | – | – | – | |
| 25 mg | Day 1 GM (95%CI) | 9.2 (8.1, 10.4) | 22.0 (19.1, 25.4) | 610 (524, 712) | 18.8 (12.4, 28.6) | 1.0 (0.50, 4.00) | – | – | – |
| Day 15 GM (95%CI) | 9.8 (8.7, 11.1) | 22.0 (19.1, 25.4) | 565 (485, 659) | 17.1 (11.2, 25.9) | 1.5 (1.0, 4.1) | 66.7 (37.1) | 57.5 (15.7) | 1.6 (1.4, 1.9) | |
| AR GMR (90%CI) | 1.0 (0.91, 1.1) | 0.93 (0.83, 1.0) | 0.91 (0.71, 1.2) | – | – | – | – | ||
| 50 mg | Day 1 GM (95%CI) | 17.7 (15.6, 20.0) | 40.7 (35.3, 47.0) | 988 (847, 1150) | 26.5 (17.4, 40.3) | 4.0 (1.0, 4.0) | – | – | – |
| Day 15 GM (95%CI) | 19.9 (17.6, 22.5) | 47.8 (41.4, 55.1) | 1080 (927, 1260) | 32.8 (21.6, 49.9) | 4.0 (1.0, 6.0) | 48.3 (25.9) | 73.6 (4.3) | 1.9 (1.7, 2.2) | |
| AR GMR (90%CI) | – | 1.2 (1.1, 1.3) | 1.1 (1.0, 1.2) | 1.2 (1.0, 1.6) | – | – | – | – | |
| 100 mg | Day 1 GM (95%CI) | 35.1 (31.1, 39.8) | 82.3 (71.3, 94.9) | 2320 (1990, 2700) | 51.5 (33.9, 78.3) | 2.5 (0.50, 4.0) | – | – | – |
| Day 15 GM (95%CI) | 37.1 (32.8, 41.9) | 87.8 (76.1, 101) | 2400 (2060, 2800) | 61.1 (40.2, 92.8) | 1.0 (0.42, 6.0) | 41.7(19.7) | 72.2 (7.7) | 2.1 (1.8, 2.4) | |
| AR GMR (90%CI) | – | 1.1 (0.98, 1.2) | 1.0 (0.93, 1.2) | 1.2 (0.93, 1.5) | – | – | – | – |
N = 6 for all doses.
AR, accumulation ratio; CI, confidence interval; CLr, renal clearance; fe, fraction of dose excreted in urine; GM, geometric least‐squares mean; GMR, geometric least‐squares mean ratio.
– = Not calculated.
aMedian (minimum, maximum).
bHarmonic mean and jackknifed standard deviation.
Figure 1.
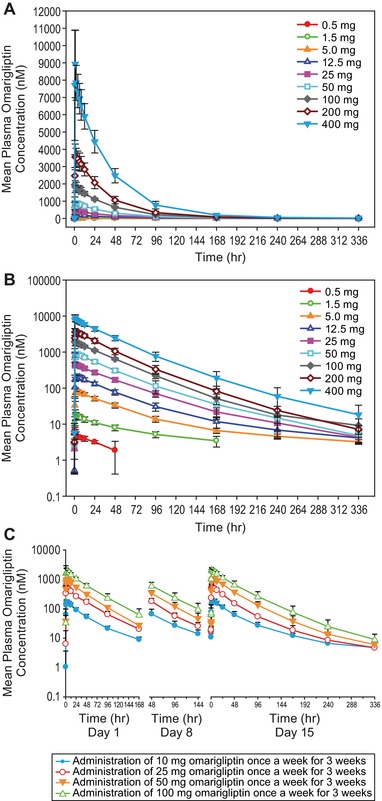
Mean (± SD) plasma concentration‐time profiles of omarigliptin (nM) in healthy men following the administration of single (A, linear scale; B, log‐linear scale) and multiple oral doses of omarigliptin (C).
Following single oral doses, omarigliptin was rapidly absorbed with a median Tmax value ranging from 0.75 to 4.0 hours. The pharmacokinetic profile of omarigliptin was biphasic, with an observed 40‐ to 50‐hour α phase governing the majority of the pharmacokinetic profile and a β phase with a half‐life of approximately 93 to 116 hours, which contributed more substantially to the pharmacokinetic profile at low doses (Figure 1A,B, Table 1). Although AUC0‐168h appeared to exhibit dose proportionality across all doses from 0.5 mg to 400 mg, Cmax and AUC0‐24h increased in a slightly greater than dose‐proportional manner. In contrast, AUC0‐∞ and C168h increased in a slightly less than dose‐proportional manner. The majority of urine omarigliptin concentrations were undetectable for all time intervals following the 0.5‐mg dose but were detectable following all other dose levels. Geometric mean CLr of omarigliptin calculated based on the 0 to 48‐hour urinary excretion data ranged from 1.6 to 2.7 L/h.
After single‐dose administration, omarigliptin was rapidly absorbed with a median Tmax value of 1.5 hours under fasted conditions and 4.00 hours under fed conditions. The observed geometric least‐squares mean ratios (GMRs) (fed/fasted) (90%CI) for AUC0‐∞, AUC0‐last, AUC0‐168h, Cmax, and C168h were 1.0 (1.0, 1.1), 1.0 (1.0, 1.1), 1.0 (1.0, 1.1), 0.95 (0.81, 1.1), and 1.1 (1.0, 1.2), respectively. Geometric means (95%CI) for CLr under fed and fasted conditions were similar (ie, 1.9 [1.6, 2.2] and 1.8 [1.5, 2.2], respectively). No difference in overall absorption was observed in the presence and absence of a high‐fat breakfast.
Following multiple oral doses, omarigliptin was rapidly absorbed, with median Tmax ranging from 1.0 to 4.0 hours across treatments (Table 2). Accumulation of AUC0‐168h, Cmax, and C168h was minimal. The observed geometric mean (GM) accumulation ratios (90%CI) over the 10‐ to 100‐mg dose range ranged from 1.0 to 1.2 for AUC0‐168h, from 0.93 to 1.1 for Cmax, and from 0.91 to 1.4 for C168h. Steady state was achieved in more than 80% following the second dosing for all treatments, and steady state was achieved in all subjects after the third dosing. Both AUC0‐168h and Cmax appeared to exhibit dose proportionality across all doses from 10 to 100 mg.
Over a 168‐hour collection period at steady state on day 15, 57.5% to 73.6% of the omarigliptin dose was recovered unchanged in urine. CLr of omarigliptin, calculated based on the 0‐ to 168‐hour urinary excretion data, ranged from 1.6 to 2.1 L/h and was consistent across all doses except for the 25‐mg group, which showed lower CLr values; however, this group also had lower estimated creatinine clearance compared to the other dose levels. The ratio of CLr/CrCL ranged from 0.21 to 0.25, and was consistent across all dose groups, including the 25‐mg dose group.
Pharmacodynamics
In the single‐dose study, the point estimates of percentage inhibition of DPP‐4 activity 168 hours postdose increased with dose from 32.2 to 96.7 at 0.5‐ and 400‐mg doses, respectively. The difference (active minus placebo) in DPP‐4 inhibition was in the range of 26.5% to 90.9% for omarigliptin doses ranging from 0.5 to 400 mg. Because the corresponding lower bounds of the 90%CIs were greater than 0 for all omarigliptin dose levels from 0.5 to 400 mg, the percentage inhibition of DPP‐4 activity at 168 hours postdose was significantly greater than that with placebo. In the multiple‐dose study, administration of QW omarigliptin for 3 weeks produced dose‐dependent statistically significant inhibition of DPP‐4 activity compared with placebo at 168 hours postdose on both day 1 and day 15 (Figure 2A). The mean treatment differences (active minus placebo) and 90%CIs for percentage inhibition of DPP‐4 activity on days 1 and 15 ranged between 77.3% (65.1%, 90.5%) to 90.9% (76.4%, 100.0%) and 77.7% (69.4%, 86.5%) to 88.3% (72.3%, 100.0%), respectively, over the 10‐ to 100‐mg dose range.
Figure 2.
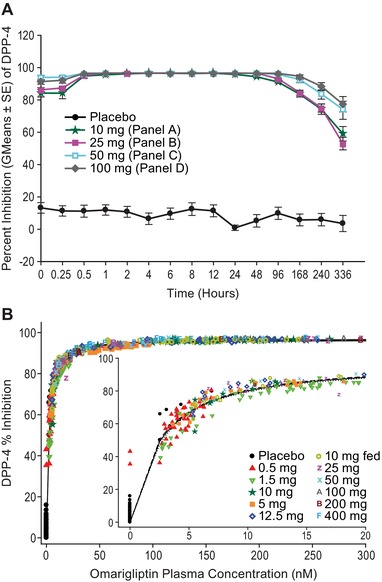
(A) Inhibition of plasma DPP‐4 activity following the administration of multiple, once‐weekly (steady state, hours after day 15) oral doses of omarigliptin 10 mg to 100 mg. Data are percentage inhibition from baseline (predose), shown as mean ± standard error. (B) DPP‐4 inhibition vs omarigliptin plasma concentration following administration of single doses of omarigliptin. (Figure shows model fit line and 95% confidence band in dashed and dotted lines.)
The PK/PD relationship (Figure 2B) followed a maximum inhibitory efficacy (Emax) model, with an Emax value of 96.8% inhibition (SE 0.2), a half‐maximal inhibitory concentration (IC50) value of 2.5 nM (SE 0.05), and a Hill slope γ = 1.1 (SE 0.03).
The active GLP‐1 profile following multiple‐dose administration of omarigliptin on day 15 after the second meal is shown in Figure 3. The WAA for active and total GLP‐1 through 2 hours after the first and second meals (4 and 10 hours post–last dose) on day 15 following administration of QW multiple oral doses of omarigliptin was determined. At 4 hours postdose, WAAs for active GLP‐1 were significantly increased compared to placebo, with GMRs ranging from 1.7 to 2.1 and the lower bound of 90%CI being greater than 1 for all treatments. WAAs for total GLP‐1 were not statistically different from placebo, with GMRs ranging from 0.77 to 1.0. At 10 hours postdose following the second meal, WAAs for active GLP‐1 were significantly increased compared to placebo, with GMRs ranging from 2.1 to 2.6 with the lower bound of 90%CI being greater than 1 for all treatments. WAA for total GLP‐1 was not statistically different from that with placebo, with GMRs ranging from 0.77 to 1.1.
Figure 3.
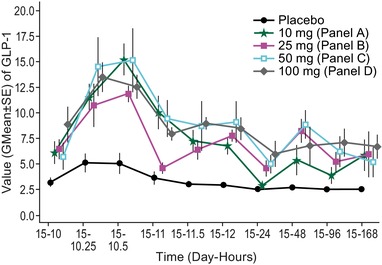
Geometric mean ± standard error preprandial/postprandial plasma active GLP‐1 (pmol/L) vs time (day‐hours) at lunch following the last dose on day 15 after multiple weekly doses (days 1, 8, and 15) of omarigliptin or placebo in healthy male volunteers.
PK/QTc Relationships
The estimated slope and corresponding 95%CIs obtained from the mixed linear model of QTcF vs plasma omarigliptin concentration using all available data were 0.28 (–0.25, 0.81) (Figure 4). The effect of omarigliptin plasma concentrations on QTcF was not statistically significantly different from zero (P = .3).
Figure 4.
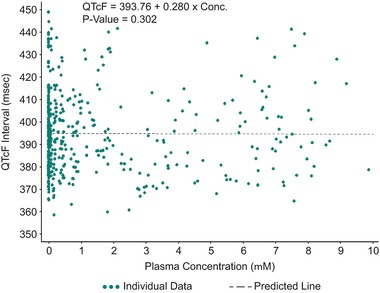
Time‐matched QTcF vs plasma omarigliptin concentration (μM) from subjects in the single ascending dose study, with linear mixed‐effect model fit line.
Safety and Tolerability
Omarigliptin was generally well tolerated in healthy adults following the administration of single and multiple doses. No subject had serious clinical or laboratory adverse experiences or discontinued prematurely because of a clinical adverse experience. Adverse experiences were mild to moderate in intensity, transient in duration, and resolved without treatment. There were no reports of clinical or laboratory adverse experiences of hypoglycemia, as assessed by frequent glucometer measurements or signs and symptoms of hypoglycemia. In the single‐dose study, 19 subjects reported a total of 50 nonserious clinical adverse experiences, including 2 that occurred prior to dosing (prestudy) and 15 treatment‐emergent adverse experiences that were considered drug‐related by the study investigator (ie, 7 following omarigliptin and 8 following placebo). The most common drug‐related clinical adverse experiences reported in the single‐dose study were headache, dry mouth, nausea, and migraine. In the multiple‐dose study, 26 subjects reported a total of 93 nonserious clinical adverse experiences, including 6 that occurred prior to dosing (prestudy or pretreatment) and 54 treatment‐emergent adverse experiences that were considered drug‐related by the study investigator (ie, 14 following placebo and 40 following omarigliptin). The most common drug‐related adverse experiences reported in the multiple‐dose study were headache, dizziness, postural dizziness, head discomfort, nausea, and diarrhea. There were no consistent treatment‐related or dose‐related changes in laboratory parameters, vital signs, orthostatic vital signs, ECG safety parameters, or physical examination results following the single and multiple administration of study drug.
Discussion
These single‐ and multiple‐dose double‐blind, placebo‐controlled studies provide the first clinical data for omarigliptin and confirm sustained inhibition of plasma DPP‐4 activity and augmentation of postmeal active GLP‐1 levels as proof of pharmacology for an oral once‐weekly DPP‐4 inhibitor in humans. These studies also established the initial doses of omarigliptin and demonstrated its favorable pharmacokinetic and pharmacodynamic characteristics supporting a once‐weekly dosing regimen.
In both studies, omarigliptin absorption was rapid across all doses studied. The plasma pharmacokinetic profile of omarigliptin was biphasic in nature, with distinct α and β phases. The apparent terminal half‐life values at steady state were supportive of QW dosing. The predicted negligible accumulation required for a weekly dosing regimen based on single‐dose findings was indeed confirmed in the multiple‐dose study. After multiple dosing, theoretical steady state was reached in 2 to 3 weeks.
A standard high‐fat breakfast appeared to have a minimal effect on overall plasma exposure of omarigliptin, which is consistent with the high solubility and permeability properties of this compound (unpublished data) and supports the dosing of omarigliptin without regard to food. Across both single and multiple doses, omarigliptin showed dose‐related increases in plasma exposure.
The renal clearance of omarigliptin ranged from approximately 1.6 to 2.7 L/h following the administration of single and multiple doses of omarigliptin. Because this unbound clearance is substantially below the estimated glomerular filtration (90 mL/min) and substantially lower than the CrCL measured in this study, it suggests that omarigliptin is predominantly cleared by filtration with net reabsorption. This finding also is consistent with the high permeability property of the compound, suggesting the limited possibility of active transport as a mechanism for renal clearance.
DPP‐4 inhibitors have demonstrated clinically significant improvements in glycemic control in patients with T2DM by increasing insulin secretion and enhancing the activity of incretins such as GLP‐1. The enhancement of insulin concentrations, in concert with reduced glucagon concentrations, lowers both fasting and postprandial glucose concentrations. As a result, plasma DPP‐4 activity is considered a qualified biomarker for predicting the magnitude of clinically significant glucose‐lowering efficacy. Following treatment with single doses of omarigliptin, DPP‐4 percentage inhibition increased with increasing doses from 32.2% to 96.7% at 0.5 and 400 mg, respectively. Both single and multiple weekly doses of omarigliptin 10, 25, 50, and 100 mg significantly inhibited DPP‐4 activity compared with placebo. Marked inhibition of DPP‐4 activity was achieved at 168 hours following the first omarigliptin dose, consistent with the findings from the single‐dose study. Following multiple weekly doses, the levels of inhibition of DPP‐4 activity are generally consistent with those observed in preclinical studies, where plasma DPP‐4 activity was inhibited by ∼85% in lean mice at the 0.3 mg/kg dose.11 At steady state on day 15, all doses of omarigliptin provided significant augmentation of active GLP‐1 levels compared with placebo through 2 hours following the consumption of standard meals at 4 hours and 10 hours postdose.
The GMRs for WAA of active GLP‐1 ranged from 1.7 to 2.1 and 2.1 to 2.6 following the first and second meals, respectively, and the lower bounds of the associated 90%CIs were all greater than 1. These observed increases in active GLP‐1 are consistent with the known mechanism of action of omarigliptin. WAAs for total GLP‐1 were not statistically different from placebo at 4 hours and 10 hours postdose, with GMRs ranging from 0.77 to 1.1. The changes observed in the clinic relative to GLP‐1 also are consistent with those reported in preclinical studies.11
The integrated dose‐response data indicated that the 25‐mg dose reached maximal effects for DPP‐4 inhibition and GLP‐1 augmentation, supporting the development of this dose in subsequent larger‐scale clinical efficacy trials.
Assessment of risk of QT prolongation is a critical requirement for small‐molecule development programs. To allow assessment of the QT prolongation risk in an efficient manner, triplicate QT sampling with time‐matched plasma concentration samples was incorporated into the single ascending dose study design. An ascending dose study design provides for an ideal data set to evaluate the exposure‐response relationship between plasma drug concentration and QTc. The results of a linear mixed‐effects model analysis identified a slightly positive slope of 0.3 ms/μM, which was not statistically significant. That slope predicts a 2.8‐millisecond QTc prolongation at a Cmax of 10 μM, which is below the level of clinical or regulatory concern and represents an approximate 20‐fold margin to the clinical dose of 25 mg. The predicted low risk for QTc prolongation based on the data set in this early trial was confirmed in a thorough QT trial conducted later in development.16 Our findings support a more resource‐effective way to collect rich ECG data and to assess QTc prolongation risk early in a new drug development program, such as a FIH study. If it is adequately characterized in a FIH study, thorough QTc studies may not be necessary. Such approaches have been proposed by several authors.13, 14, 15
Administration of single and QW multiple oral doses of omarigliptin was generally well tolerated in healthy male subjects, based on the assessment of clinical and laboratory adverse experiences. The absence of an effect of omarigliptin on glycemic parameters in healthy subjects in these studies, along with an observed lack of effect on signs and symptoms of hypoglycemia, is consistent with the low hypoglycemic risk for this class of drugs.
Conclusion
The apparent terminal half‐life and the inhibitory effect on plasma DPP‐4 activity following oral administration of omarigliptin, a novel once‐weekly DPP‐4 inhibitor, are supportive of a sustained and clinically meaningful effect and may serve to improve treatment adherence and optimize glycemic control in patients with T2DM.
Acknowledgments
The authors would like to acknowledge Kristen Lewis (Merck & Co, Kenilworth, New Jersey) and Sheila Erespe for assistance in preparing this paper for publication as well as Deborah Hilliard and Kathy Borja (Merck & Co, Clinical Development Laboratory, Rahway, New Jersey) for their assistance with the PD assays.
Authors’ Contributions
R.K., C.A., J.A.W., and S.A.S. designed the studies. X.S.G. performed the statistical analyses. D.T., A.M., and J.Z.P. performed analyses for PK/PD, bioanalytics, and QTc/PK results. R.K., C.A., and D.T. helped to interpret the study results. All other authors contributed to interpretation through discussion of the results either at the study analysis or manuscript‐writing phase. This report was mainly written by R.K. with assistance from A.O.J.L. and I.N.G. All authors critically reviewed, revised, and subsequently approved the manuscript.
R.K. designed the single‐dose study and did preliminary design of the multiple‐dose study, oversaw the execution of the study, interpreted the data from the study, and developed the written manuscript summarizing the findings. C.A. designed the multiple‐dose study, oversaw the execution of the study, and interpreted the data from the study. D.T. provided pharmacokinetic and PK/PD data analysis and interpretation for both studies. X.S.G. provided statistical data analysis for both studies. I.N.G. III provided medical program coordinating support for both studies. A.M. provided bioanalytical contributions to both studies. J.Z.P. provided preliminary PK/QTc analyses for the single‐dose study. M.R. was the local trial monitor who oversaw the execution of the studies at the 2 sites, and contributed to the protocol review, study conduct, and reporting. W.H., J.N.deH., and M.D. were principal investigators in the described studies and contributed in the review of the protocol, medical reviews during study conduct, and reporting of the studies. A.O.J.‐L. provided medical writing and coordination support for the manuscript. J.A.W. reviewed the designs and data from the studies and provided review of the manuscript. S.A.S. reviewed the designs and data from the studies and provided review of the manuscript.
Funding
Funding for this study was provided by Merck & Co, Kenilworth, New Jersey, USA.
Declaration of Conflicting Interests
The study was sponsored by Merck & Co, Kenilworth, New Jersey, USA. All authors are current or former employees of Merck Sharp & Dohme Corp, a subsidiary of Merck & Co, Kenilworth, New Jersey, USA and may own stock or stock options in the company.
The material presented in this paper was presented in poster format at the 73rd Scientific Sessions (2013) of the American Diabetes Association (Chicago, Illinois).
References
- 1. IDF Diabetes Atlas, 6th ed. Brussels, Belgium: International Diabetes Federation; 2013. http://www.idf.org/sites/default/files/Atlas‐poster‐2014_EN.pdf.
- 2. Cramer JA. A systematic review of adherence with medications for diabetes. Diabetes Care. 2004;27:1218–1224. [DOI] [PubMed] [Google Scholar]
- 3. Cheong C, Barner JC, Lawson KA, Johnsrud MT. Patient adherence and reimbursement amount for antidiabetic fixed‐dose combination products compared with dual therapy among Texas Medicaid recipients. Clin Ther. 2008;30:1893–1907. [DOI] [PubMed] [Google Scholar]
- 4. Paes AH, Bakker A, Soe‐Agnie CJ. Impact of dosage frequency on patient compliance. Diabetes Care. 1997;20:1512–1517. [DOI] [PubMed] [Google Scholar]
- 5. Johnston SS, Nguyen H, Felber E, et al. Retrospective study of adherence to glucagon‐like peptide‐1 receptor agonist therapy in patients with type 2 diabetes mellitus in the United States. Adv Ther. 2014;31:1119–1133. [DOI] [PubMed] [Google Scholar]
- 6. Brubaker PL. Mini review: update on incretin biology: focus on glucagon‐like peptide‐1. Endocrinology. 2010;151:1984–1989. [DOI] [PubMed] [Google Scholar]
- 7. Holst JJ, Vilsboll T, Deacon CF. The incretin system and its role in type 2 diabetes mellitus. Mol Cell Endocrinol. 2009;297:127–136. [DOI] [PubMed] [Google Scholar]
- 8. Xu L, Man CD, Charbonnel B, et al. Effect of sitagliptin, a dipeptidyl peptidase‐4 inhibitor, on beta‐cell function in patients with type 2 diabetes: a model‐based approach. Diabetes Obes Metab. 2008;10:1212–1220. [DOI] [PubMed] [Google Scholar]
- 9. Krishna R, Herman G, Wagner JA. Accelerating drug development using biomarkers: a case study with sitagliptin, a novel DPP4 inhibitor for type 2 diabetes. AAPS J. 2008;10:401–409. [DOI] [PMC free article] [PubMed] [Google Scholar]
- 10. Scheen AJ. A review of gliptins for 2014. Expert Opin Pharmacother. 2015;16:43–62. [DOI] [PubMed] [Google Scholar]
- 11. Biftu T, Sinha‐Roy R, Chen P, et al. Omarigliptin (MK‐3102): a novel long‐acting DPP‐4 inhibitor for once‐weekly treatment of type 2 diabetes. J Med Chem. 2014;57:3205–3212. [DOI] [PubMed] [Google Scholar]
- 12. Food and Drug Administration, HHS . International Conference on Harmonisation; guidance on E14 clinical evaluation of QT/QTc interval prolongation and proarrhythmic potential for non‐antiarrhythmic drugs. Fed Register. 2005;70:61134–61135. [PubMed] [Google Scholar]
- 13. Krishna R. Model‐based evaluation of QTc interval risk: an increasing emphasis on early decision making. J Clin Pharmacol. 2009;49:1010–1011. [DOI] [PubMed] [Google Scholar]
- 14. Darpo B, Benson C, Dota C, et al. Results from the IQ‐CSRC prospective study support replacement of the thorough QT study by QT assessment in the early clinical phase. Clin Pharmacol Ther. 2015;97:326–335. doi: 10.1002/cpt.60. [DOI] [PubMed] [Google Scholar]
- 15. Rohatagi S, Carrothers TJ, Kuwabara‐Wagg J, Khariton T. Is a thorough QTc study necessary? The role of modeling and simulation in evaluating the QTc prolongation potential of drugs. J Clin Pharmacol. 2009;49:1284–1296. [DOI] [PubMed] [Google Scholar]
- 16. Tatosian DA, Cardillo Marricco N, Glasgow XS, et al. A thorough QTc study confirms early pharmacokinetics/QTc modeling: a supratherapeutic dose of omarigliptin, a once‐weekly DPP‐4 inhibitor, does not prolong the QTc interval [published online ahead of print]. Clin Pharmacol Drug Dev. 2016. doi: 10.1002/cpdd.260. [DOI] [PubMed] [Google Scholar]