

Abstract
The cerebral cortex is well known to display a large variation in excitatory and inhibitory chemoarchitecture, but the effect of this variation on global scale functional neural communication and synchronization patterns remains less well understood. Here, we provide evidence of the chemoarchitecture of cortical regions to be associated with large‐scale region‐to‐region resting‐state functional connectivity. We assessed the excitatory versus inhibitory chemoarchitecture of cortical areas as an ExIn ratio between receptor density mappings of excitatory (AMPA, M1) and inhibitory (GABAA, M2) receptors, computed on the basis of data collated from pioneering studies of autoradiography mappings as present in literature of the human (2 datasets) and macaque (1 dataset) cortex. Cortical variation in ExIn ratio significantly correlated with total level of functional connectivity as derived from resting‐state functional connectivity recordings of cortical areas across all three datasets (human I: P = 0.0004; human II: P = 0.0008; macaque: P = 0.0007), suggesting cortical areas with an overall more excitatory character to show higher levels of intrinsic functional connectivity during resting‐state. Our findings are indicative of the microscale chemoarchitecture of cortical regions to be related to resting‐state fMRI connectivity patterns at the global system's level of connectome organization. Hum Brain Mapp 37:3103–3113, 2016. © 2016 Wiley Periodicals, Inc.
Keywords: fMRI, functional connectivity, chemoarchitecture, receptor, excitatory, inhibitory, connectome, resting‐state fMRI
INTRODUCTION
Brain function emerges from neural signaling and information transfer. At the cellular scale, a neuron's dendritic tree and axonal projections form the infrastructure for neuron‐to‐neuron signaling, with information transmitted from one neuron to another by means of chemical (or in some cases more direct electrical) transmission at a neuron's synapses [see for review Kandel et al., 2000]. Depending on type of neurotransmitter and receptor, the net effect of a neurotransmitter will be an excitatory (increasing the chance of a neuron to fire) or inhibitory (decreasing the chance of a neuron to fire) impulse to the postsynaptic neuron. Studies have shown a rich variety in the excitatory and inhibitory chemoarchitecture of cortical regions, with cortical areas showing varying densities of excitatory and inhibitory receptors. Some regions for example display relatively high levels of excitatory receptors such as glutamatergic NMDA, AMPA, and/or acetylcholine receptors M1 and relatively low levels of inhibitory GABAA or M2 receptors, while other regions show a much more overall inhibitory chemoarchitectural character [e.g., Caspers et al., 2015, 2013; Zilles and Amunts, 2009; Zilles et al., 2015, 2002]. However, while cellular neuroscience studies have delineated the effects of neurotransmitter type and accompanying receptors on the behavior of postsynaptic neurons, the effects of the chemoarchitecture of large‐scale cortical areas on the emergence of global region‐to‐region activity patterns and interregional connectivity are less well understood [Kötter et al., 2007].
At this global scale of brain organization, neural communication and signaling is often inferred from synchronization patterns between cortical areas. In the last decade, the measurement of correlative patterns between intrinsic brain activity as derived from resting‐state fMRI recordings has become a highly influential methodology for obtaining insight into the functional macroarchitecture of the human and animal brain [see for review Fox and Raichle, 2007; Park and Friston, 2013; van den Heuvel and Hulshoff Pol, 2010a; van den Heuvel et al., 2016]. Functional connectivity is defined as the synchronization pattern of activation time‐series of large‐scale cortical regions [Biswal et al., 1995; Friston et al., 1993], and in the human brain there is ample evidence of macroscale connectivity patterns to be linked to global brain function [Baggio et al., 2015; Bassett et al., 2009; Cole et al., 2012; Collin et al., 2014, 2015; Davis et al., 2013; Kong et al., 2014; Kunisato et al., 2011; van den Heuvel and Hulshoff Pol, 2010b; van den Heuvel et al., 2009]. As such, resting‐state fMRI has become one of the workhorses of today's clinical, translational, and fundamental neuroscientist. However, despite the clear impact of this type of measurement on contemporary neuroscience, the field does not yet have a fully clear picture of the biological underpinnings of resting‐state fMRI functional connectivity patterns. Studies have provided insight into the genetic underpinnings of resting‐state correlations showing high heritability in twin studies [Bohlken et al., 2014; Fornito et al., 2011; Glahn et al., 2010; Jahanshad et al., 2013; van den Heuvel et al., 2013b], SNPs to modulate brain connectivity [Esslinger et al., 2009] and gene expression patterns to be related to the fMRI signal [Cioli et al., 2014]. Furthermore, studies combining anatomical information (such as tract‐tracing in animals and/or in vivo DWI in humans) with resting‐state fMRI have shown a clear link between the two modalities [Adachi et al., 2012; Cocchi et al., 2014; Hagmann et al., 2008; Honey et al., 2009; van den Heuvel and Sporns, 2013a, 2013b], suggesting that the brain's macroscale anatomical wiring forms the infrastructure for region‐to‐region functional interactions to emerge. Studies using advanced methods combining resting‐state BOLD fMRI with more direct metrics of neural activity have further shown evidence of the resting‐state signal to involve—or at least a significant part of the signal to include—a neural origin, hypothesizing that resting‐state global patterns emerge from intrinsic firing patterns of neural populations [e.g., Horwitz, 2004; Logothetis and Wandell, 2004; Niessing et al., 2005; Shmuel and Leopold, 2008]. However, still, there are several open questions about the origin of the observed intrinsic oscillating patterns and accompanying large‐scale synchronization ordering of brain regions. In particular the question of why certain regions show more and stronger activity patterns during rest than others remains poorly understood. With our current study we aim to provide additional insight into this matter, suggesting that the chemoarchitecture of cortical areas may form a potential modulating factor of spontaneous large‐scale region‐to‐region functional connectivity patterns.
Collating quantitative data on cortical receptor density levels of excitatory and inhibitory receptors of cortical regions in the macaque and human cortex from pioneering receptor mapping studies of Amunts and Zilles and coworkers [Amunts et al., 2010; Kötter et al., 2001; Zilles et al., 2015], and combining this data with whole brain fMRI functional connectivity measurements of the macaque and human cortex we show evidence of an association between the chemoarchitecture of cortical regions—and in particular a region's balance in excitatory and inhibitory receptors—and their level of resting‐state fMRI global functional connectivity.
METHODS
Human Dataset
Receptor density levels—human dataset I
Quantitative data on neurotransmitter receptor densities of eight cortical areas of human cortex, describing lateral frontal areas Brodmann Areas 4, 6, 6r1, 44, 45, 47, op8, and op9 (see Fig. 1, left panel and Supporting Information) were collated from the study of Amunts and coworkers using in vitro autoradiography of binding ligands in six postmortem brains (averaging left and right hemispheres) [Amunts et al., 2010]. Cortical receptor densities of four receptors were included, collected as maximum intensity values for the radio labeled receptor‐ligands in fmol/mg protein. Receptor levels of excitatory ionotropic glutamergic AMPA and metabotropic muscarinic acetylcholine type 1 (M1) receptors and inhibitory ionotropic GABAA and metabotropic muscarinic acetylcholine type 2 (M2) receptors were collected. Examination was taken to include receptors that were consistently available across all 3 datasets (see below for human dataset II and the macaque dataset), with other receptor levels provided in the study of Amunts and colleagues (i.e., Kainate and serotonin 5‐HT2A) thus not taken into account in this study. In this context, we explicitly note that we excluded Kainate as it has been shown to have both an excitatory as well as (working through indirect pathways) an inhibitory effect on neuron activity [Contractor et al., 2011] and to be—as a notable difference to the other receptors—mostly present in infragranular layers [Zilles et al., 2015].
Figure 1.
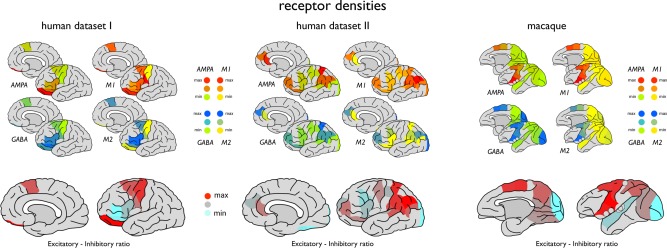
Regional mappings of receptor levels of regions of human cortex as derived from pioneering studies of Amunts et al. [Amunts et al., 2010] (human dataset I, 7 cortical areas, left panels) and Zilles et al. [Zilles et al., 2015] (human dataset II, 18 cortical areas, middle panels) on autoradiography recordings of postmortem cortical tissue. Figures depict measured receptor levels as mapped on the DK‐57 cortical atlas (left hemisphere) depicting levels of excitatory working receptors AMPA and M1 and inhibitory working receptors GABAA and M2. Right upper panel shows regional mappings of receptor levels of excitatory AMPA and M1 and inhibitory GABAA and M2 of 11 regions of macaque cortex mapped to the WBB47 cortical atlas (see text and Supporting Information Fig. 1), as collated from the study of Kotter et al. [Kötter et al., 2001]. Lower panels depict cortical variation in the ExIn ratio between excitatory (AMPA + M1) and inhibitory neurotransmitters (GABAA and M2) for human (left and middle) and macaque cortex (right).
Using the detailed description of region location as provided in the paper of Amunts and coworkers, the eight reported areas were manually mapped (LHS, ET, MPvdH) to the 57 cortical region Desikan‐Killiany (DK) atlas (114 regions across the two hemispheres) [Cammoun et al., 2011; Scholtens et al., 2015] to allow anatomical overlap with cortico‐cortical resting‐state functional connectivity data (see below; see Supporting Information Table 1 for the region‐to‐region mapping). The eight cortical areas mapped to seven cortical parcels of the DK‐57 atlas (two regions reported by Amunts and coworkers overlapped with 1 region in the DK‐57 atlas, and 1 region reported by Amunts and coworkers mapped to multiple subparcels of the DK atlas [see Supporting Information Table 1]). The DK‐57 subdivision atlas was chosen as it includes a higher parcellation resolution than the 34 region cortical Desikan‐Killiany atlas [Desikan et al., 2006] while still maintaining large enough regions to be able to have a robust region‐wise measurement of the resting‐state fMRI signal (see below). To express the overall excitatory versus inhibitory chemoarchitecture of a cortical region, for each region the regional excitatory‐inhibitory receptor ratio ExIn was determined computed as the ratio between the total sum of excitatory receptor levels (i.e., AMPA + M1) and the total sum of inhibitory receptor levels (i.e., GABAA + M2) per region, as previously introduced by Kapogiannis and coworkers [Kapogiannis et al., 2013].
Receptor density levels—human dataset II
A second dataset on receptor density levels of cortical regions was collated from another seminal study of Zilles and coworkers [Zilles et al., 2015]. This larger study described receptor mapping of 26 cortical regions using state‐of‐the‐art high density autoradiography techniques, providing one of the most detailed and most complete receptor density mappings of human cortex present in literature. From the reported receptor fingerprint diagrams of 26 areas of cortex presented by Zilles and colleagues, levels of excitatory AMPA and M1 and inhibitory receptor levels GABAA, and M2 (receptors overlapping with the other human and macaque dataset [see below]) were collected in levels of 50 units of absolute receptor densities (in fmol/mg protein), ranging from 100 to 2,500, with 50 being the finest level of scale that could be distinguished from the Zilles et al. study. (Besides the mentioned four receptors, the rich dataset of Zilles and colleagues also includes data on other receptor types [i.e., Kainate, NMDA, GABAb, BZ, M3, alpha1, alpha2, 5‐HT1a, 5‐HT2, D1], but for consistency across the three datasets the set of four receptor types was taken to be overlapping with the human I and macaque dataset, see above). The 26 areas were mapped to regions of the DK‐57 atlas (using the detailed descriptions and visualizations of the examined cortical regions as presented by Zilles and coworkers, with this mapping described in Supporting Information Table 2) obtaining receptor data of in total 18 of the 57 unihemisphere cortical regions of the DK‐57 atlas. Similar as for the human dataset I, the ExIn ratio of a cortical region was computed as the ratio between excitatory receptor levels (i.e., AMPA + M1) and inhibitory receptor levels (i.e., GABAA + M2). Figure 1 illustrates the receptor density levels as reported by the pioneering work of Zilles and coworkers mapped to the 18 areas of the DK‐57 atlas (left hemisphere).
Resting‐state fMRI functional connectivity
Resting‐state functional connectivity between pairs of regions of the DK‐57 cortical atlas was assessed by means of analysis of the high‐quality resting‐state fMRI data of the Human Connectome Project [Van Essen et al., 2013] (Q3 release, voxel‐size 2mm isotropic, TR/TE 720/33.1 ms, 1,200 volumes, 14:33 min of data block 1, 215 subjects). Data analysis included realignment of the fMRI time‐series, coregistration of the fMRI time‐series to the T1 image (using the mean fMRI over all 1,200 volumes), band‐pass filtering of the time‐series (0.01–0.1 Hz), nuisance correction by regressing out the mean overall signal (mean over all cortical areas), correction for ventricle and white matter signals by means of linear regression, and motion‐scrubbing for potential movement artifacts [Power et al., 2012] (performed as described in detail in van den Heuvel et al. [2013a]). Next, using the individual T1 image (Q3, voxel size: 0.7 mm isotropic), tissue classification of cortical gray matter, white matter, and CSF was performed using FreeSurfer [Fischl and Dale, 2000] and the cortical mantle was parcellated in 114 cortical regions using the described DK‐57 atlas. Next, for each of the individually segmented cortical regions an average time‐series was computed by overlaying the DK‐57 atlas with the fMRI time‐series and by taking the average over the time‐series of the selected voxels within a cortical region. For each individual dataset, a region‐to‐region functional connectivity matrix was computed by means of correlation analysis between the unique 114 × (114‐1)/2 region pairs [Lynall et al., 2010; van den Heuvel et al., 2013a]. Next, a group‐averaged weighted functional connectivity matrix (FC) was formed by averaging the individual matrices. The level of functional connectivity of a region was computed as the total sum of all non‐negative FC connections of a region (FC > 0.1, other thresholds revealed similar findings). Within graph theoretical examinations this metric is often referred to as “functional degree” [Lynall et al., 2010; Rubinov and Sporns, 2010; van den Heuvel and Hulshoff Pol, 2010a; van den Heuvel et al., 2009]. Focus was placed on positive connections, as our study was focused on the examination of excitatory long‐range inter‐areal connections (and thus expecting a positive correlation in time‐series) and with the origin of negative correlations derived from functional resting‐state fMRI recordings remaining a topic of investigation in the field. Overlapping the analysis of the macaque (see below), regional levels of functional connectivity were taken as the intra‐hemispheric degree of each of the 57 regions (that is FC over all intrahemispheric connections of cortical areas). Including also interhemispheric connections (i.e., taking regional functional connectivity of a region as the sum of all 114‐1 left and right hemispheric regions revealed similar findings (as additionally reported in the results section).
Macaque Dataset
Receptor density levels
Data on neurotransmitter receptor density levels of cortical areas of the macaque cortex were collected from the study of Kötter and colleagues [Kötter et al., 2001], reporting on quantitative data of six receptors obtained by means of in vitro autoradiography in two macaque monkeys (Macaca fascicularis and Macaca nemestrina specimens), with receptor density levels provided as maximum intensity value for radio labeled receptor‐ligands in fmol/mg protein. Regions described parts of the visual, motor, and somatosensory cortex. Data included—similar as in the human datasets—receptor density levels of excitatory AMPA and M1 receptors and inhibitory GABAA and M2 receptors. [The rich dataset of Kötter and colleagues also included information on Kainate, and serotonin 5‐HT2A, but our study was focused on the examination of AMPA, M1, M2, and GABAA]. The examined cortical regions as reported by Kötter and colleagues [Kötter et al., 2001] were manually mapped to the Walker‐vonBonin and Bailey WBB47 atlas of macaque cortex [Stephan et al., 2000; von Bonin and Bailey, 1947; Walker, 1940] (used for the functional connectivity mapping, see below and Supporting Information Fig. 1), resulting in a description of receptor density levels of in total 11 cortical regions of the 39 cortical areas of the WBB47 atlas of macaque cortex (Fig. 1, right panel). (This mapping was part of a recent study of our group on the link between anatomical macroscale connectome organization and microscale neuronal complexity [Scholtens et al., 2014] and is described in Supporting Information Table 3). Similar as in the human datasets, regional ExIn ratio of the 11 WBB47 cortical areas was computed as the ratio between excitatory receptor levels (i.e., AMPA + M1) and inhibitory receptor levels (i.e., GABAA + M2).
Resting‐state fMRI functional connectivity
Overlapping the procedure as performed for the human dataset, functional connectivity between cortical areas of the macaque brain was derived from resting‐state fMRI recordings. High‐quality macaque resting‐state fMRI data was acquired in four macaques with a 3T MR Siemens Trio scanner. The monkeys were trained in a mock scanner to continuously fixate on a red dot centered on a blank screen. When they reached 95% fixation performance, each monkey completed 10‐min resting state scans on 5 or 6 different occasions over a period of 6 months, all unsedated [Vanduffel et al., 2001]. The functional images were collected using a gradient‐echo T2‐weighted echo‐planar sequence (40 slices, 84 × 84 in‐plane matrix, repetition time (TR) = 2,000 ms, echo time (TE) = 19 ms, flip angle = 75°, voxel size = 1.25 mm × 1.25 mm × 1.25 mm, 300 volumes per run). Each of these four macaques were scanned during (on average) six sessions on different days (three macaques had six sessions, one macaque had five sessions), with each of the sessions containing (on average) 14 resting‐state fMRI runs (minimum: 7, maximum: 24 sessions per run), bringing the total to 324 sessions of macaque imaging. In addition to the fMRI, T1‐weighted anatomical scans (magnetization‐prepared rapid gradient echo (MP‐RAGE) sequence, TR = 2,200 ms, TE = 4.06 ms, voxel size = 0.5 mm × 0.5 mm × 0.5 mm) were collected during different scanning sessions in which the animals were sedated with ketamine/xylazine (ketamine 10mg/kg I.M. + Xylazine 0.5 mg/kg I.M., maintenance dose of 0.01 to 0.05 mg ketamine per minute I.V.). The macaque fMRI dataset and acquisition conditions are described in detail in [Mantini et al., 2011, 2013; Vanduffel et al., 2001]. Analysis of each of the resting‐state‐fMRI time‐series (i.e., each run separately) included a similar procedure as in the human dataset. Data processing included registration of the time‐series for motion correction, co‐registration of each of the runs with the anatomical T1 images, normalization of the time‐series to a standard macaque average brain (using the transformation of the nonlinear normalization of the T1 to the standard macaque average brain). Data processing further included band‐pass filtering of the time‐series (0.01–0.01 Hz), nuisance correction of the mean overall signal (mean over all cortical areas) and ventricle and white matter signal by means of regression analysis, and motion‐scrubbing for potential movement artifacts [Power et al., 2012]. The spatially normalized resting‐state fMRI volumes were overlaid with the WBB47 parcellation atlas [van den Heuvel et al., 2015a]. For each of the 39 WBB47 cortical areas an average time‐series was computed by taking the mean of the time‐series of all voxels within each region, and the level of functional connectivity between all 39 × (39‐1)/2 unique region pairs was computed as the Pearson correlation coefficient between these regional time‐series, resulting in a 39 × 39 connectivity matrix for each macaque scan run. A group‐averaged weighted macaque functional connectivity matrix (macaque FC) was computed by averaging the connectivity matrices across runs per session, then across sessions, and finally across the four specimens, resulting in a group averaged macaque FC matrix. Next, similar as in the human dataset, level of functional connectivity of each of the 39 regions was computed as the sum of all non‐negative FC connections of FC > 0.1 (other thresholds revealed similar findings) of a region. As the reported receptor density levels included values of one single hemisphere (with visual taken from the right, and motor regions taken from the left hemisphere) [Kötter et al., 2001] and with the WBB47 atlas not distinguishing between left and right hemisphere, regional levels of functional connectivity were taken from the left hemisphere.
Linking Receptor Density Levels to Macroscale resting‐State Functional Connectivity
The focus of our study was the examination of the overall chemoarchitecture of cortical areas by means of the ExIn ratio in relationship to resting‐state functional connectivity, as introduced by [Kapogiannis et al., 2013]. For the human and macaque datasets, associations between a region's level of excitatory‐inhibitory chemoarchitecture and total level of functional connectivity were examined by regression analysis (Pearson's correlation), cross‐correlating regional ExIn ratios and resting‐state fMRI derived functional connectivity levels. Effects reaching a P‐value of an alpha of 0.05/3 = 0.016 (Bonferroni correction for the testing of three datasets) were taken as significant. Jarque‐Bera test was performed to verify that ExIn values and functional connectivity values were normally distributed (which was the case for all ExIn and FC values, P > 0.05). Spearman's rho correlation was also performed for validation in post hoc analyses. In addition to the ExIn ratio, in post hoc analyses we also examined the relationship between individual receptor levels and regional FC.
RESULTS
Human Dataset I
ExIn ratios of frontal areas of human cortex as measured across seven frontal regions significantly correlated to regional levels of functional connectivity (r = 0.91, P = 0.0045, Fig. 2), with cortical areas with a relatively higher excitatory and lower inhibitory character (i.e., a relatively high ExIn ratio) showing higher overall functional connectivity. Including interhemispheric connections in the computation of regional FC (see methods) revealed a similar positive correlation between cortical ExIn and regional functional connectivity (r = 0.94, P = 0.0004). Including region volume as a covariate in a post hoc regression analysis revealed the same association between ExIn ratio and regional FC (P = 0.0165). In addition, also the analyses of Spearman's rho correlation (rho = 0.95, P = 0.0112) and a leave‐one‐out regression validation (in which each datapoint was left out one at the time and correlations were recomputed) revealed similar findings (min r = 0.91, P = 0.0045). A post hoc analysis in which individual receptor levels (i.e., AMPA, M1, M2, GABAA) were correlated with FC revealed no significant relationships (Bonferroni corrected).
Figure 2.
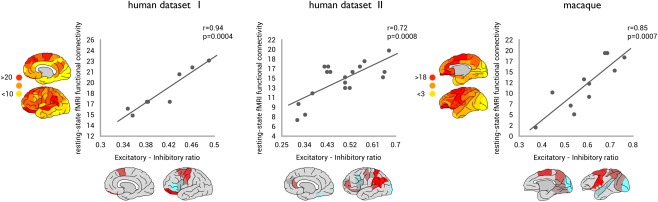
Interactions between the excitatory ‐ inhibitory (ExIn) ratio of cortical regions and total strength of regional resting‐state fMRI functional connectivity. Left and middle panels shows the correlations between ExIn ratio (x‐axis) and regional functional connectivity (y‐axis) for the human datasets (human dataset I and dataset II, respectively). Right panel shows the correlation between ExIn ratio (x‐axis) and cortical resting‐state functional connectivity (y‐axis) for the macaque dataset (see Supporting Information Fig. 2 for region labels). All three datasets show a significant, positive association between the relative excitatory character of cortical areas and the level of cortico‐cortical resting‐state functional connectivity as derived from resting‐state fMRI. [Color figure can be viewed in the online issue, which is available at http://wileyonlinelibrary.com.]
Human Dataset II
Receptor ExIn ratios of data of 18 regions of human cortex revealed a positive correlation with regional resting‐state functional connectivity levels (r = 0.72, P = 0.0008, Fig. 2). Including interhemispheric FC connections revealed similar findings (r = 0.57, P = 0.0134). Post hoc testing of Spearman's rho correlation (rho = 0.50, P = 0.0348), a leave‐one‐out regression validation (min r = 0.55, P = 0.0224) and a regression analysis with region volume as a covariate (P = 0.0009) all revealed similar findings. Post hoc analyses revealed no significant effects between individual receptor levels and FC (Bonferroni corrected).
Macaque Dataset
Consistent with the two human datasets, regional levels of resting‐state functional connectivity of macaque cortical regions as measured across 11 cortical areas were found to be positively associated to regional variation in ExIn ratio (r = 0.85, P = 0.00077, Fig. 2). Including interhemispheric FC connections revealed similar findings (r = 0.86, P = 0.00074). Post hoc testing of Spearman's rho correlation (rho = 0.82, P = 0.0018), a leave‐one‐out regression validation (min r = 0.78, P = 0.0075) and a regression analysis in which region volume was included as a covariate (P = 0.0147) all revealed consistent findings. Post hoc analysis revealed no significant effects between individual receptor levels and FC (Bonferroni corrected).
DISCUSSION
This study suggests a potential interplay between chemoarchitectonic features of cortical areas and macroscale resting‐state fMRI functional connectivity. Combining collated data on receptor density levels of exhibitory and inhibitory neurotransmitters of areas of human and macaque cortex with resting‐state functional MRI recordings, we show cortical areas with a relatively high excitatory and low inhibitory character to show a more elaborate resting‐state functional connectivity profile to other areas of the cortex.
What might be a potential underlying mechanism of a higher excitatory chemoarchitecture to relate to a higher level of resting‐state fMRI functional connectivity? A recent study of our group examined the cortical distribution of receptor levels in macaque cortex in context of strychnine effective connectivity, a unique type of functional connectivity resulting from a temporary excitatory reaction due to strychnine administration on the cortex [Turk et al., 2016]. Strychnine works by blocking local GABA receptors, temporarily increasing the excitatory character of a cortical area. As a result of blocking GABA, the neural activity in the source region is increased, including the activity of the long‐range projecting pyramidal neurons that connect the source region to other sites of the cortex [De Barenne, 1924; De Barenne and McCulloch, 1938; Stephan et al., 2000]. Consistent with the fMRI observations made here, we observed higher levels of effective strychnine connectivity to be related to the chemical balance of cortical areas, with overall more excitatory regions showing a stronger global strychnine connectivity profile. A possible mechanism behind the observed association between excitatory‐inhibitory balance of cortical areas and their fMRI connectivity profile might thus include regions with a more overall excitatory character to be more prone to have a default level of excitatory effect on other areas of the cortex. These thoughts are in line with several studies reporting on intersubject differences in neurotransmitter levels to impact functional connectivity and functional resting‐state network formation. For example, combining resting‐state fMRI recordings with magnetic resonance spectroscopy (MRS) measurements studies have reported higher Glx/Cr levels (a MRS metric of combined glutamate and glutamine concentrations normalized by individual differences in creatine) of anterior cingulate cortex to be related to higher levels of resting‐state fMRI activity [Enzi et al., 2012] and modulation of regional functional connectivity [Duncan et al., 2011, 2013]. MRS studies have further reported individual differences in higher concentrations of GABA to be inversely correlated to functional connectivity between the putamen and the default mode network during resting‐state [Arrubla et al., 2014]. This, as well as higher GABA levels within the primary motor cortex M1 to be related to lower functional connectivity across the resting motor network [Stagg et al., 2014], an observation again in line with current resting‐state fMRI findings. fMRI‐MRS studies have shown findings of in particular the excitatory‐inhibitory balance between glutamate and GABA levels—rather than one of the two separately—of precuneus cortex to be associated with individual variation in default mode network connectivity [Kapogiannis et al., 2013]. In addition, studies reporting on a modulation of the glutamatergic system by means of pharmacotherapeutic intervention have reported effects on resting‐state functional connectivity, with ketamine (an NMDA receptor antagonist blocking the function of excitatory receptors, having a net inhibitory effect on neural activity) administration resulting in decreased functional connectivity of the default mode network to regions of the dorsal medial prefrontal cortex and the pregenual anterior cingulate cortex [Scheidegger et al., 2012]. Following up on their shown inverse relationship between individual differences in MRS estimates of GABA levels in M1 and motor network functional connectivity, Stagg and colleagues reported on anodal transcranial direct current stimulation (tDCS, by the authors reported to reduce local GABA levels) of primary motor cortex M1 to be related to increased resting‐state functional connectivity within the motor system [Stagg et al., 2014]. Extending these findings our findings now further suggest that cortical variation in excitatory‐inhibitory character across areas may relate to region‐to‐region differences in global resting‐state functional connectivity. Taken together, these findings combined support the notion of the chemoarchitecture of the cerebral cortex to play a potential role in modulating intrinsic global functional connectivity patterns of mammalian cortex.
Neurophysiological investigations into the basis of the fMRI signal have noted hemodynamic signals to be coupled to synaptic processing and neural spiking patterns [Conner et al., 2011; Logothetis, 2002; Logothetis and Wandell, 2004; Niessing et al., 2005], and have in particular concluded the fMRI signal to be related to the input of cortical areas [Logothetis et al., 2001]. While a correlation approach for the derivation of functional connectivity (as used in the current study) cannot make distinctions on the directionality of the functional interactions (i.e., whether region A is projecting to B, or B to A, or both), it is nevertheless interesting and encouraging to note that the receptor architecture of cortical areas—forming the modulation mechanisms of the input to neurons—are related to the resting‐state fMRI signal. Future approaches using advanced techniques that go beyond simplistic correlation approaches and can provide information on the direction of functional interactions by employing techniques such as Granger Causality or Dynamic Causal Modeling [Miao et al., 2011; Stephan and Friston, 2010] might thus further delineate a possible link between cortical chemoarchitecture and the emergence of whole‐brain spontaneous functional connectivity patterns.
Our findings are also interesting to interpret in context of recent studies suggesting an interplay between regional variation in microscale cytoarchitectural features of cortical areas and macroscale global anatomical connectivity. Beul and colleagues reported on the cortical type of cat cortex—classifying cortical areas into five classes based on supragranular laminar structure [Barbas and Rempel‐Clower, 1997; Hilgetag and Grant, 2010]—to interact with macroscale anatomical connectivity [Beul et al., 2014]. Furthermore, in a study on macaque [Scholtens et al., 2014] and human cortex [van den Heuvel et al., 2015b, 2015c] we revealed a positive association between regional variation in microscale cytoarchitectonic complexity of layer three pyramidal neurons and the number of efferent and afferent pathways of cortical areas. Interestingly, earlier multimodal studies reported on potential overlap in chemical and anatomical connectivity organization of motor and visual cortical areas, but did not report on direct associations between chemoarchitecture and the extent of anatomical connectivity of cortical regions across the global brain's network [Kötter et al., 2001]. Combined with our current findings, this tends to speculatively suggest that perhaps not so much the anatomical connectivity of cortical areas, but more their functional connectivity is related to the intrinsic chemoarchitecture of cortical areas. Indeed, in a post hoc analysis we found no direct association between the number of anatomical connections of a cortical area and the ExIn ratio as measured in the macaque (in‐degree: P = 0.23; out‐degree: P = 0.26, connectivity data taken from the Bonin and Bailey anatomical macaque connectome) [Scholtens et al., 2014]. This is further strengthened by a post hoc partial correlation analysis in which ExIn ratio was included as the dependent variable and both functional degree (i.e., number of functional interactions) and structural degree (i.e., number of efferent and afferent structural pathways of a cortical area) were included as independent variables, which revealed a significant effect of functional degree on ExIn (P = 0.0012, partial correlation coefficient =0.8924), but not of structural degree (in‐degree: P = 0.222, out‐degree: P = 0.173). Similar findings were observed for the two human datasets, with anatomical degree derived from analysis of diffusion weighted imaging data from the Human Connectome Project [Van Essen et al., 2013] [see de Reus and van den Heuvel, 2014] and [van den Heuvel et al., 2015b]. Here too, post hoc examinations using partial correlation revealed significant associations between the ExIn ratio and functional degree (human dataset I: P = 0.005, partial correlation coefficient = 0.9624; human dataset II: P = 0.0163, partial correlation coefficient= 0.5727), with no significant contribution from cortical structural degree (human dataset I: P = 0.9037; human dataset II: P = 0.3393).
Several remarks have to be made concerning the interpretation of the shown effects. We have to explicitly note that the spatial coverage of examined regions of human and macaque cortex is relatively limited. Data from autoradiography recordings included highly detailed mapping of receptor levels of cortical areas, including quantitative data on multiple receptors, but the number of cortical regions of which quantitative data could be extracted was still relatively low. Our study thus included “only” data of 7 and respectively 18 cortical areas of the human brain and of 11 regions of macaque cortex. Despite this coarse subsampling of the cortex, all three datasets revealed a positive correlation between the chemoarchitecture of cortical regions and resting‐state BOLD fMRI derived functional connectivity, an association, as we argued above, consistent with earlier reports linking MRS findings to resting‐state network formation. Nevertheless, future studies examining the relationship of resting‐state fMRI connectivity using data of even more complete autoradiography mappings of human cortex are of high interest. In this context, it should also be noted that our study only included the examination of AMPA, M1, M2, and GABAA, as these were consistently reported across humans and macaque, and we aimed for including similar receptors across the three 3 datasets. Future studies examining more and more detailed data including more types of receptor densities (e.g., 5HT2, Kainate, NMDA) and high‐resolution layer‐specific fMRI are of interest.
Our study puts forward a simple, but potentially important association between cortical chemoarchitecture and cortico‐cortical resting‐state functional connectivity. Providing insight into the biological underpinnings of the emergence of interareal functional connectivity, our cross‐modal findings are suggestive of cortical areas with a relatively high excitatory chemoarchitecture to show higher intrinsic resting‐state functional connectivity. Understanding the chemical underpinnings of the resting‐state fMRI signal may provide new leads to the examination of how drug intervention may effect functional (dys)connectivity patterns in the diseased brain.
Supporting information
Supporting Information
Supporting Information Figure 1
Supporting Information Figure 2
ACKNOWLEDGMENT
We thank Marcel de Reus and Ruben Schmidt for help with the anatomical connectivity data and for interesting and inspiring discussions.
REFERENCES
- Adachi Y, Osada T, Sporns O, Watanabe T, Matsui T, Miyamoto K, Miyashita Y (2012): Functional connectivity between anatomically unconnected areas is shaped by collective network‐level effects in the macaque cortex. Cereb Cortex 22:1586–1592. [DOI] [PubMed] [Google Scholar]
- Amunts K, Lenzen M, Friederici AD, Schleicher A, Morosan P, Palomero‐Gallagher N, Zilles K (2010): Broca's region: Novel organizational principles and multiple receptor mapping. PLoS Biol 8:e1000489. [DOI] [PMC free article] [PubMed] [Google Scholar]
- Arrubla J, Tse DH, Amkreutz C, Neuner I, Shah NJ (2014): GABA concentration in posterior cingulate cortex predicts putamen response during resting state fMRI. PLoS One 9:e106609. [DOI] [PMC free article] [PubMed] [Google Scholar]
- Baggio HC, Segura B, Junque C, de Reus MA, Sala‐Llonch R, Van den Heuvel MP (2015): Rich club organization and cognitive performance in healthy older participants. J Cogn Neurosci 27:1801–1810. [DOI] [PubMed] [Google Scholar]
- Barbas H, Rempel‐Clower N (1997): Cortical structure predicts the pattern of corticocortical connections. Cereb Cortex 7:635–646. [DOI] [PubMed] [Google Scholar]
- Barenne J. (1924): Experimental Researches on Sensory Localization in the Cerebral Cortex of the Monkey (Macacus). Proceedings of the Royal Society B: Biological Sciences 96:272–291. [Google Scholar]
- Bassett DS, Bullmore ET, Meyer‐Lindenberg A, Apud JA, Weinberger DR, Coppola R (2009): Cognitive fitness of cost‐efficient brain functional networks. Proc Natl Acad Sci USA 106:11747–11752. [DOI] [PMC free article] [PubMed] [Google Scholar]
- Beul SF, Grant S, Hilgetag CC (2015): A predictive model of the cat cortical connectome based on cytoarchitecture and distance. Brain Struct Funct 220:3167–3184. [DOI] [PMC free article] [PubMed] [Google Scholar]
- Biswal B, Yetkin FZ, Haughton VM, Hyde JS (1995): Functional connectivity in the motor cortex of resting human brain using echo‐planar MRI. Magn Reson Med 34:537–541. [DOI] [PubMed] [Google Scholar]
- Bohlken MM, Mandl RC, Brouwer RM, van den Heuvel MP, Hedman AM, Kahn RS, Hulshoff Pol HE (2014): Heritability of structural brain network topology: A DTI study of 156 twins. Hum Brain Mapp 35:5295–5305. [DOI] [PMC free article] [PubMed] [Google Scholar]
- Cammoun L, Gigandet X, Meskaldji D, Thiran JP, Sporns O, Do KQ, Maeder P, Meuli R, Hagmann P (2011): Mapping the human connectome at multiple scales with diffusion spectrum MRI. J Neurosci Methods 203:386–397. [DOI] [PubMed] [Google Scholar]
- Caspers J, Palomero‐Gallagher N, Caspers S, Schleicher A, Amunts K, Zilles K (2015): Receptor architecture of visual areas in the face and word‐form recognition region of the posterior fusiform gyrus. Brain Struct Funct 220:205–219. [DOI] [PubMed] [Google Scholar]
- Caspers S, Schleicher A, Bacha‐Trams M, Palomero‐Gallagher N, Amunts K, Zilles K (2013): Organization of the human inferior parietal lobule based on receptor architectonics. Cereb Cortex 23:615–628. [DOI] [PMC free article] [PubMed] [Google Scholar]
- Cioli C, Abdi H, Beaton D, Burnod Y, Mesmoudi S (2014): Differences in human cortical gene expression match the temporal properties of large‐scale functional networks. PLoS One 9:e115913. [DOI] [PMC free article] [PubMed] [Google Scholar]
- Cocchi L, Harding IH, Lord A, Pantelis C, Yucel M, Zalesky A (2014): Disruption of structure‐function coupling in the schizophrenia connectome. NeuroImage Clin 4:779–787. [DOI] [PMC free article] [PubMed] [Google Scholar]
- Cole MW, Yarkoni T, Repovs G, Anticevic A, Braver TS (2012): Global connectivity of prefrontal cortex predicts cognitive control and intelligence. J Neurosci 32:8988–8999. [DOI] [PMC free article] [PubMed] [Google Scholar]
- Collin G, Kahn RS, de Reus MA, Cahn W, van den Heuvel MP (2014): Impaired rich club connectivity in unaffected siblings of schizophrenia patients. Schizophr Bull 40:438–448. [DOI] [PMC free article] [PubMed] [Google Scholar]
- Collin G, de Nijs J, Hulshoff Pol HE, Cahn W, van den Heuvel MP. (2015): Connectome organization is related to longitudinal changes in general functioning, symptoms and IQ in chronic schizophrenia. Schizophrenia Research (Epub ahead of print). [DOI] [PubMed] [Google Scholar]
- Conner CR, Ellmore TM, Pieters TA, DiSano MA, Tandon N (2011): Variability of the relationship between electrophysiology and BOLD‐fMRI across cortical regions in humans. J Neurosci 31:12855–12865. [DOI] [PMC free article] [PubMed] [Google Scholar]
- Contractor A, Mulle C, Swanson GT (2011): Kainate receptors coming of age: Milestones of two decades of research. Trends Neurosci 34:154–163. [DOI] [PMC free article] [PubMed] [Google Scholar]
- Davis FC, Knodt AR, Sporns O, Lahey BB, Zald DH, Brigidi BD, Hariri AR (2013): Impulsivity and the modular organization of resting‐state neural networks. Cereb Cortex 23:1444–1452. [DOI] [PMC free article] [PubMed] [Google Scholar]
- De Barenne JD, McCulloch WS (1938): Functional organization in the sensory cortex of the monkey (Macaca mulatta). J Neurophysiol 1:16. [Google Scholar]
- de Reus MA, van den Heuvel MP (2014): Simulated rich club lesioning in brain networks: A scaffold for communication and integration? Front Hum Neurosci 8:647. [DOI] [PMC free article] [PubMed] [Google Scholar]
- Desikan RS, Segonne F, Fischl B, Quinn BT, Dickerson BC, Blacker D, Buckner RL, Dale AM, Maguire RP, Hyman BT, Albert MS, Killiany RJ (2006): An automated labeling system for subdividing the human cerebral cortex on MRI scans into gyral based regions of interest. NeuroImage 31:968–980. [DOI] [PubMed] [Google Scholar]
- Duncan NW, Enzi B, Wiebking C, Northoff G (2011): Involvement of glutamate in rest‐stimulus interaction between perigenual and supragenual anterior cingulate cortex: A combined fMRI‐MRS study. Hum Brain Mapp 32:2172–2182. [DOI] [PMC free article] [PubMed] [Google Scholar]
- Duncan NW, Wiebking C, Tiret B, Marjanska M, Hayes DJ, Lyttleton O, Doyon J, Northoff G (2013): Glutamate concentration in the medial prefrontal cortex predicts resting‐state cortical‐subcortical functional connectivity in humans. PLoS One 8:e60312. [DOI] [PMC free article] [PubMed] [Google Scholar]
- Enzi B, Duncan NW, Kaufmann J, Tempelmann C, Wiebking C, Northoff G (2012): Glutamate modulates resting state activity in the perigenual anterior cingulate cortex—A combined fMRI‐MRS study. Neuroscience 227:102–109. [DOI] [PubMed] [Google Scholar]
- Esslinger C, Walter H, Kirsch P, Erk S, Schnell K, Arnold C, Haddad L, Mier D, Opitz von Boberfeld C, Raab K, Witt SH, Rietschel M, Cichon S, Meyer‐Lindenberg A (2009): Neural mechanisms of a genome‐wide supported psychosis variant. Science 324:605. [DOI] [PubMed] [Google Scholar]
- Fischl B, Dale AM (2000): Measuring the thickness of the human cerebral cortex from magnetic resonance images. Proc Natl Acad Sci USA 97:11050–11055. [DOI] [PMC free article] [PubMed] [Google Scholar]
- Fornito A, Zalesky A, Bassett DS, Meunier D, Ellison‐Wright I, Yucel M, Wood SJ, Shaw K, O'Connor J, Nertney D, Mowry BJ, Pantelis C, Bullmore ET (2011): Genetic influences on cost‐efficient organization of human cortical functional networks. J Neurosci 31:3261–3270. [DOI] [PMC free article] [PubMed] [Google Scholar]
- Fox MD, Raichle ME (2007): Spontaneous fluctuations in brain activity observed with functional magnetic resonance imaging. Nat Rev 8:700–711. [DOI] [PubMed] [Google Scholar]
- Friston KJ, Frith CD, Liddle PF, Frackowiak RS (1993): Functional connectivity: The principal‐component analysis of large (PET) data sets. J Cereb Blood Flow Metab 13:5–14. [DOI] [PubMed] [Google Scholar]
- Glahn DC, Winkler AM, Kochunov P, Almasy L, Duggirala R, Carless MA, Curran JC, Olvera RL, Laird AR, Smith SM, Beckmann CF, Fox PT, Blangero J (2010): Genetic control over the resting brain. Proc Natl Acad Sci USA 107:1223–1228. [DOI] [PMC free article] [PubMed] [Google Scholar]
- Hagmann P, Cammoun L, Gigandet X, Meuli R, Honey CJ, Wedeen VJ, Sporns O (2008): Mapping the structural core of human cerebral cortex. PLoS Biol 6:e159. [DOI] [PMC free article] [PubMed] [Google Scholar]
- Hilgetag CC, Grant S (2010): Cytoarchitectural differences are a key determinant of laminar projection origins in the visual cortex. NeuroImage 51:1006–1017. [DOI] [PubMed] [Google Scholar]
- Honey CJ, Sporns O, Cammoun L, Gigandet X, Thiran JP, Meuli R, Hagmann P (2009): Predicting human resting‐state functional connectivity from structural connectivity. Proc Natl Acad Sci USA 106:2035–2040. [DOI] [PMC free article] [PubMed] [Google Scholar]
- Horwitz B (2004): Relating fMRI and PET signals to neural activity by means of large‐scale neural models. Neuroinformatics 2:251–266. [DOI] [PubMed] [Google Scholar]
- Jahanshad N, Rajagopalan P, Hua X, Hibar DP, Nir TM, Toga AW, Jack CR Jr, Saykin AJ, Green RC, Weiner MW, Medland SE, Montgomery GW, Hansell NK, McMahon KL, de Zubicaray GI, Martin NG, Wright MJ, Thompson PM, Alzheimer's Disease Neuroimaging I (2013): Genome‐wide scan of healthy human connectome discovers SPON1 gene variant influencing dementia severity. Proc Natl Acad Sci USA 110:4768–4773. [DOI] [PMC free article] [PubMed] [Google Scholar]
- Kandel ER, Schwartz JH, Jessell TM. (2000): Principles of neural science: McGraw‐hill; New York. [Google Scholar]
- Kapogiannis D, Reiter DA, Willette AA, Mattson MP (2013): Posteromedial cortex glutamate and GABA predict intrinsic functional connectivity of the default mode network. NeuroImage 64:112–119. [DOI] [PMC free article] [PubMed] [Google Scholar]
- Kong, F. , Liu, L. , Wang, X. , Hu, S. , Song, Y. , Liu, J. (2015) Different neural pathways linking personality traits and eudaimonic well‐being: A resting‐state functional magnetic resonance imaging study. Cogn Affect Behav Neurosci 15:299–309. [DOI] [PubMed] [Google Scholar]
- Kötter R, Stephan KE, Palomero‐Gallagher N, Geyer S, Schleicher A, Zilles K (2001): Multimodal characterisation of cortical areas by multivariate analyses of receptor binding and connectivity data. Anatomy Embryol 204:333–350. [DOI] [PubMed] [Google Scholar]
- Kötter R, Maier J, Margas W, Zilles K, Schleicher A, Bozkurt A (2007): Databasing receptor distributions in the brain. Methods Mol Biol 401:267–284. [DOI] [PubMed] [Google Scholar]
- Kunisato Y, Okamoto Y, Okada G, Aoyama S, Nishiyama Y, Onoda K, Yamawaki S (2011): Personality traits and the amplitude of spontaneous low‐frequency oscillations during resting state. Neurosci Lett 492:109–113. [DOI] [PubMed] [Google Scholar]
- Logothetis NK (2002): The neural basis of the blood‐oxygen‐level‐dependent functional magnetic resonance imaging signal. Philo Trans R Soc London 357:1003–1037. [DOI] [PMC free article] [PubMed] [Google Scholar]
- Logothetis NK, Wandell BA (2004): Interpreting the BOLD signal. Annu Rev Physiol 66:735–769. [DOI] [PubMed] [Google Scholar]
- Logothetis NK, Pauls J, Augath M, Trinath T, Oeltermann A (2001): Neurophysiological investigation of the basis of the fMRI signal. Nature 412:150–157. [DOI] [PubMed] [Google Scholar]
- Lynall ME, Bassett DS, Kerwin R, McKenna PJ, Kitzbichler M, Muller U, Bullmore E (2010): Functional connectivity and brain networks in schizophrenia. J Neurosci 30:9477–9487. [DOI] [PMC free article] [PubMed] [Google Scholar]
- Mantini D, Gerits A, Nelissen K, Durand JB, Joly O, Simone L, Sawamura H, Wardak C, Orban GA, Buckner RL, Vanduffel W (2011): Default mode of brain function in monkeys. J Neurosci 31:12954–12962. [DOI] [PMC free article] [PubMed] [Google Scholar]
- Mantini D, Corbetta M, Romani GL, Orban GA, Vanduffel W (2013): Evolutionarily novel functional networks in the human brain? J Neurosci 33:3259–3275. [DOI] [PMC free article] [PubMed] [Google Scholar]
- Miao X, Wu X, Li R, Chen K, Yao L (2011): Altered connectivity pattern of hubs in default‐mode network with Alzheimer's disease: An Granger causality modeling approach. PLoS One 6:e25546. [DOI] [PMC free article] [PubMed] [Google Scholar]
- Niessing J, Ebisch B, Schmidt KE, Niessing M, Singer W, Galuske RA (2005): Hemodynamic signals correlate tightly with synchronized gamma oscillations. Science 309:948–951. [DOI] [PubMed] [Google Scholar]
- Park HJ, Friston K (2013): Structural and functional brain networks: From connections to cognition. Science 342:1238411. [DOI] [PubMed] [Google Scholar]
- Power JD, Barnes KA, Snyder AZ, Schlaggar BL, Petersen SE (2012): Spurious but systematic correlations in functional connectivity MRI networks arise from subject motion. NeuroImage 59:2142–2154. [DOI] [PMC free article] [PubMed] [Google Scholar]
- Rubinov M, Sporns O (2010): Complex network measures of brain connectivity: Uses and interpretations. NeuroImage 52:1059–1069. [DOI] [PubMed] [Google Scholar]
- Scheidegger M, Walter M, Lehmann M, Metzger C, Grimm S, Boeker H, Boesiger P, Henning A, Seifritz E (2012): Ketamine decreases resting state functional network connectivity in healthy subjects: Implications for antidepressant drug action. PLoS One 7:e44799. [DOI] [PMC free article] [PubMed] [Google Scholar]
- Scholtens LH, de Reus M., van den Heuvel MP (2015): Linking contemporary high resolution magnetic resonance imaging to the von economo legacy: A study on the comparison of MRI cortical thickness and histological measurements of cortical structure. Hum Brain Mapp 36:3038–3046. [DOI] [PMC free article] [PubMed] [Google Scholar]
- Scholtens LH, Schmidt R, de Reus MA, van den Heuvel MP (2014): Linking Macroscale Graph Analytical Organization to Microscale Neuroarchitectonics in the Macaque Connectome. J Neurosci 34:12192–12205. [DOI] [PMC free article] [PubMed] [Google Scholar]
- Shmuel A, Leopold DA (2008): Neuronal correlates of spontaneous fluctuations in fMRI signals in monkey visual cortex: Implications for functional connectivity at rest. Hum Brain Mapp. 29:751–761. [DOI] [PMC free article] [PubMed] [Google Scholar]
- Stagg CJ, Bachtiar V, Amadi U, Gudberg CA, Ilie AS, Sampaio‐Baptista C, O'Shea J, Woolrich M, Smith SM, Filippini N, Near J, Johansen‐Berg H (2014): Local GABA concentration is related to network‐level resting functional connectivity. eLife 3:e01465. [DOI] [PMC free article] [PubMed] [Google Scholar]
- Stephan KE, Friston KJ (2010): Analyzing effective connectivity with fMRI. Wiley Interdiscip Rev Cogn Sci 1:446–459. [DOI] [PMC free article] [PubMed] [Google Scholar]
- Stephan KE, Hilgetag CC, Burns GA, O'Neill MA, Young MP, Kötter R (2000): Computational analysis of functional connectivity between areas of primate cerebral cortex. Philos Trans R Soc London 355:111–126. [DOI] [PMC free article] [PubMed] [Google Scholar]
- Turk E, Scholtens LH, van den Heuvel MP (2016): Cortical chemoarchitecture shapes macroscale stimulating functional connectivity patterns in macaque cerebral cortex. Hum Brain Mapp 37:1856–1865. [DOI] [PMC free article] [PubMed] [Google Scholar]
- van den Heuvel MP, Hulshoff Pol HE (2010a): Exploring the brain network: A review on resting‐state fMRI functional connectivity. Eur Neuropsychopharmacol 20:519–534. [DOI] [PubMed] [Google Scholar]
- van den Heuvel MP, Hulshoff Pol HE (2010b): Specific somatotopic organization of functional connections of the primary motor network during resting state. Hum Brain Mapp 31:631–644. [DOI] [PMC free article] [PubMed] [Google Scholar]
- van den Heuvel MP, Sporns O (2013a): An anatomical infrastructure for integration between functional networks in human cerebral cortex. J Neurosci 33:11. [DOI] [PMC free article] [PubMed] [Google Scholar]
- van den Heuvel MP, Sporns O (2013b): Network hubs in the human brain. Trends Cogn Sci 17:683–696. [DOI] [PubMed] [Google Scholar]
- van den Heuvel MP, Stam CJ, Kahn RS, Hulshoff Pol HE (2009): Efficiency of functional brain networks and intellectual performance. J Neurosci 29:7619–7624. [DOI] [PMC free article] [PubMed] [Google Scholar]
- van den Heuvel MP, Sporns O, Collin G, Scheewe T, Mandl RC, Cahn W, Goni J, Hulshoff Pol HE, Kahn RS (2013a): Abnormal rich club organization and functional brain dynamics in schizophrenia. JAMA Psychiatry 70:783–792. [DOI] [PubMed] [Google Scholar]
- van den Heuvel MP, van Soelen IL, Stam CJ, Kahn RS, Boomsma DI, Hulshoff Pol HE (2013b): Genetic control of functional brain network efficiency in children. Eur Neuropsychopharmacol 23:19–23. [DOI] [PubMed] [Google Scholar]
- van den Heuvel MP, de Reus MA, Feldman Barrett L, Scholtens LH, Coopmans FMT, SChmidt R, Preuss TM, Rilling JK, Li L (2015a): Comparison of diffusion tractography and tract‐tracing measures of connectivity strength in rhesus macaque connectome. Hum Brain Mapp 36:3064–3075. [DOI] [PMC free article] [PubMed] [Google Scholar]
- van den Heuvel MP, Scholtens LH, de Reus MA, Kahn RS (2015b): Associated Microscale Spine Density and Macroscale Connectivity Disruptions in Schizophrenia. Biological psychiatry (Epub ahead of print). [DOI] [PubMed] [Google Scholar]
- van den Heuvel MP, Scholtens LH, Feldman Barrett L, Hilgetag CC, de Reus MA (2015c): Bridging cytoarchitectonics and connectomics in human cerebral cortex. J Neurosci 35:13943–13948. [DOI] [PMC free article] [PubMed] [Google Scholar]
- van den Heuvel MP, Bullmore ET, Sporns O (2016): Comparative connectomics. Trends in Cognitive Sciences. 20:345–361. [DOI] [PubMed] [Google Scholar]
- Van Essen DC, Smith SM, Barch DM, Behrens TE, Yacoub E, Ugurbil K (2013): The WU‐Minn human connectome project: An overview. NeuroImage 80:62–79. [DOI] [PMC free article] [PubMed] [Google Scholar]
- Vanduffel W, Fize D, Mandeville JB, Nelissen K, Van Hecke P, Rosen BR, Tootell RBH, Orban GA (2001): Visual motion processing investigated using contrast agent‐enhanced fMRI in awake behaving monkeys. Neuron 32:565–577. [DOI] [PubMed] [Google Scholar]
- von Bonin G, Bailey P (1947): The neocortex of Macaca mulatta. Urbana: Univ. of Illinois Press. Champaign, USA. [Google Scholar]
- Walker A (1940): Cytoarchitectural study of the prefrontal area of the macaque monkey. J Comp Neurol 73:27. [Google Scholar]
- Zilles K, Amunts K (2009): Receptor mapping: Architecture of the human cerebral cortex. Curr Opin Neurol 22:331–339. [DOI] [PubMed] [Google Scholar]
- Zilles K, Bacha‐Trams M, Palomero‐Gallagher N, Amunts K, Friederici AD (2015): Common molecular basis of the sentence comprehension network revealed by neurotransmitter receptor fingerprints. Cortex 63:79–89. [DOI] [PMC free article] [PubMed] [Google Scholar]
- Zilles K, Palomero‐Gallagher N, Grefkes C, Scheperjans F, Boy C, Amunts K, Schleicher A (2002): Architectonics of the human cerebral cortex and transmitter receptor fingerprints: Reconciling functional neuroanatomy and neurochemistry. Eur Neuropsychopharmacol 12:587–599. [DOI] [PubMed] [Google Scholar]
Associated Data
This section collects any data citations, data availability statements, or supplementary materials included in this article.
Supplementary Materials
Supporting Information
Supporting Information Figure 1
Supporting Information Figure 2