

Abstract
1. Scope
Obesity is closely related to the imbalance of white adipose tissue storing excess calories, and brown adipose tissue dissipating energy to produce heat in mammals. Recent studies revealed that acquisition of brown characteristics by white adipocytes, termed “browning,” may positively contribute to cellular bioenergetics and metabolism homeostasis. The goal was to investigate the putative effects of natural antioxidant sulforaphane (1‐isothiocyanate‐4‐methyl‐sulfonyl butane; SFN) on browning of white adipocytes.
2. Methods and results
3T3‐L1 mature white adipocytes were treated with SFN for 48 h, and then the mitochondrial content, function, and energy utilization were assessed. SFN was found to induce 3T3‐L1 adipocytes browning based on the increased mitochondrial content and activity of respiratory chain enzymes, whereas the mechanism involved the upregulation of nuclear factor E2‐related factor 2/sirtuin1/peroxisome proliferator activated receptor gamma coactivator 1 alpha signaling. SFN enhanced uncoupling protein 1 expression, a marker for brown adipocyte, leading to the decrease in cellular ATP. SFN also enhanced glucose uptake and oxidative utilization, lipolysis, and fatty acid oxidation in 3T3‐L1 adipocytes.
3. Conclusion
SFN‐induced browning of white adipocytes enhanced the utilization of cellular fuel, and application of SFN is a promising strategy to combat obesity and obesity‐related metabolic disorder.
Keywords: Adipocyte browning, Glucose metabolism, Lipid metabolism, Mitochondria, Sulforaphane
Abbreviations
- 2‐NBDG
2‐(N‐(7‐nitrobenz‐2‐oxa‐1,3‐diazol‐4‐yl)amino)‐2‐deoxyglucose
- ACC
acetyl‐coA carboxylase
- ARE
antioxidant response element
- ATGL
adipose triacylglyceride lipase
- CPT1A
carnitine palmitoyltransferase 1A
- CS
citrate synthase
- DAG
diacylglycerol
- DGAT‐1
diacylglycerol acyl transferase
- FA
fatty acid
- FAS
fatty acid synthase
- GCK
glucokinase
- GLUT‐4
glucose transporter type 4
- HSL
hormone‐sensitive lipase
- INS
insulin
- NRF‐1
nuclear respiratory factor 1
- Nrf2
nuclear factor E2‐related factor 2
- PKA
protein kinase A
- Plin
perilipin
- PVDF
polyvinylidenedifluoride
- SFN
sulforaphane
- Sirt‐1/PGC‐1α
sirtuin1/peroxisome proliferator activated receptor gamma coactivator 1 alpha
- TG
triacylglyceride
- UCP1
uncoupling protein 1
- WAT
white adipose tissue
1. Introduction
Mammals have two types of adipose tissue: white adipose tissue (WAT) and brown adipose tissue, which are mainly composed of white adipocytes and brown adipocytes, respectively. The abnormal accumulation of WAT in obese patients is caused by an imbalance in energy intake and energy expenditure, and is thought to be a bridge between obesity and its related complications, such as type 2 diabetes and cardiovascular disease 1. White adipocytes are specialized to store excess energy in the form of triacylglycerols, and as an important endocrine organ, WAT directly modulates metabolism by secreting various adipokines. In contrast, brown adipocytes, which are characterized by a large number of mitochondria containing uncoupling protein 1 (UCP1), directly dissipate calories as heat via uncoupling of the electron transport chain from ATP synthesis 2. In recent years, inducible beige adipocytes have been found within WAT in response to cold or β‐adrenergic stimulation 3, 4. This novel type of adipocytes shares biochemical features, such as displaying multilocular lipid droplets and comparable levels of UCP1 protein, and thermogenic potential that is similar to classical brown adipocytes; therefore, these adipocytes have been termed “beige” adipocytes. The inducibility of beige adipocytes via pharmacological and nutritional intervention positions these cells as an attractive target of obesity therapeutics 5. The process of conversion of white adipocytes into beige adipocytes is called “browning,” and recent research has increasingly become focused on understanding this browning of adipose tissue. As adipose tissue plays an important role in the uptake and utilization of glucose and lipids, whole‐body metabolism disorder is closely related to adipose tissue dysfunction; however, cellular evidence that browning influences glucose and lipid metabolism in adipocytes is lacking.
The transcription factor nuclear factor E2‐related factor 2 (Nrf2)/antioxidant response element (ARE) pathway defends cells against elevated oxidative damage. Recent data have clearly shown that energy metabolism is linked to cellular redox balance control at the nuclear level via Nrf2, and activation of the Nrf2‐ARE pathway allows for elevated energy utilization. For instance, acetyl‐l‐carnitine was reported to induce mitochondrial biogenesis in an Nrf2‐dependent manner 6. In addition, mice treated with the potent Nrf2 inducer CDDO‐IM exhibit higher energy expenditure compared with untreated mice when fed a high‐fat diet 7. These findings suggest the possibility that other dietary Nrf2 activators, such as sulforaphane (SFN), may also have effects on cellular energy expenditure. SFN, which is a major isothiocyanate present in broccoli and other cruciferous vegetables, exhibits potent antioxidant, Nrf2 agonist, and anticancer effects. The role of SFN in obesity therapy, however, remains unclear.
Here, we investigated the effect of SFN on mitochondrial biogenesis, UCP1 expression, and mitochondrial function in mature 3T3‐L1 adipocytes in order to elucidate the underlying mechanism. Moreover, we also analyzed the glucose and lipid metabolism in SFN‐treated 3T3‐L1 adipocytes. Our data revealed that SFN induces the browning of 3T3‐L1 white adipocytes by promoting mitochondrial biogenesis via upregulation of sirtuin1/peroxisome proliferator activated receptor gamma coactivator 1 alpha (Sirt‐1/PGC‐1α) signaling and enhancement of mitochondrial function. Furthermore, these results also demonstrate that glucose uptake and oxidative utilization, lipolysis, and fatty acid (FA) oxidation are upregulated in SFN‐treated 3T3‐L1 adipocytes. In sum, our results clearly identify SFN as a potential agent for protecting against obesity and the related glucose and lipid metabolism disorders by the induction of adipocyte browning.
2. Materials and methods
2.1. Materials
3T3‐L1 cells were obtained from the American Type Culture Collection (Manassas, VA, USA). d, l‐SFN was purchased from Toronto Research Chemical, Inc. (Toronto, Canada). The details of the remaining reagents can be found in the Supporting Information.
2.2. Cell culture and adipocyte differentiation
Murine 3T3‐L1 preadipocytes were induced to differentiate into mature adipocytes by classic cocktail method. Various concentrations of SFN (0, 0.2, 0.5, 1, 5, and 10 μM) were used to treat the mature adipocytes. The detailed method can be found in the Supporting Information.
2.3. Oil Red O staining
Oil Red O staining was used to assess mature adipocytes and measure the lipid content in these cells. The detailed method can be found in the Supporting Information.
2.4. Mitochondrial mass measurement
The matured 3T3‐L1 adipocytes were treated with SFN or left untreated for 48 h; MitoTracker Green FM (Beyotime Biotechnology, Jiangsu, China), a mitochondria‐specific dye, was used to determine the mitochondrial mass. The detailed method can be found in the Supporting Information.
2.5. Electron microscopy
Fully differentiated adipocytes were treated with 1 μM SFN or left untreated for 48 h. After a series of treatment, the mitochondria number and the total cytoplasmic area in cells were determined under electron microscopy. The detailed method can be found in the Supporting Information.
2.6. Citrate synthase activity detection
Citrate synthase (CS) activity of adipocytes was measured using the kit available from Sigma, the detailed method can be found in the Supporting Information.
2.7. Mitochondrial complex I activity measurement
Mature adipocytes, grown in 60‐mm culture dishes, were treated with SFN for 48 h, and mitochondrial complex I activity was measured using the complex I enzyme activity microplate assay kit. The detailed method can be found in the Supporting Information.
2.8. Glucose uptake analysis
The fluorescent d‐glucose analog 2‐(N‐(7‐nitrobenz‐2‐oxa‐1,3‐diazol‐4‐yl)amino)‐2‐deoxyglucose (2‐NBDG) was used as a fluorescent indicator to evaluate glucose uptake in adipocytes treated with SFN for 48 h. The fluorescence intensity at 465 nm was read using a fluorescent microplate reader to quantitate glucose uptake after 2‐NBDG incubation. The detailed method can be found in the Supporting Information.
2.9. Lipolysis assay
The release of glycerol into the culture media was detected using glycerol colorimetric assay kit to evaluate the effect of SFN on lipolysis of adipocytes. The detailed method can be found in the Supporting Information.
2.10. Real‐time quantitative PCR
3T3‐L1 adipocytes were treated with SFN or left untreated for 48 h. Total RNA was isolated from 3T3‐L1 mature adipocytes, and then real‐time quantitative PCR analysis was used to evaluate the relative mRNA levels of acetyl‐CoA carboxylase (ACC) and fatty acid synthase (FAS). The detailed method can be found in the Supporting Information.
2.11. Western blot analysis
Mature adipocytes were treated with SFN or left untreated for 48 h, and the levels of indicated proteins were measured by Western blot. The detailed method can be found in the Supporting Information.
2.12. Intracellular ATP determination
CellTiter‐GloLuminescent Cell Viability Assay system (Promega Corporation, Beijing, China) was used to detect the levels of ATP in adipocytes treated with or without SFN for 48 h. ATP level was presented as relative light unit (RLU) adjusted by cell number for either control or SFN‐treated cells. The detailed method can be found in the Supporting Information.
2.13. Statistical analysis
All data are representative of at least three independent experiments. Data are expressed as means ± SD. Statistical evaluation was performed using one‐way ANOVA with the Students–Newman–Keuls test. p Values of less than 0.05 were considered statistically significant.
3. Results
3.1. SFN increases adipocyte mitochondrial biogenesis in association with regulation of the Nrf2/Sirt‐1/PGC‐1α pathway
Ten days after differentiation (D10) was initiated, >95% of 3T3‐L1 preadipocytes were mature adipocytes containing Oil Red O positive lipid droplets. The mature adipocytes were then treated with SFN (0, 0.2, 0.5, 1, 5, and 10 μM) for 48 h. To accurately assess the mitochondrial content, MitoTracker Green FM was used to stain mitochondria in live cells. SFN treatment resulted in an increase in fluorescence intensity, with a maximum in adipocytes treated with 1 μM SFN (Fig. 1A). To further confirm the beneficial effects of SFN on mitochondrial biogenesis, we examined adipocyte morphology in more detail using electron microscopy (Fig. 1B). Quantitative analysis showed that SFN (1 μM) treatment caused a significant increase in mitochondrial intensity (i.e., the average number of mitochondria in the total cytoplasmic area per cell) compared with control treatment (Fig. 1C; p < 0.05). We also examined the Sirt‐1/PGC‐1α pathway to clarify the underlying mechanism for the increased mitochondrial biogenesis. Sirt‐1 was significantly increased in SFN‐treated adipocytes (Fig. 2; p < 0.05). Interestingly, Sirt‐1 protein expression was most enhanced in adipocytes treated with 1 μM SFN. PGC‐1α, a downstream target of Sirt‐1, was also significantly increased in the adipocytes treated with SFN (0, 0.2, 0.5, 1, 5, and 10 μM; p < 0.05). Furthermore, the level of nuclear respiratory factor 1 (NRF‐1) protein, which is a downstream target of PGC‐1α, significantly increased, similar to PGC‐1α (p < 0.05). In addition, SFN treatment markedly increased the Nrf2 protein level (p < 0.05).
Figure 1.
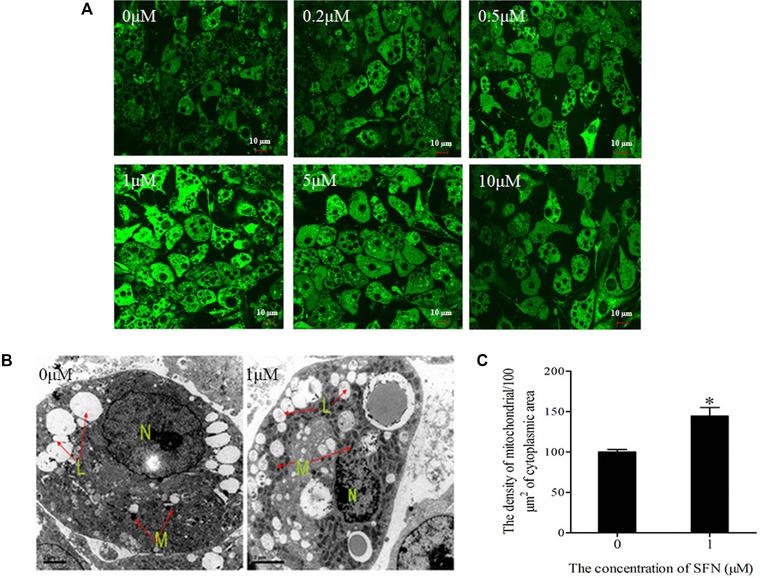
Effect of SFN on the mitochondrial content of mature 3T3‐L1 adipocyte. The cells were treated with 0, 0.2, 0.5, 1, 5, and 10 μM SFN for 48 h. (A) The mitochondrial mass was obtained using the Mitotracker Green stain (magnification, ×60). (B) The mitochondrial ultrastructure image was generated using a transmission electron microscope (magnification, ×5,000). (C) The mitochondria density in adipocytes was detected using a transmission electron microscope. Values indicate means ± SD of six cells. *p < 0.05 compared with the control.
Figure 2.
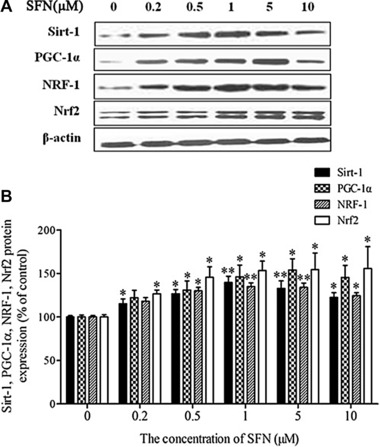
Effects of SFN on the expression of Sirt‐1, PGC‐1α, NRF‐1, and Nrf2 in 3T3‐L1 mature adipocytes treated with the indicated concentrations of SFN for 48 h. (A) Representative Western blots. (B) Relative quantitative analysis of proteins. Results are presented as percentages relative to control cells. Data are shown as means ± SD of three independent experiments. *p < 0.05, **p < 0.01 compared with the control.
3.2. SFN increases adipocyte mitochondrial activity and the expression of UCP1
To confirm whether the increased mitochondrial biogenesis was associated with elevated mitochondrial activity, we first examined the effect of SFN on CS, a marker of mitochondrial aerobic capacity. As shown in Fig. 3A, SFN treatment markedly increased the activity of CS with maximum enzyme activity observed at an SFN concentration of 1 μM. Similarly, SFN also significantly elevated the activity of mitochondrial complex I on the respiratory chain (p < 0.05; Fig. 3B). To further evaluate mitochondrial function, the level of intracellular ATP was also measured. Accordingly, SFN induced a decrease in the ATP level (Fig. 3C). Next, Western blot analysis revealed that the expression of UCP1, a specific brown adipocyte protein, in 3T3‐L1 white adipocytes exposed to SFN was markedly induced (p < 0.05) with a maximal UCP1 protein expression at 1 μM SFN (Fig. 4).
Figure 3.
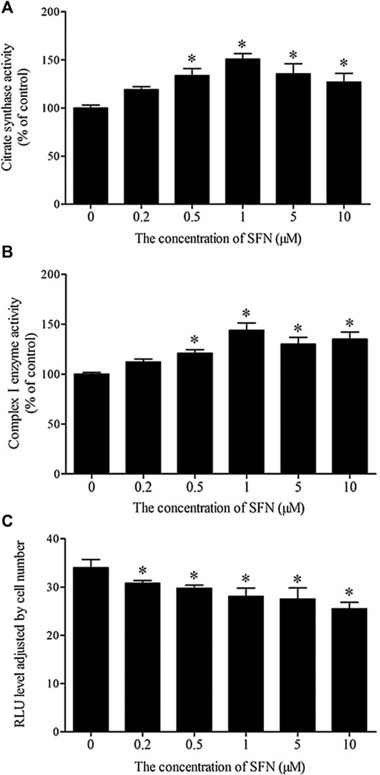
Effect of SFN on mitochondrial function. Mature 3T3‐L1 adipocytes were treated with the indicated concentrations of SFN for 48 h. (A) CS enzyme activity. (B) Mitochondrial complex I activity. (C) The intracellular ATP level. Results are presented as percentages relative to control. Values are means ± SD of three experiments. *p < 0.05 compared with control.
Figure 4.
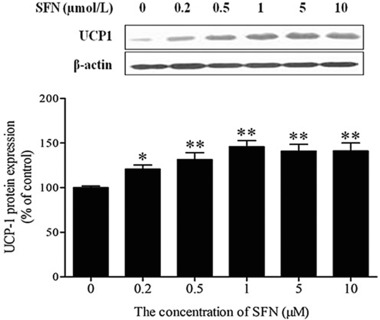
Effects of SFN on the expression of UCP1 in mature 3T3‐L1 adipocytes treated with SFN for 48 h. Upper: representative Western blot. Lower: quantification of UCP 1 protein expression. Results are presented as percentages relative to the control. Data are means ± SD of three independent experiments. *p < 0.05, **p < 0.01 compared with the control.
3.3. SFN stimulates glucose uptake, enhanced glucose aerobic oxidation related gene expression and inhibits de novo FA synthesis related gene expression
The fluorescent nontoxic d‐glucose analog 2‐NBDG is commonly used as a probe indicator for the rapid and direct detection of glucose uptake into cells. Thus, we employed 2‐NBDG for the detection of glucose uptake in mature 3T3‐L1 adipocytes exposed to different doses of SFN for 48 h. The fluorescence intensity of 2‐NBDG was qualitatively and quantitatively measured using confocal microscopy and a multifunctional microplate reader, respectively. Confocal microscopy revealed that SFN induced glucose uptake in adipocytes, with a maximum in adipocytes treated with 1 μM SFN (Fig. 5A). The quantitative results confirmed this trend (Fig. 5B). Additionally, glucose transporter type 4 (GLUT‐4) is a glucose transporter expressed in adipose tissue and is responsible for the transport of glucose into adipocytes. SFN treatment markedly increased the expression of GLUT‐4 (Fig. 5C). After being transported into adipocytes, glucose is normally converted into pyruvate via the glycolytic pathway mediated by hexokinase or glucokinase (GCK), while pyruvate is subsequently transferred into the mitochondria for conversion into acetyl‐CoA. Most of the acetyl‐CoA enters the tricarboxylic acid cycle to generate energy via the action of CS. Conversely, acetyl‐CoA that is derived from glucose and FA oxidation may return to the cytosol to participate in de novo synthesis of FAs via key enzymes, such as ACC and FAS. In this study, the protein and mRNA levels of key enzymes involved in glucose aerobic oxidation, including GCK and CS, as well as key enzymes involved in FA synthesis, such as ACC and FAS, were measured in 3T3‐L1 adipocytes using Western blot and real‐time quantitative PCR, respectively; this was done in order to examine the mechanism used by SFN to direct the metabolic fate of glucose in cells. Results of Western blotting showed that the levels of GCK and CS, indispensable to glucose oxidation, were significantly upregulated in beige adipocytes induced by SFN (Fig. 5C; p < 0.05),while real‐time PCR indicated that the expression of ACC and FAS genes, key enzymes involved in endogenous synthesis of FAs was significantly inhibited (Fig. 5D).
Figure 5.
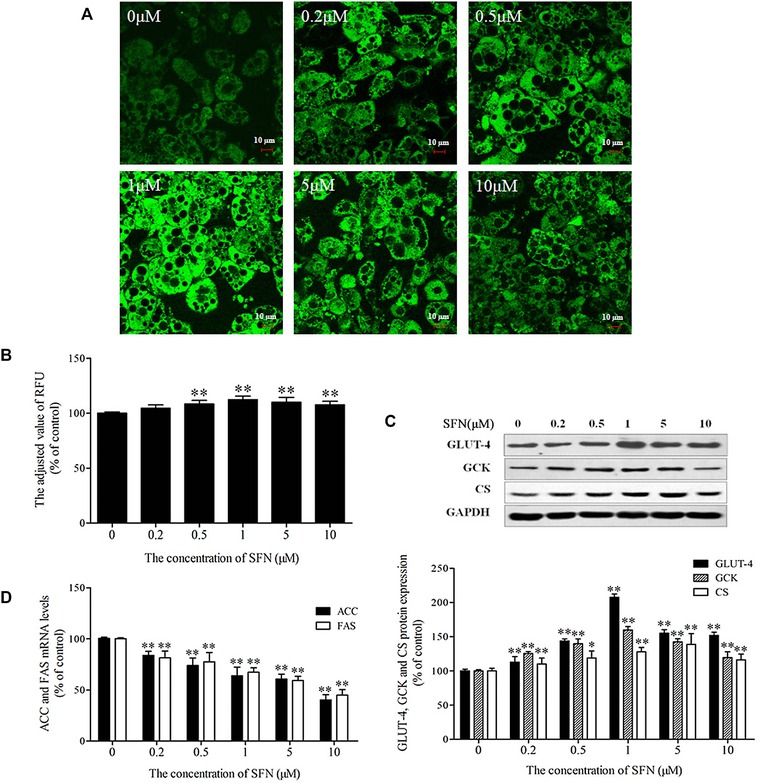
Effect of SFN on glucose uptake, aerobic oxidation, and de novo FA synthesis in 3T3‐L1 adipocytes. Mature adipocytes were incubated in the presence of 0–10 μM SFN for 48 h. Glucose uptake was monitored using 2‐NBDG as a fluorescent probe. (A) Representative images of glucose uptake were captured by confocal microscopy. (B) Quantitative analysis of fluorescence intensity was determined using multifunctional microplate reader. (C) Expressions of membrane protein GLUT‐4 and glucose oxidative metabolism enzymes GCK and CS were measured using Western blot. Upper: representative Western blot. Lower: quantification of proteins levels. (D) The mRNA levels of the de novo FA synthesis enzymes ACC and FAS were determined by real‐time quantitative PCR. Results are presented as percentages relative to the control. Data are means ± SD of three independent experiments. *p < 0.05, **p < 0.01 compared with the control.
3.4. SFN increases lipolysis, elevates the expression of genes responsible for FA oxidation, and decreases the protein level associated with triacylglyceride synthesis
The effect of SFN on lipolysis in 3T3‐L1 adipocytes was measured by quantifying the intracellular lipid content using Oil Red O staining and by monitoring the output of glycerol into the medium. SFN triggered an increase of lipolysis depicted by a bell‐shaped curve with a minimal lipid content corresponding to 1 and 5 μM SFN (Fig. 6A and B) and a maximal glycerol release corresponding to 1 μM SFN (Table 1, Fig. 6C). Further, the expression of lipid metabolism related enzymes in adipocytes was examined. Triacylglyceride (TG) is the main storage lipid in adipocytes. Lipolysis is a step‐wise process regulated by perilipin (Plin), adipose triacylglyceride lipase (ATGL), and hormone‐sensitive lipase (HSL). Plin is exclusively located on the surface layer of intracellular lipid droplets within adipocytes, and functions to protect lipid storage droplets. ATGL initiates the hydrolysis of TG into diacylglycerol (DAG) and free FAs, while HSL subsequently catalyzes the release of one additional FA from DAG. Our results demonstrated that both Plin and HSL protein expression in SFN‐treated adipocytes was significantly decreased compared with the levels in untreated adipocytes (p < 0.01), whereas ATGL protein levels were not significantly elevated, although a tendency for levels to increase was noted (Fig. 7). Phosphorylation of HSL at Ser 563 and Ser 660, as stimulated by protein kinase A (PKA), led to HSL translocation to the surface of lipid droplets to promote lipolysis; however, HSL phosphorylation at Ser 565 prevents phosphorylation of HSL at Ser 563 8. In our study, SFN increased phosphorylation of HSL at Ser 563 and Ser 660 and decreased phosphorylation at Ser 565. Therefore, these findings suggest that in SFN‐induced beige adipocytes, lipolysis is primarily mediated by Plin and HSL. Enhanced lipolysis of adipocytes may lead to an increase of free FA release, and excess circulating free FAs from the lipolysis of TG stored in white adipocytes are harmful even at relatively low concentrations, resulting in stimulation of macrophages and ultimately inflammation 9.
Figure 6.
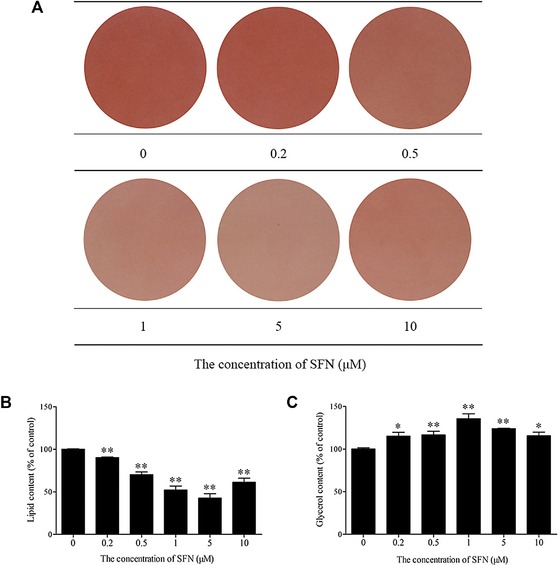
Lipolysis was analyzed in adipocytes treated with the indicated concentrations of SFN for 48 h. (A) Representative image of Oil Red O staining. (B) The lipid content was quantified via detection of absorbance at 510 nm. (C) The glycerol content was used to reflect the level of lipolysis in adipocytes. *p < 0.05, **p < 0.01 compared with the control.
Table 1.
Glycerol output of 3T3‐L1 adipocytes treated with SFN ()
| SFN (μM) | Glycerol content (mM) |
|---|---|
| 0 | 0.798 ± 0.042 |
| 0.2 | 0.913 ± 0.060* |
| 0.5 | 0.921 ± 0.056† |
| 1.0 | 1.032 ± 0.045† |
| 5.0 | 0.966 ± 0.017† |
| 10.0 | 0.916 ± 0.056* |
The results are presented as means ± SD of three independent experiments.
*p < 0.05, † p < 0.01, compared with control.
Figure 7.
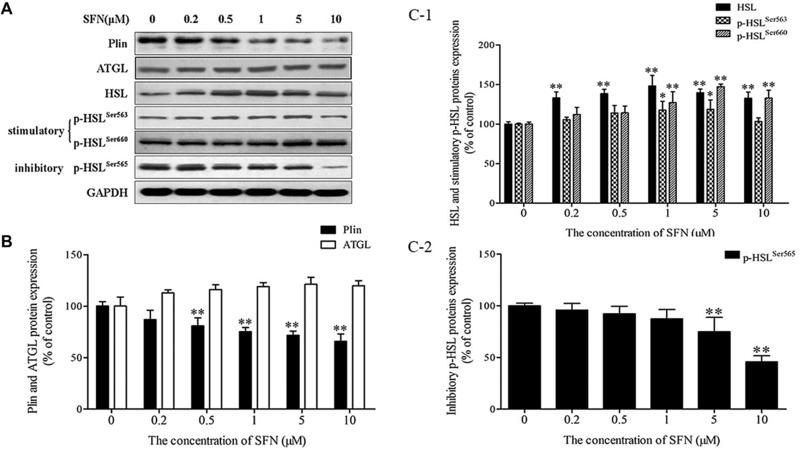
Effect of SFN on expression of lipolysis‐related enzymes in adipocytes. Mature adipocytes were treated with indicated doses of SFN for 48 h. Total protein extracts were prepared, and levels of ATGL, Plin, HSL, p‐HSLSer563, p‐HSLSer565, and p‐HSLSer660 were analyzed by Western blot. (A) Representative image of Western blot. (B–C) Relative quantification of protein levels. Results are presented as the percentages relative to the control. The results are presented as means ± SD of three independent experiments. *p < 0.05, **p < 0.01 compared with the control.
Therefore, an increase in the aerobic oxidation of FAs in adipocytes will be helpful in inhibiting the influx of free FAs into the bloodstream. Carnitine palmitoyltransferase 1A (CPT1A) and CS are key enzymes responsible for the aerobic oxidation of FAs. CPT1A is responsible for shuttling long‐chain FAs into mitochondria, whereas CS functions to initiate the tricarboxylic acid cycle. In the present study, SFN treatment for 48 h induced increases in CPT1A and CS expression (Fig. 8A). CPT1A increase suggested that FA β‐oxidation was increased in SFN‐induced beige adipocytes. In addition, in order to examine whether SFN affect the esterification of FAs for the synthesis of TG, the level of diacylglycerol acyl transferase (DGAT‐1) in adipocytes incubated with SFN for 48 h was measured. DGAT‐1 is a crucial enzyme that is involved in catalysis of the final step of triglyceride synthesis. In this study, DGAT‐1 protein expression was significantly decreased in SFN‐treated cells compared with expression in control cells (Fig. 8B; p < 0.01).
Figure 8.
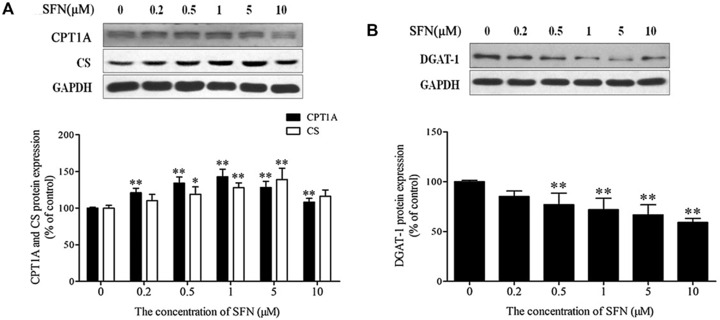
Effect of SFN on FA oxidation and triglyceride synthesis in adipocytes. Mature adipocytes were treated with different concentrations of SFN for 48 h. Total protein extracts were prepared, and protein levels of CPT1A, CS (key enzyme in FA aerobic oxidation), and DGAT‐1 (key enzyme in triglyceride synthesis) were analyzed by Western blot. (A) CPT1A and CS expression. Upper: representative image of Western blot. Lower: quantification of CPT1A and CS protein expression. (B) DGAT‐1 expression. Upper: representative image of Western blot. Lower: quantification of DGAT‐1 protein expression. Results are presented as percentages relative to the control. Values are means ± SD of three independent experiments. *p < 0.05, **p < 0.01 compared with the control.
4. Discussion
SFN is a naturally occurring organo‐sulfur compound derived from cruciferous vegetables such as broccoli, brussels sprouts, or cabbages 10. SFN is a well‐known potent natural oxidant with anticancer properties 11. SFN has also been demonstrated to inhibit adipogenesis, and improve glucose metabolism by blocking streptozotocin‐induced islet destruction 12, 13. Our previous study demonstrated that SFN can induce the apoptosis of adipocyte 14. Until now, however, little has been known about the impact of SFN on mitochondria homeostasis in adipocytes. As a result, we sought to investigate the effect of SFN on mitochondrial biogenesis and UCP1 expression in mature 3T3‐L1 adipocytes. We found that SFN strongly impacted mitochondria biogenesis and function, leading to increased mitochondrial content and oxidative capacity, and ultimately inducing white adipocyte browning. Additional data confirmed that SFN significantly enhanced the activity of CS and mitochondrial complex enzymes on the respiratory chain. More importantly, SFN markedly elevated the expression of UCP1, which is a specific protein of brown adipocyte. The cellular ATP content was decreased with the elevation of UCP1 protein level. These results indicated that SFN functions to promote the browning of adipocytes and dissipate of ATP.
To explore the mechanism responsible for this effect of SFN on 3T3‐L1 adipocytes, the PGC‐1α pathway was examined. PGC‐1α is a transcriptional coactivator that plays an important role in mitochondrial biogenesis in mammalian tissues 15. NRF‐1 is an initial transcription factor target that was identified in the induction of mitochondrial biogenesis by PGC‐1α, as manifested by PGC‐1α‐induced transactivation of NRF‐1 and stimulation of mitochondrial DNA replication and gene expression 16. In contrast, a dominant‐negative allele of NRF‐1 blocks the effects of PGC‐1α on mitochondrial biogenesis 17. Sirt‐1, an NAD+‐dependent protein deacetylase, has emerged as an important metabolic sensor, and its activation by small molecules, calorie restriction, or exercise promotes mitochondrial biogenesis and activities 18, 19. PGC‐1α is a principal substrate of Sirt‐1, and thus, Sirt‐1 may function, in part, by deacetylating multiple lysine residues in PGC‐1α, thereby upregulating metabolic signaling through PGC‐1α and promoting mitochondrial FA oxidation 20. As shown in our experiments, expressions of the transcription factors Sirt‐1, PGC‐1α, and NRF‐1, which are involved in mitochondrial biogenesis, were upregulated by SFN treatment in 3T3‐L1 adipocytes. Moreover, this upregulation was closely correlated with the stimulation of mitochondrial biogenesis and induction of UCP1 expression, suggesting that SFN activates the Sirt‐1/PGC‐1α pathway to promote browning of 3T3‐L1 adipocytes, as shown in Fig. 9.
Figure 9.
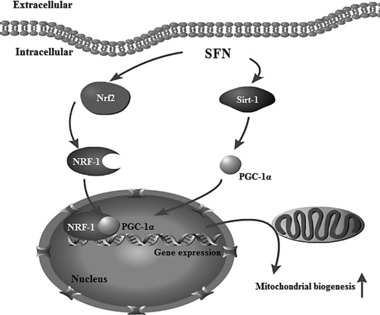
Proposed schematic diagram of SFN‐induced mitochondrial biogenesis. SFN activates the Sirt‐1/PGC‐1α pathway and enhances expression of Nrf2 and NRF‐1, thereby promoting the expressions of genes involved in mitochondrial biogenesis and triggering browning of 3T3L1 adipocytes.
Piantadosi et al. demonstrated that Nrf2 connects mitochondrial biogenesis with antioxidant defenses via the multiple Nrf2 binding sites in the NRF‐1 promoter 20. Carbon monoxide, a product of heme oxygenase 1, activates mitochondrial biogenesis in cardiomyocytes in an Nrf2‐dependent manner. In detail, carbon monoxide elevated mitochondrial H2O2 production, which induced Nrf2 nuclear translocation mediated by PKB/Akt kinase 21 and occupancy of four AREs in the NRF‐1 promoter, thereby leading to gene activation for mitochondrial biogenesis. SFN is a well‐known and potent activator of Nrf2. In the present study, SFN was found to enhance Nrf2 protein expression. Of note, the effect of SFN on the browning of adipocytes occurred in a different manner with the most marked effect observed at a relative low dose (1 μM). It is still reasonable, however, to assume that Nrf2 is involved in the browning effect of SFN on 3T3‐L1 adipocytes.
Detailed understanding of how glucose and lipid metabolism occur in beige fat cells is critical for the identification and implementation of brown fat‐based therapies for obesity and related disease. Accumulating evidence supports the notion that the metabolic benefits of this conversion from white to beige cells include prevention of diet‐induced obesity and increase of insulin (INS) sensitivity 22, given that mitochondria are the central players in cellular bioenergetics and global metabolism homeostasis. Unfortunately, we lack sufficient details with respect to glucose and lipid disposal capacity of beige adipocytes. Therefore, we determined whether glucose and lipid utilization altered in SFN‐treated adipocytes that displayed a beige phenotype with enhanced mitochondrial biogenesis. Disruption in glucose homeostasis causes diseases such as diabetes mellitus and cardiovascular disorders, and glucose transporters mediate the transport of glucose from the extracellular fluid into the cytoplasm of mammalian cells 23. The GLUT‐4 system, which is mainly expressed in skeletal muscle and fat cells, is a pivotal component in the maintenance of glucose homeostasis, and this system has been widely studied due to its role in diabetes 24. Adipose is a metabolically meaningful tissue and capable of contributing to whole‐body glucose homeostasis. In INS‐resistant humans and rodents, the expression of GLUT‐4 is decreased in adipocytes compared to muscle 25. Conversely, GLUT‐4 over‐expression in adipose tissue of mice lacking GLUT‐4 selectively in muscle reverses INS resistance and diabetes 26. While increased GLUT‐4‐mediated glucose transport plays a rate‐limiting role in glucose utilization in adipose tissues 27, Heiss et al. reported that small molecule SFN increased cellular glucose uptake in mouse embryonic fibroblasts 28. Consistent with these findings, we detected an enhanced cellular uptake of glucose analog 2‐NBDG and a high level of GLUT‐4 expression in 3T3‐L1 adipocytes treated with SFN, indicating that SFN acts to stimulate glucose uptake via upregulation of GLUT‐4 in these cells. As a major energy source, glucose provides energy in the form of ATP via glycolysis and the citric acid cycle. We used detection of the levels of GCK and CS, key enzymes of glycolysis and tricarboxylic acid cycle, respectively, to track the metabolic fate of glucose in SFN‐treated adipocytes. SFN markedly elevated the expressions of GCK and CS, and thus, we propose that SFN treatment enhances mitochondrial biogenesis, thereby promoting upregulation of glucose aerobic oxidation pathway.
We also investigated the effect of browning of 3T3‐L1 adipocytes on lipid metabolism. As for lipolysis, ATGL, which is located on the surface of lipid droplets, specifically removes the first FA from the TG molecule generating DAG 29. HSL then acts to convert DAG into monoacylglycerol. Of note, TG in adipocytes is stored within lipid droplets surrounded by a phospholipid monolayer containing various lipid droplet proteins, and lipolysis involves specific protein–protein interactions at the surface of these lipid droplets 30. Plin is a lipid droplet scaffold protein and is known as a “molecular switch” of lipolysis 31. Plin functions to protect lipid storage droplets in adipocytes by coating them until digestion by HSL and promoting interactions amongst lipolytic effector proteins, thereby modulating the lipid metabolism in adipocytes 31, 32. In the basal state, Plin sequesters α/β‐fold domain‐containing protein 5, causing the inactivation of ATGL 33. Catecholamines stimulate the phosphorylation of cytosolic HSL and Plin via PKA, resulting in release of α/β‐fold domain‐containing protein 5, which is then available for ATGL. Finally, TG hydrolysis is initiated 34. As a critical regulator of lipolysis, elevated Plin levels have been linked to obesity, and by contrast, downregulation of Plin expression either with or without upregulation of p‐Plin results in destruction of the protein protective barrier on the surface of the lipid droplet and enhancement of lipolysis 33. For example, enhanced expression of Plin is necessary for the antilipolytic effect of activator minoimidazole carboxamide ribonucleotide 32. As the rate‐limiting enzyme for the lipolysis reaction 35, HSL is a major target of PKA‐catalyzed lipolysis 36, which results in phosphorylation and activation of HSL at Ser 563, Ser 659, and Ser 660 37. Conversely, phosphorylation of HSL at Ser 565 inhibits the phosphorylation of HSL at Ser 563 by PKA. A recent study by Lee et al. showed that SFN increased lipolysis via an increase in HSL phosphorylation at Ser 563 and suppression of phosphorylation at Ser 565 without any detectable effect on Plin mRNA 12. In our study, SFN decreased the cellular lipid droplet loads and suppressed the protein expression of Plin. One possible explanation for the discrepancy between levels of Plin expression in these two studies may be that our study employed a longer SFN treatment time (48 h) than the one (24 h) used in the study by Lee et al. Our results also demonstrated that SFN significantly upregulates HSL at the protein level in adipocytes, stimulates the phosphorylation of HSL at Ser 563 and Ser 660, and inhibits the phosphorylation of HSL at Ser 565. Interestingly, a previous study showed that ATGL‐catalyzed lipolysis induced PGC‐1α signaling and downstream changes in oxidative metabolism 38; yet, in our study, SFN elevated, but did not significantly increased, the expression of ATGL. Therefore, we postulate that the SFN‐induced lipolysis enhancement may be most dependent on the activation of HSL, as ATGL was not involved in the effect of SFN on PGC‐1α signaling or on oxidative metabolism.
In general, the FAs derived from lipolysis in adipocytes are available for β‐oxidation or reassembly for storage as inert triglycerides via lipogenesis. To describe the metabolic fate of FAs, we measured the levels of CPT1A and CS, which are responsible for the influx of FAs into mitochondria and in advancement of the citric acid cycle, and the protein expression of DGAT‐1, which catalyzes the final step of TG synthesis 39. DGAT‐1 is present in adipose tissues and is believed to play a role in lipid absorption and accumulation in the fat cells. A previous report showed that transgenic overexpression of DGAT‐1 in adipose tissues resulted in whole‐body INS resistance and other metabolic disturbances, suggesting that inhibition of DGAT‐1 is a promising target for the treatment of obesity and type 2 diabetes 40. Furthermore, our results demonstrated that SFN significantly increases CPT1A and CS protein levels and simultaneously decreases the expression of DGAT‐1, suggesting that more FAs released by SFN‐enhanced lipolysis may enter the aerobic oxidation pathway than the triglyceride synthesis pathway.
In addition, acetyl‐CoA, a product of the β‐oxidation of FAs, can be used to synthesize FAs through a complex set of reaction. This process, termed de novo FA synthesis, requires two major enzymatic steps. First, ACC catalyzes the synthesis of malonyl‐CoA from acetyl‐CoA, and then FAS sequentially condenses acetyl‐CoA and malonyl‐CoA to build up long‐chain FAs. In the current study, SFN markedly inhibited the expressions of both ACC and FAS, in favor of decreasing de novo FA synthesis. Therefore, the browning of adipocytes induced by SFN may be favorable for whole‐body lipid metabolism based on evidence that this compound significantly reduced the lipid droplet load, significantly increased the gene expressions related to β‐oxidation of FAs, and significantly decreased the levels of key enzyme involved in synthesis of TG. At the same time, the de novo FA synthesis‐related protein expression was downregulated. Taken together, these data suggest that SFN‐induced browning of adipocytes is favorable for the conversion of adipose tissue from an energy storage site to a lipid burn site (Fig. 10).
Figure 10.
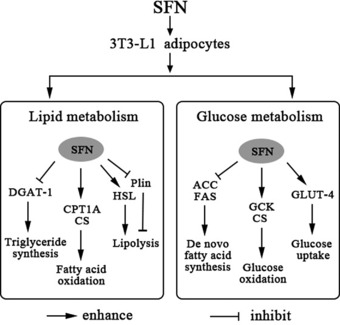
Effect of SFN on glucose and lipid metabolism in mature 3T3‐L1 adipocytes. SFN enhances glucose uptake and aerobic oxidation by upregulating expression of GLUT‐4, GCK, and CS proteins. SFN also increases lipolysis by upregulating the levels of key enzymes, such as HSL and its phosphorylated form p‐HSLSer563 and p‐HSLSer660, involved in lipid hydrolysis, and by inhibiting levels of Plin. Furthermore, SFN triggers FA oxidation by increasing the levels of the enzymes CPT1A and CS, which are responsible for FA β‐oxidation. In contrast, SFN also inhibits endogenous FA and triglyceride synthesis by downregulating the levels of ACC and FAS as well as DGAT‐1.
5. Conclusion
Phytochemicals are types of active components from natural plants with many biological functions. Therefore, it comes as no surprise that phytochemicals are a valuable resources for antiobesity drug development. Our study for the first time demonstrated that SFN functions to induce the browning of 3T3‐L1 adipocytes and that this alteration is characterized by the elevated level and function of mitochondria, as well as the increased expression of UCP1. More importantly, this study systematically evaluated the effect of browning of adipocytes on glucose and lipid metabolism pathway at the cellular level, and revealed that SFN upregulates glucose uptake and oxidative utilization as well as lipolysis and FA oxidation pathway, while suppresses the endogenous synthesis of TGs pathway. Moreover, the upregulated UCP1 expression leads to dispersion of energy as heat and the decrease in ATP level. Taken together, these findings support the notion that browning of adipocytes triggered by SFN promotes glucose and lipid utilization in adipocytes, is favourable for improving of whole‐body metabolic load, and therefore, may be considered as an appealing strategy for addressing obesity and obesity‐related diseases. Furthermore, clinical investigation is necessary to determine the potential of SFN to prevent obesity‐related metabolism disorder in humans by inducing adipocyte browning.
The authors declare no conflicts of interest.
Supporting information
As a service to our authors and readers, this journal provides supporting information supplied by the authors. Such materials are peer reviewed and may be re‐organized for online delivery, but are not copy‐edited or typeset. Technical support issues arising from supporting information (other than missing files) should be addressed to the authors.
Table S1. Nucleotide sequences of primers used in qRT‐PCR
Acknowledgments
X.H.Z., Y.P.B., Y.J.S. designed the study; H.Q.Z., S.Y.C. conducted the experiments; A.S.W., A.J.Y., J.F.F. performed the statistical analysis, J.S.Z., F.C., Z.Q.Z. contributed to the writing. All authors read and approved the manuscript.
This study was supported by the National Natural Science Foundation of China (NSFC; grant nos. 81172660 and 81450048), the Zhejiang Provincial Natural Science Foundation (grant no. LY14H260001), and the Ningbo Civil Outstanding Talent and Leadership Fund. This study was sponsored by the K. C. Wong Magna Fund at Ningbo University.
Colour online: See the article online to view Fig. 1, 5 and 6 in colour.
6 References
- 1. Jou, P. C. , Ho, B. Y. , Hsu, Y. W. , Pan, T. M. , The effect of Monascus secondary polyketide metabolites, monascin and ankaflavin, on adipogenesis and lipolysis activity in 3T3‐L1. J. Agric. Food Chem. 2010, 58, 12703–12709. [DOI] [PubMed] [Google Scholar]
- 2. Cannon, B. , Nedergaard, J. , Brown adipose tissue: function and physiological significance. Physiol. Rev. 2004, 84, 277–359. [DOI] [PubMed] [Google Scholar]
- 3. Gesta, S. , Tseng, Y. H. , Kahn, C. R. , Developmental origin of fat: tracking obesity to its source. Cell 2007, 131, 242–256. [DOI] [PubMed] [Google Scholar]
- 4. Vitali, A. , Murano, I. , Zingaretti, M. C. , Frontini, A. et al., The adipose organ of obesity‐prone C57BL/6J mice is composed of mixed white and brown adipocytes. J. Lipid Res. 2012, 53, 619–629. [DOI] [PMC free article] [PubMed] [Google Scholar]
- 5. Villarroya, F. , Vidal‐Puig, A. , Beyond the sympathetic tone: the new brown fat activators. Cell Metab. 2013, 17, 638–643. [DOI] [PubMed] [Google Scholar]
- 6. Hota, K. B. , Hota, S. K. , Chaurasia, O. P. , Singh, S. B. , Acetyl‐l‐carnitine‐mediated neuroprotection during hypoxia is attributed to ERK1/2‐Nrf2‐regulated mitochondrial biosynthesis. Hippocampus 2012, 22, 723–736. [DOI] [PubMed] [Google Scholar]
- 7. Shin, S. , Wakabayashi, J. , Yates, M. S. , Wakabayashi, N. et al., Role of Nrf2 in prevention of high‐fat diet‐induced obesity by synthetic triterpenoid CDDO‐imidazolide. Eur. J. Pharmacol. 2009, 620, 138–144. [DOI] [PMC free article] [PubMed] [Google Scholar]
- 8. Kraemer, F. B. , Shen, W. J. , Hormone‐sensitive lipase: control of intracellular tri‐(di‐)acylglycerol and cholesteryl ester hydrolysis. J. Lipid Res. 2002, 43, 1585–1594. [DOI] [PubMed] [Google Scholar]
- 9. Suganami, T. , Tanaka, M. , Ogawa, Y. , Adipose tissue inflammation and ectopic lipid accumulation. Endocr. J. 2012, 59, 849–857. [DOI] [PubMed] [Google Scholar]
- 10. Fahey, J. W. , Zalcmann, A. T. , Talalay, P. , The chemical diversity and distribution of glucosinolates and isothiocyanates among plants. Phytochemistry 2001, 56, 5–51. [DOI] [PubMed] [Google Scholar]
- 11. Pawlik, A. , Wiczk, A. , Kaczynska, A. , Antosiewicz, J. et al., Sulforaphane inhibits growth of phenotypically different breast cancer cells. Eur. J. Nutr. 2013, 52, 1949–1958. [DOI] [PMC free article] [PubMed] [Google Scholar]
- 12. Lee, J. H. , Moon, M. H. , Jeong, J. K. , Park, Y. G. et al., Sulforaphane induced adipolysis via hormone sensitive lipase activation, regulated by AMPK signaling pathway. Biochem. Biophys. Res. Commun. 2012, 426, 492–497. [DOI] [PubMed] [Google Scholar]
- 13. Song, M. Y. , Kim, E. K. , Moon, W. S. , Park, J. W. et al., Sulforaphane protects against cytokine‐ and streptozotocin‐induced beta‐cell damage by suppressing the NF‐kappaB pathway. Toxicol. Appl. Pharmacol. 2009, 235, 57–67. [DOI] [PubMed] [Google Scholar]
- 14. Yao, A. , Shen, Y. , Wang, A. , Chen, S. et al., Sulforaphane induces apoptosis in adipocytes via Akt/p70s6k1/Bad inhibition and ERK activation. Biochem. Biophys. Res. Commun. 2015, 465, 696–701. [DOI] [PubMed] [Google Scholar]
- 15. Liang, H. , Ward, W. F. , PGC‐1alpha: a key regulator of energy metabolism. Adv. Physiol. Educ. 2006, 30, 145–151. [DOI] [PubMed] [Google Scholar]
- 16. Garesse, R. , Vallejo, C. G. , Animal mitochondrial biogenesis and function: a regulatory cross‐talk between two genomes. Gene 2001, 263, 1–16. [DOI] [PubMed] [Google Scholar]
- 17. Wu, Z. , Puigserver, P. , Andersson, U. , Zhang, C. et al., Mechanisms controlling mitochondrial biogenesis and respiration through the thermogenic coactivator PGC‐1. Cell 1999, 98, 115–124. [DOI] [PubMed] [Google Scholar]
- 18. Canto, C. , Gerhart‐Hines, Z. , Feige, J. N. , Lagouge, M. et al., AMPK regulates energy expenditure by modulating NAD+ metabolism and SIRT1 activity. Nature 2009, 458, 1056–1060. [DOI] [PMC free article] [PubMed] [Google Scholar]
- 19. Milne, J. C. , Lambert, P. D. , Schenk, S. , Carney, D. P. et al., Small molecule activators of SIRT1 as therapeutics for the treatment of type 2 diabetes. Nature 2007, 450, 712–716. [DOI] [PMC free article] [PubMed] [Google Scholar]
- 20. Gerhart‐Hines, Z. , Rodgers, J. T. , Bare, O. , Lerin, C. et al., Metabolic control of muscle mitochondrial function and fatty acid oxidation through SIRT1/PGC‐1alpha. EMBO J. 2007, 26, 1913–1923. [DOI] [PMC free article] [PubMed] [Google Scholar]
- 21. Piantadosi, C. A. , Carraway, M. S. , Babiker, A. , Suliman, H. B. , Heme oxygenase‐1 regulates cardiac mitochondrial biogenesis via Nrf2‐mediated transcriptional control of nuclear respiratory factor‐1. Circ. Res. 2008, 103, 1232–1240. [DOI] [PMC free article] [PubMed] [Google Scholar]
- 22. Ali, A. T. , Penny, C. B. , Paiker, J. E. , Psaras, G. et al., The relationship between alkaline phosphatase activity and intracellular lipid accumulation in murine 3T3‐L1 cells and human preadipocytes. Anal. Biochem. 2006, 354, 247–254. [DOI] [PubMed] [Google Scholar]
- 23. Zhao, F. Q. , Keating, A. F. , Functional properties and genomics of glucose transporters. Curr. Genomics 2007, 8, 113–128. [DOI] [PMC free article] [PubMed] [Google Scholar]
- 24. Takeda, M. , Yamamoto, K. , Takemura, Y. , Takeshita, H. et al., Loss of ACE2 exaggerates high‐calorie diet‐induced insulin resistance by reduction of GLUT4 in mice. Diabetes 2013, 62, 223–233. [DOI] [PMC free article] [PubMed] [Google Scholar]
- 25. Shepherd, P. R. , Kahn, B. B. , Glucose transporters and insulin action—implications for insulin resistance and diabetes mellitus. N. Engl. J. Med. 1999, 341, 248–257. [DOI] [PubMed] [Google Scholar]
- 26. Carvalho, E. , Kotani, K. , Peroni, O. D. , Kahn, B. B. , Adipose‐specific overexpression of GLUT4 reverses insulin resistance and diabetes in mice lacking GLUT4 selectively in muscle. Am. J. Physiol. Endocrinol. Metab. 2005, 289, E551–E561. [DOI] [PubMed] [Google Scholar]
- 27. Rea, S. , James, D. E. , Moving GLUT4: the biogenesis and trafficking of GLUT4 storage vesicles. Diabetes 1997, 46, 1667–1677. [DOI] [PubMed] [Google Scholar]
- 28. Heiss, E. H. , Schachner, D. , Zimmermann, K. , Dirsch, V. M. , Glucose availability is a decisive factor for Nrf2‐mediated gene expression. Redox Biol. 2013, 1, 359–365. [DOI] [PMC free article] [PubMed] [Google Scholar]
- 29. Zimmermann, R. , Strauss, J. G. , Haemmerle, G. , Schoiswohl, G. et al., Fat mobilization in adipose tissue is promoted by adipose triglyceride lipase. Science 2004, 306, 1383–1386. [DOI] [PubMed] [Google Scholar]
- 30. Londos, C. , Brasaemle, D. L. , Schultz, C. J. , Adler‐Wailes, D. C. et al., On the control of lipolysis in adipocytes. Ann. N. Y. Acad. Sci. 1999, 892, 155–168. [DOI] [PubMed] [Google Scholar]
- 31. Brasaemle, D. L. , Thematic review series: adipocyte biology. The perilipin family of structural lipid droplet proteins: stabilization of lipid droplets and control of lipolysis . J. Lipid Res. 2007, 48, 2547–2559. [DOI] [PubMed] [Google Scholar]
- 32. Hong, S. W. , Lee, J. , Park, S. E. , Rhee, E. J. et al., Activation of AMP‐activated protein kinase attenuates tumor necrosis factor‐alpha‐induced lipolysis via protection of perilipin in 3T3‐L1 adipocytes. Endocrinol. Metab. 2014, 29, 553–560. [DOI] [PMC free article] [PubMed] [Google Scholar]
- 33. He, J. , Jiang, H. , Tansey, J. T. , Tang, C. et al., Calyculin and okadaic acid promote perilipin phosphorylation and increase lipolysis in primary rat adipocytes. Biochim. Biophys. Acta 2006, 1761, 247–255. [DOI] [PubMed] [Google Scholar]
- 34. Fu, J. , Li, Z. , Zhang, H. , Molecular pathways regulating the formation of brown‐like adipocytes in white adipose tissue. Diabetes Metab. Res. Rev. 2015, 31, 433–452. [DOI] [PubMed] [Google Scholar]
- 35. Zechner, R. , Zimmermann, R. , Eichmann, T. O. , Kohlwein, S. D. et al., FAT SIGNALS—lipases and lipolysis in lipid metabolism and signaling. Cell Metab. 2012, 15, 279–291. [DOI] [PMC free article] [PubMed] [Google Scholar]
- 36. Stralfors, P. , Belfrage, P. , Phosphorylation of hormone‐sensitive lipase by cyclic AMP‐dependent protein kinase. J. Biol. Chem. 1983, 258, 15146–15152. [PubMed] [Google Scholar]
- 37. Holm, C. , Molecular mechanisms regulating hormone‐sensitive lipase and lipolysis. Biochem. Soc. Trans. 2003, 31, 1120–1124. [DOI] [PubMed] [Google Scholar]
- 38. Khan, S. A. , Sathyanarayan, A. , Mashek, M. T. , Ong, K. T. et al., ATGL‐catalyzed lipolysis regulates SIRT1 to control PGC‐1alpha/PPAR‐alpha signaling. Diabetes 2015, 64, 418–426. [DOI] [PMC free article] [PubMed] [Google Scholar]
- 39. Cao, J. , Zhou, Y. , Peng, H. , Huang, X. et al., Targeting Acyl‐CoA:diacylglycerol acyltransferase 1 (DGAT1) with small molecule inhibitors for the treatment of metabolic diseases. J. Biol. Chem. 2011, 286, 41838–41851. [DOI] [PMC free article] [PubMed] [Google Scholar]
- 40. Chen, N. , Liu, L. , Zhang, Y. , Ginsberg, H. N. et al., Whole‐body insulin resistance in the absence of obesity in FVB mice with overexpression of Dgat1 in adipose tissue. Diabetes 2005, 54, 3379–3386. [DOI] [PubMed] [Google Scholar]
Associated Data
This section collects any data citations, data availability statements, or supplementary materials included in this article.
Supplementary Materials
As a service to our authors and readers, this journal provides supporting information supplied by the authors. Such materials are peer reviewed and may be re‐organized for online delivery, but are not copy‐edited or typeset. Technical support issues arising from supporting information (other than missing files) should be addressed to the authors.
Table S1. Nucleotide sequences of primers used in qRT‐PCR