

Summary
Obesity is associated with the metabolic syndrome. The aims were, first, to study the postprandial triglyceride clearance in young, healthy obese subjects and, second, to investigate if fasting triglycerides can predict delayed postprandial triglyceride clearance. Eighteen apparently healthy, obese subjects with no clinical signs of metabolic disturbances participated. Controls were age‐ and sex‐matched, healthy, normal weight subjects. Subclinical markers of metabolic disturbances were assessed by measuring postprandial triglycerides in serum and in chylomicrons by oral fat tolerance test. Postprandial triglyceride clearance for 8 h was assessed indirectly as removal of the lipid from serum during the oral fat tolerance test. Insulin resistance was measured by the homeostasis model assessment of insulin resistance (HOMA‐IR). Twelve (66%) of the apparently healthy obese individuals had insulin resistance measured by HOMA‐IR. There was a delayed clearance of serum triglycerides and chylomicron triglycerides at 6 h when compared with the control group, while, at 8 h, the differences were only detected for the chylomicron triglyceride clearance. Triglyceride response was significantly greater in the obese subjects. Fasting triglycerides in upper normal level predicted a delayed postprandial triglyceride clearance and insulin resistance. In young, apparently healthy obese subjects early metabolic disturbances including insulin resistance and delayed postprandial triglyceride clearance can be detected. Fasting serum triglyceride in upper normal level predicted delayed postprandial triglyceride clearance and insulin resistance.
Keywords: Chylomicrons, fasting triglycerides, insulin resistance, metabolic healthy obese
Abbreviations
- Apo A‐I
apolipoprotein A‐I
- ApoB‐100
apolipoprotein B‐100
- BMI
body mass index
- CM
chylomicrons
- CM‐TGR
chylomicron triglyceride response
- DEXA
dual X‐ray absorptiometry
- HDL
high‐density lipoproteins
- HOMA‐IR
insulin resistance by the homeostasis model assessment
- IR
insulin resistance
- LDL
low‐density lipoprotein
- LPL
lipoprotein lipase
- NaCl
natrium chloride
- OFTT
oral fat tolerance test
- OGTT
oral glucose tolerance test
- RM‐ANOVA
repeated measure analysis of variance
- ROC
receiver‐operating characteristic
- SE‐TG
serum triglyceride
- TG
triglycerides
- TGR
triglyceride response
- TRL
triglyceride‐rich lipoproteins
- VLDL
very low‐density lipoproteins
- WBISI
whole body insulin sensitivity index
What is already known about this subject
Up to 10% of obese subjects can be considered metabolically healthy to date.
Postprandial triglyceridaemia is well documented in overweight and obese subjects with fasting hypertriglyceridaemia.
Diverging results exist for chylomicron triglycerides.
What this study adds
As far as we know, this is the first report that shows that metabolically apparently healthy obese subjects have a delayed postprandial clearance of chylomicron triglycerides.
This study also points out the possible need of a new and lower reference level for fasting triglyceride levels in obese subjects.
Introduction
Overweight and obesity, the sixth most important risk factor for global death and disease burden 1, are raising global health problems with several metabolic disturbances and comorbidities, such as type 2 diabetes and cardiovascular disease. Environmental challenges such as a sedentary lifestyle and excessive intake of processed food contribute to the increased prevalence of obesity 2, 3, with a substantial part of life in the postprandial state. Hypertriglyceridaemia is the typical lipid disturbance in overweight and obesity 4 and contributes to atherosclerosis. A milestone in the understanding of the atherosclerotic process was the proposal of Zilversmith in 1979 5 of a reduced and prolonged clearance of postprandial accumulation of triglyceride‐rich lipoproteins (TRLs) as one of the main pathophysiological events in the atherosclerotic process. This was later supported by studies showing that chylomicron (CM) remnant particles penetrate efficiently and are retained selectively in early atherosclerotic lesions of the vessel wall 6, 7, and contribute to coronary atherosclerotic disease by delayed elimination of postprandial TRL 8, 9. The enzyme lipoprotein lipase (LPL) plays a pivotal role in the lipoprotein metabolism by hydrolysing TG in CM. Activation of LPL results in hydrolysing of CM and development of TG in small CM remnants 10, hydrolysing TG in very low‐density lipoproteins (VLDLs) assembled in the liver, contributing fatty acids to the vascular endothelium and, finally, removing them from the bloodstream 11. LPL activity in the vascular endothelium is regulated by insulin, and the insulin resistance (IR) typically found in overweight and obese individuals 12 may contribute to a delayed removal of postprandial TRL and its highly association to overweight 4 and especially to abdominal obesity 13, 14, 15, 16.
Our knowledge of lipid disturbances in young, healthy overweight and obese subjects is poor, especially for postprandial triglyceride metabolism focusing on CM. Both delayed postprandial plasma TG response, in obese men and women 17, and serum TG (SE‐TG) 18 in overweight men have been detected, but as far as we know no differences have been found in the CM compartment.
Therefore, in this report postprandial TG metabolism in serum and in CM has been studied in young, apparently healthy, obese subjects without signs of metabolic disturbances, including normolipidaemia.
Methods
Participants
Volunteers were recruited from the Centre of Obesity, Department of Gastroenterology and Nutrition, University Hospital of North Norway. Posters were also used to recruit obese individuals and healthy controls to participate in the study. The inclusion criteria for the obese subjects were body mass index (BMI) >30 kg m−2, age 18–40 years old, normotensive, normoglycaemic, normolipaemic, no history of diabetes and not pregnant. Exclusion criteria were smoking, serious mental and somatic diseases, and patients on anti‐obesity drugs. The inclusion and exclusion criteria for the age‐ and sex‐matched healthy controls were the same, except having normal weight (BMI < 25).
Participants were informed and signed a written consent. Of the 40 obese subjects who were screened for participation, 13 did not answer after receiving more info, and nine were excluded mainly because of high blood pressure and high blood lipids. The remaining 18 subjects were eligible to participate, and were defined as ‘healthy obese’. A ‘healthy obese’ individual is, in this study, defined as an obese individual whom would be classified as apparently healthy by standard clinical evaluation and biochemical measurements by a general practitioner.
Height, body weight, BMI and waist circumference were measured and blood tests were drawn. These included fasting glucose (FG), total cholesterol, low‐density lipoprotein (LDL) cholesterol, high‐density lipoprotein (HDL) cholesterol and TG.
Dual X‐ray absorptiometry (DEXA; Lunar Prodigy Advance, GE Healthcare, USA) was collected at baseline for all subjects. The DEXA measured total fat percentage, abdominal fat percentage, total fat mass (kg) and total muscle mass (kg).
Oral glucose tolerance test (OGTT)
OGTT was conducted using an oral intake of 75 g of glucose in solution, after a 12 h night‐fast. Blood tests were drawn from the antecubital vein before ingestion (0 min) and at 30, 60, 90 and 120 min after intake. Glucose and insulin were measured at all time points.
Oral fat tolerance test
On the test day, the participants did an 8 h oral fat tolerance test (OFTT) to indirectly measure TG clearance. OFTT has been proven to be a good, indirect and qualitative measure of triglyceride clearance 19. Three days prior to testing, the subjects had a normal food intake, no alcohol intake and had abstained from heavy physical activity. The participants fasted for 12 h before the start of the test. They were at rest and not allowed to smoke, chew a gum or drink anything other than water during the test day. The OFTT was conducted using a test meal prepared from standard sour cream porridge and double cream, together containing 70% calories of fat, of which 66% was saturated fat, 32% was monounsaturated fat and 2% was polyunsaturated fat 20. A freshly prepared test meal was served with two teaspoons of white sugar (10 g of carbohydrates), cinnamon and one glass (100 mL) of calorie‐free lemonade. The participants were served a weight‐adjusted meal (1 g of fat per kg body weight) at 08:00 h (baseline) and the meal was consumed within a 15‐min period. The participants were offered a 500‐mL calorie‐free beverage and one fruit (pear or apple) at 12:00 h (4 h). Blood samples for serum and Ethylenediaminetetraacetic acid (EDTA) plasma for isolation of CM were collected before the test meal (baseline) and every second hour over the next 8 h. The TG clearances at 6 and 8 h were calculated by the following formula: Clearance 6 h = 100 × (1 − ({[TG (6 h) − TG (0 h)]/[TG (max) − TG (0 h)]}). Triglyceride response (TGR) in CM and in SE‐TG was calculated as the mean of the two highest postprandial values minus the baseline value of SE‐TG 21.
Isolation of CMs
CM were isolated by overlayering 8 mL of EDTA plasma with 5 mL of natrium chloride (NaCl) solution (a density of 1.006 kg L−1 NaCl solution with 0.02% sodium azide and 0.01% EDTA) in a cellulose nitrate tube (Beckman Instruments Inc., CA, USA) and centrifuged in a Beckman SW40 Ti swinging bucket rotor (Beckman Coulter Inc., Brea, California, USA) at 20 000 rpm for 1 h at 20° C 22. The CM, with Svedberg flotation rates >400 × 10−13 s, was carefully removed by aspiration from the top of the tubes by 23 dividing into three aliquots in cryovials, flushed with nitrogen and frozen at −70° C until further analysis.
Serum lipid and apolipoprotein measurements
Serum lipids were analysed on a Hitachi 737 automatic analyser (Boehringer Mannheim GmbH, Mannheim, Germany) according to manufacturer's recommendations. Total cholesterol (our laboratory reference value was 18–29 years: 2.9–6.1 mmol L−1, 30–49 years: 3.3–6.9 mmol L−1, ≥50 years: 3.9–7.8 mmol L−1) was measured with an enzymatic colorimetric method (CHOD‐PAP) and HDL cholesterol (our laboratory reference value was for women: 1.0–2.7 mmol L−1 and men: 0.8–2.1 mmol L−1) was assayed by the same procedure after precipitation LDL with heparin and manganese chloride as described by Burstein et al. 24. TG concentration in serum (our laboratory reference value was 0.5–2.6 mmol L−1) and in CM was determined with an enzymatic colorimetric test (GPO‐PAP). LDL cholesterol was calculated by the formula of Friedewald et al. 25: LDL cholesterol = Total cholesterol − HDL cholesterol − 0.47 × serum triglycerides. Apolipoproteins A‐I and B‐100 (ApoB‐100) were measured immunochemically by rate nephelometry using the Array Protein System from Beckman Instruments Inc. (Brea, CA, USA).
Measurements for insulin sensitivity
Serum insulin was analysed directly through a commercial enzyme‐linked immunosorbent assay (ELISA) kit (DRG insulin ELISA kit, DRG Instruments GmbH, Marburg, Germany). IR determination by the homeostasis model assessment of IR (HOMA‐IR) and supplementary by the whole body insulin sensitivity index (WBISI) were calculated. IR was calculated as follows: HOMA‐IR = Fasting insulin (FI) (mU L−1) × FG (mmol L−1)/22.5 26, WBISI = 10 000/[FI (mU L−1) × FG (mg dL−1) × mean insulin (mU L−1) × mean glucose (mg dL−1)]1/2 27. The cut‐off value of 95% confidence interval (CI) of HOMA‐IR in the normal weight subjects was considered as the limits of normality 28, 29, 30.
Statistics
Statistics were calculated on SPSS 19 IBM for Windows (SPSS Inc., Chicago, IL, USA). Microsoft Excel (Microsoft corp., Redmond, Washington, USA) was used for calculating HOMA‐IR, WBISI, TG clearance and TGR. Normal distribution was detected by determination of skewness and histograms. Parametric statistics were performed when either raw or transformed data resembled normal distribution; otherwise, non‐parametric tests were used. Tests for independent or paired samples were used as appropriate. A repeated measure analysis of variance (RM‐ANOVA) was used to analyse data from the OFTT. Corrections for deviation from the assumption of sphericity were used as appropriate. An RM‐ANOVA was performed to modulate postprandial TG profile as predicted by weight group and fasting TG group (all subjects were ranked according to fasting TG and split in two equal groups with cut‐off of 1.02 mmol L−1). Two‐sided P‐values < 0.05 were considered statistically significant. The receiver‐operating characteristic curves of HOMA‐IR for fasting TG, total fat percentage, abdominal fat percentage and BMI were depicted, and the optimal cut‐offs were determined by 95% CI for the normal weight controls.
The study was approved by the Regional Committee of Medical Ethics of North Norway and the Norwegian Social Science Data Services.
Results
Subject characteristics
The anthropometric, clinical and metabolic characteristics for the normal weight subjects and the healthy obese subjects are shown in Table 1. As expected, the anthropometric data showed several differences. The healthy obese subjects had several metabolic parameters that were significantly increased compared with controls, although still within the normal range (Table 1).
Table 1.
Anthropometric, metabolic and clinical characteristics at baseline between normal weight and obese subjects
| Variables | Baseline | |
|---|---|---|
| Normal weight subjects (n = 17) | Obese subjects (n = 18) | |
| Sex (M/F) | 2/15 | 3/16 |
| BMI (kg m−2) | 22 (21, 23) | 37 (34, 38)*** |
| Total fat percent (%) | 27 (24, 30) | 49 (46, 51)*** |
| Abdominal fat percent (%) | 28 (24, 31) | 56 (54, 58)*** |
| Systolic BP (mmHg) | 108 (102, 114) | 124 (118, 130)*** |
| Diastolic BP (mmHg) | 65 (62, 68) | 73 (69, 76)*** |
| Glucose (mmol L−1) | 4.5 (4.3, 4.7) | 4.8 (4.5, 5.0) |
| Insulin (μmol L−1) | 5.1 (4.0, 6.2) | 12.1 (9.8, 14.5)***, a |
| HOMA‐IR | 1 (0.8, 1.2) | 2.6 (2.0, 3.2)***, a |
| WBISI | 157 (130, 191)b | 62 (52, 74)***, b |
| Total cholesterol (mmol L−1) | 4.5 (4.1, 4.8) | 4.2 (3.9, 4.5) |
| LDL cholesterol (mmol L−1) | 2.7 (2.3, 3.0) | 2.7 (2.4, 3.1) |
| HDL cholesterol (mmol L−1) | 1.6 (1.4, 1.8) | 1.2 (1.0–1.3)*** |
| HDL/LDL ratio | 0.7 (0.5, 0.8) | 0.5 (0.4, 0.6)*, a |
| TG (mmol L−1) | 0.9 (0.7, 1.0) | 1.3 (1.1, 1.6)** |
Values are mean (95% CI).
Mann–Whitney non‐parametric test.
Geometric mean.
*P < 0.05.
**P < 0.005.
***P < 0.0001.
BMI, body mass index; BP, blood pressure; CI, confidence interval; HDL, high‐density lipoprotein; HOMA‐IR, insulin resistance by the homeostasis model assessment; LDL, low‐density lipoprotein; TG, triglyceride; WBISI, whole body insulin sensitivity index.
Insulin sensitivity
There was a significant difference in FI and a close to significant difference in fasting plasma glucose at baseline (Table 1). The cut‐off value of the HOMA‐IR defined by 95% CI on the normal weight subjects was defined as IR and was calculated to be >1.83. Twelve of the 18 healthy obese subjects (66%) had IR measured by HOMA‐IR. Furthermore, insulin sensitivity was significantly lower (higher HOMA‐IR, lower WBISI) in the healthy obese subjects (Table 1).
Postprandial triglyceride profiles
Results from the OFTT were analysed by RM‐ANOVA, and the estimated marginal means are shown in Fig. 1.
Figure 1.
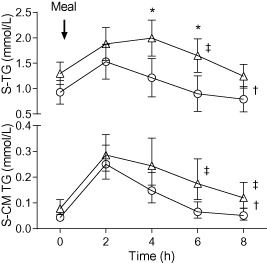
Oral fat tolerance test in apparently healthy, obese and normal weight subjects at study baseline. Upper part shows total serum triglycerides (SE‐TG) and lower part shows chylomicron triglycerides (CM‐TG). At 0 h, the subject ingested a standard meal. Asterisks denote significant difference (repeated measure analysis of variance [RM‐ANOVA]: interaction time × group; post hoc comparison, Bonferroni correction). Dagger denotes a significant difference in grand mean (RM‐ANOVA, between subjects). Double dagger denotes significant difference in triglyceride clearance at 6 or 8 h (Wilcoxon). Triangles represent obese subjects; circles represent normal weight subjects. Values are estimated marginal means (95% confidence interval).
Serum triglyceride
Grand (all time points) mean of the total SE‐TG levels was 0.54 mmol L−1 (0.20–0.94) higher in healthy obese subjects when compared with the normal weight subjects (P = 0.01). A significant interaction between time and subject group was detected (P = 0.004; Greenhouse–Geisser). The contrast showed significantly higher SE‐TG levels for the obese subjects at time points 4 (P = 0.015) and 6 h (P = 0.009) compared with the normal weight subjects (Fig. 1).
CM triglyceride
The healthy obese subjects had overall 1.8 (1.3–2.7) times higher CM‐TG (grand mean, transformed raw data, P = 0.002) (Fig. 1). No difference in time course between subject groups was detected.
Triglyceride clearance
The results of total SE‐TG and CM‐TG clearance calculations are presented in Table 2. At 6 h, a significant difference between subject groups in both SE‐TG (P < 0.001) and CM‐TG (P = 0.011) clearance is noted, whereas at 8 h the differences between subject groups can only be detected in CM‐TG clearance (P = 0.007).
Table 2.
Postprandial triglyceride (TG) clearance, chylomicron triglyceride (CM‐TG) clearance, triglyceride response (TGR) and chylomicron triglyceride response (CM‐TGR) after oral fat tolerance test at baseline
| Normal weight | Obese | P | |
|---|---|---|---|
| 6 h SE‐TG clearance (%)* | 115 (163) | 61 (96) | 0.000 |
| 8 h SE‐TG clearance (%)* | 125 (257) | 103 (100) | 0.123 |
| 6 h CM‐TG clearance (%)* | 88 (110) | 60 (104) | 0.011 |
| 8 h CM‐TG clearance (%)* | 98 (97) | 78 (114) | 0.007 |
| TGR* | 0.34 (1.8) | 0.63 (1.5) | 0.013 |
| CM‐TGR* | 0.15 (0.36) | 0.22 (0.5) | 0.006 |
Values are median (range).
*Mann–Whitney U‐test.
TGR
The results of the serum TGR (SE‐TGR) and CM‐TGR are shown in Table 2. There was a significant difference between subject groups in both SE‐TGR (P = 0.013) and CM‐TGR (P = 0.006). Significant correlations were also found between SE‐TGR and each of the variables BMI, total bodyweight (kg), total fat mass (kg) and abdominal fat percentage (data not shown). The cut‐off value of the grand SE‐TGR and CM‐TGR defined by 95% CI on the normal weight subjects is defined abnormal (pathological), and was calculated to be SE‐TGR > 0.64. Nine (50%) of the healthy obese subjects had an abnormal high SE‐TGR (>0.64). The cut‐off value of the grand CM‐TGR was calculated to be CM‐TGR > 0.28. Seven (39%) of the healthy obese subjects had an abnormally high CM‐TGR (>0.28). Significant correlations were also found between CM‐TGR and each of the variables BMI, total bodyweight (kg), total fat mass (kg) and abdominal fat percent (data not shown).
Fasting triglyceride as predictor of postprandial triglyceride clearance
We then studied if fasting TG could reflect the postprandial TG profile. A significant interaction between fasting TG vs. SE‐TG at various time points was detected in each group (P = 0.008; Greenhouse–Geisser). The contrasts showed significantly higher SE‐TG levels for the obese subjects at time points 4 (P = 0.023) and 6 h (P = 0.013) compared with the normal weight subjects, when adjusted for fasting TG level. The results of SE‐TG clearance calculations are presented in Table 2.
A significant interaction between time, subject group and fasting TG category (low normal or high normal; cut‐off 1.02 mmol L−1) was found (P = 0.007; Greenhouse–Geisser). The contrast showed significantly higher postprandial SE‐TG levels for the obese subjects with a higher fasting SE‐TG (>1.02 mmol L−1) at time points 4 (P = 0.006), 6 (P = 0.006) and 8 h (P = 0.028). The subjects with high‐normal fasting SE‐TG had also significantly higher SE‐TG (P = 0.029) and CM‐TG clearance (P = 0.027) at 6 h, while the difference at 8 h was only detected in CM‐TG clearance (P = 0.044). Thus, the 12 obese subjects with high‐normal fasting TG calculated as TG >1.02 mmol L−1 had a significant delay in TG clearance (Fig. 2).
Figure 2.
Total serum triglycerides (SE‐TG) in oral fat tolerance test in normal weight and apparently healthy, obese subjects. Estimated marginal means (standard error of the mean, SEM) of the observed interaction between weight group, fasting triglyceride group and time is plotted. Triangles represent obese subjects; circles represent normal weight subjects. Solid lines indicate fasting triglyceride level >1.02 mmol L−1; dashed lines indicate fasting triglyceride level ≤1.02 mmol L−1. Asterisks indicate significant contrast. Values are estimated marginal means (95% confidence interval).
Finally, there was a significant non‐parametric correlation between insulin sensitivity and postprandial SE‐TG clearance at 6 h (HOMA‐IR; ρ = −0.636, P = 0.000, WBISI; ρ = 0.632, P = 0.000; see Fig. 3) and CM‐TG clearance at 6 h (HOMA‐IR; ρ = −0.493, P = 0.005, WBISI: ρ = 0.555, P = 0.001), while at 8 h the significant correlation was only found between insulin sensitivity and CM‐TG clearance (HOMA‐IR; ρ = −0.527, P = 0.002, WBISI; ρ = 0.528, P = 0.002). In addition, fasting HDL cholesterol significantly correlated to the postprandial CM‐TGR (ρ = −0.520, P = 0.004), SE‐TGR (ρ = −0.429, P = 0.013), SE‐TG clearance (ρ = 0.757, P = 0.000) and CM‐TG clearance at 6 h (ρ = 0.540, P = 0.002) and CM‐TG at 8 h (ρ = 0.608, P = 0.000).
Figure 3.
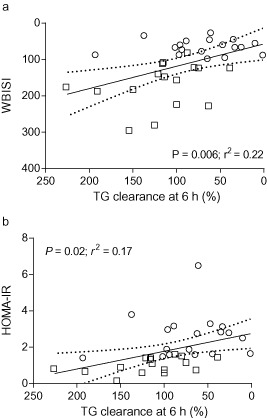
Indirect total serum triglycerides (SE‐TG) clearance at 6 h vs. insulin sensitivity (whole body insulin sensitivity index, WBISI; a) and insulin resistance (insulin resistance by the homeostasis model assessment, HOMA‐IR; b). Normal weight subjects are shown as squares, obese subjects as circles. Linear regression line is based on all subjects. Dashed lines indicate 95% confidence interval for prediction.
Correlation between insulin sensitivity and postprandial TGR
There was significant non‐parametric correlations between HOMA‐IR and WBISI and both SE‐TGR (HOMA‐IR; ρ = 0.395, P = 0.021, WBISI; ρ = −0.384, P = 0.025) and CM‐TGR (HOMA‐IR; ρ = 0.393, P = 0.021, WBISI ρ = −0.375, P = 0.049), respectively. Furthermore, 77% of the obese subjects who had a pathological SE‐TGR (>0.64), and 86% who had a pathological CM‐TGR (>0.28), also had IR measured by HOMA‐IR. Of the 12 subjects having IR measured by HOMA‐IR, 58% of these subjects also had a pathological SE‐TGR, and 50% of the 12 had an abnormally high CM‐TGR.
Fasting triglycerides as predictor of insulin sensitivity
Fasting TG as a predictor for IR defined as HOMA‐IR > 1.83 (see above) had the sensitivity of 83% and the specificity of 86% with a cut‐off value of TG > 1.13 mmol L−1. BMI as a predictor of IR measured by HOMA‐IR had the sensitivity of 92% and the specificity of 81%, with a BMI cut‐off >29.95. In this study, total body fat percentage as even a better documented predictor of IR 31 had the sensitivity of 92% and the specificity of 72%, with a cut‐off total body fat percentage of >41%. Abdominal fat percentage as a predictor of IR had in this study the best sensitivity of 100% and the specificity of 82%, with a cut‐off >51%. With a model combining BMI and fasting TG (BMI × fasting TG) as predictors of IR measured by HOMA‐IR, the sensitivity was 92% and the specificity was found to be 86% with a cut‐off value of >31.3.
Discussion
In this study, we have shown that young, apparently healthy obese subjects have a postprandial delayed metabolism of SE‐TG and CM‐TG when measured indirectly by OFTT. When adjusted for fasting TG at baseline, the obese subjects still had higher postprandial SE‐TG levels compared with the normal weight controls. The obese subjects with a fasting TG > 1.02 mmol L−1 and TG > 1.13 mmol L−1 had a significantly delayed SE‐TG and CM‐TG clearance, and pathological insulin sensitivity, respectively. Our data indicate that young, apparently healthy obese subjects have early metabolic disturbances.
Insulin sensitivity
In agreement with other studies 28, 29, 30, 66% of the apparently healthy obese subjects had IR defined by HOMA‐IR (>1.83) based on 95% CI of the normal weight subjects. This limit is in well agreement with other studies performing comparisons of HOMA‐IR to the gold standard method glucose clamp 29. In our study with a median BMI around 35, two‐thirds had IR, and this is similar to that observed in other reports with the same BMI 28, 29, 30. In the postprandial state, IR is associated with increased intestinal production of CM 32. The RM‐ANOVA model of postprandial TG clearance did not include HOMA‐IR in addition to fasting TG, in part, because of the low statistical power and, in part, because the statistical model becomes unstable when entering closely correlated variables, such as HOMA‐IR and fasting TG. To explore this further, we tested replacing fasting TG with HOMA‐IR; however, this model was inferior to the model presented here and explained less of the variance in the data set. In our study, as expected, the postprandial TG clearance, SE‐TGR and CM‐TGR was significantly correlated to the insulin sensitivity, reflecting the LPL activity in the endothelium 33. There are some factors related to IR that we did not measure in this study. Among them are hepatic lipid content, gastric motility, leptin, adiponectin and modified VLDL export. It would be of interest to investigate the combined relationship among these factors and postprandial triglyceride clearance in a future study.
Characteristics of postprandial triglyceride metabolism
Using an OFTT test, there was a delayed peak and clearance of postprandial SE‐TG and CM‐TG in the obese subjects compared with the normal weight controls. Moreover, CM‐TG was the most sensitive test as significant differences were observed both after 6 and 8 h postprandial. A postprandial delayed SE‐TG clearance is well documented in overweight and obese subjects with fasting hypertriglyceridaemia (for review, see 33), whereas diverging results exist for CM‐TG 15. Moreover, similar studies in healthy, obese subjects with normal fasting TG few reports exist, and especially for CM‐TG. In two studies of obese subjects with normal fasting TG levels, a delayed postprandial metabolism of TG was observed, but the study groups were small 17, 18. As far as we know, no reports exist for postprandial CM‐TG. The postprandial TG in serum and in CM has been reported to be a key marker, and a more sensitive risk factor for atherosclerosis than the corresponding fasting levels 34 (for review see 35). The greater the magnitude and duration of the postprandial TG response, the arterial wall will be more exposed to postprandial TRL. The longer duration of the postprandial TRL in the bloodstream will give more time to replace cholesterol ester in LDL and HDL, favouring the transformation of LDL to be a smaller and more pro‐atherogenic particle, and making HDL more dysfunctional. Moreover, the mechanism of TRL's influence on lowering the HDL level is believed to be due to the enrichment of TG to the HDL particle, which leads to increased catabolism of Apo‐A‐I HDL (for review see 36).
In our study, the fasting TG levels were significantly higher, and the fasting HDL cholesterol was significantly lower in the healthy obese subjects than in the normal weight controls, although within the normal range. As expected the fasting HDL cholesterol significantly correlated to the postprandial CM‐TGR, SE‐TGR, SE‐TG clearance and CM‐TG clearance at 6 h, and CM‐TG at 8 h. This implies that an OFTT can be performed to unmask early changes in the TG metabolism in overweight and obese subjects that may have strategic therapeutical implications. The OFTT may be a way to identify overweight and obese subjects at high risk of developing the metabolic disturbances.
There are several lifestyle factors contributing to delayed clearance of postprandial triglycerides. Among them are low level of physical activity, low intake of omega 3 fatty acids and high alcohol intake. Some studies have shown that low fat and high carbohydrate diets may increase the postprandial triglycerides. The study subjects did a 12‐h fast before the OFTT, in agreement with other studies 20, 21, 37. However, if the subjects would have a longer fasting period, one might hypothesize an even lower postprandial triglyceride level in both groups. However, to explore real‐life reflection of postprandial triglycerides in the study subjects, 12 h fast is considered enough to reach a fasting state. This was also reflected on the TG profile during the OFTT of duration of 8 h. In addition, the study subjects had a ‘normal’ food intake, without extensive amount of fat and no alcohol 3 days prior to the OFTT, to reflect the reference population. However, they did not fill out a 3‐day food or activity diary and the amount of omega‐3 fatty acids in the diet was not investigated; this may be a weakness of the study. On the other hand, the participants did not follow a specific diet at inclusion, as we wanted to explore the reference population in a non‐dieting group.
Fasting triglyceride as predictor of postprandial lipid profile
All of the apparently healthy obese subjects included in the study had fasting TG in the normal range. In addition, the obese subjects with high‐normal fasting TG (>1.02 mmol L−1) had delayed postprandial TG clearance compared with both the obese subjects with low normal fasting TG and normal weight subjects. This indicates that in healthy, obese subjects fasting TG in the upper normal range predicts a delayed postprandial TG clearance both in serum and in CM. It is well known that fasting TG levels are strongly associated to the postprandial TG metabolism 38. Another strong influence on the postprandial TG profile is abdominal obesity 13, 14, 15, 16. All of the apparently healthy, obese subjects had abdominal obesity according to the WHO and International Diabetes Federation (waist circumference >88 cm [80] for women and >102 cm [94] for men). In our study, abdominal fat percentage was strongly correlated to postprandial TG profile as expected 13, 14, 15, 16.
Fasting triglycerides as a predictor for insulin sensitivity
IR is closely related to postprandial lipid metabolism because of insulin's influence on LPL activity in the vascular endothelium 12. In our study, 77% of the obese subjects who had a pathological SE‐TGR, and 86% who had a pathological CM‐TGR, also had IR measured by HOMA‐IR. Moreover, we also found that fasting TG, in the normal range, predicted IR with a sensitivity of 83% and the specificity of 86% with a cut‐off value of TG > 1.13 mmol L−1. Our findings that fasting TG in the normal range in obese subjects can predict IR is of great utility in clinical practice. The calibrated cut‐off of fasting TG of 1.13 mmol L−1 should therefore be followed up with a validation study.
The advantage of this study is that it focuses on TRLs, with a specific focus on CMs on apparently healthy, non‐dieting, obese subjects.
However, in our study there are also some areas with limitations. First, the sex distribution is unbalanced among our participants. This indicates a need to confirm our results in a larger study population to explore sex differences. Second, a quantitative and direct estimate of the triglyceride clearance like isotopic labelling is the gold standard; in our study, triglyceride clearance was estimated indirectly. However, OFTT has been proven to have a strong correlation to triglyceride clearance when compared with other methods 19. Third, LPL activity 11 was not measured that would also be of importance in a future study.
Conclusion
In apparently healthy obese subjects, early metabolic disturbances with delayed metabolism of postprandial SE‐TG and CM can be observed. When adjusted for fasting TG at baseline, the obese subjects still had higher postprandial SE‐TG levels compared with normal weight controls. A sub‐analysis revealed that fasting TG level in the higher normal range predicted delayed postprandial TG clearance and IR, but only in obese subjects. Further studies should focus on a new and possibly lower normal range for fasting TG in obese subjects, as this may have therapeutic implications.
Conflict of Interest Statement
No conflict of interest was declared.
Author contributions
MAL designed the study, conceived and carried out the experiments and data collection, analysed the data and wrote the manuscript. RG analysed the data, supervised the manuscript and generated figures. SL contributed to the design of the study. OSM carried out some of the tests. JF designed the study and supervised the manuscript. All the authors had final approval of the article before submission.
Acknowledgements
This study was supported by funding from the Research Student Program, Faculty of Medicine, University of Tromsø, Tromsø, Norway, and funding grant by ‘Helse Nord’, Norway. We highly appreciate the support from our colleagues at the University of Tromsø, Norway: Birgit Svensson at the Laboratory of Medicine, Ingrid Christiansen at the Laboratory of Gastroenterology and Nutrition and Åse Lund at the Laboratory of Metabolism, Institute of Clinical Medicine. We appreciate the advice from Professor John‐Bjarne Hansen at the Laboratory of Medicine. We also appreciate the help in the recruiting process from dietician Hugo Nilssen, Department for Nutrition, University Hospital Northern‐Norway.
The copyright line for this article was changed on 2 November 2016 after original online publication
References
- 1. Lim SS, Vos T, Flaxman AD et al A comparative risk assessment of burden of disease and injury attributable to 67 risk factors and risk factor clusters in 21 regions, 1990–2010: a systematic analysis for the Global Burden of Disease Study 2010. Lancet 2012; 380: 2224–2260. [DOI] [PMC free article] [PubMed] [Google Scholar]
- 2. James WP. A public health approach to the problem of obesity. Int J Obes Relat Metab Disord 1995; 19(Suppl. 3): S37–S45. [PubMed] [Google Scholar]
- 3. Prentice AM, Jebb SA. Obesity in Britain: gluttony or sloth? BMJ 1995; 311: 437–439. [DOI] [PMC free article] [PubMed] [Google Scholar]
- 4. Tonstad S, Despres JP. Treatment of lipid disorders in obesity. Expert Rev Cardiovasc Ther 2011; 9: 1069–1080. [DOI] [PubMed] [Google Scholar]
- 5. Zilversmit DB. Atherogenesis: a postprandial phenomenon. Circulation 1979; 60: 473–485. [DOI] [PubMed] [Google Scholar]
- 6. Proctor SD, Mamo JC. Arterial fatty lesions have increased uptake of chylomicron remnants but not low‐density lipoproteins. Coron Artery Dis 1996; 7: 239–245. [PubMed] [Google Scholar]
- 7. Proctor SD, Vine DF, Mamo JC. Arterial permeability and efflux of apolipoprotein B‐containing lipoproteins assessed by in situ perfusion and three‐dimensional quantitative confocal microscopy. Arterioscler Thromb Vasc Biol 2004; 24: 2162–2167. [DOI] [PubMed] [Google Scholar]
- 8. Patsch JR, Miesenbock G, Hopferwieser T et al Relation of triglyceride metabolism and coronary artery disease. Studies in the postprandial state. Arterioscler Thromb 1992; 12: 1336–1345. [DOI] [PubMed] [Google Scholar]
- 9. Weintraub MS, Grosskopf I, Rassin T et al Clearance of chylomicron remnants in normolipidaemic patients with coronary artery disease: case control study over three years. BMJ 1996; 312: 935–939. [DOI] [PMC free article] [PubMed] [Google Scholar]
- 10. Ooi TC, Cousins M, Ooi DS et al Postprandial remnant‐like lipoproteins in hypertriglyceridemia. J Clin Endocrinol Metab 2001; 86: 3134–3142. [DOI] [PubMed] [Google Scholar]
- 11. Olivecrona T, Olivecrona G. Lipoprotein Lipase and Hepatic Lipase in Lipoprotein Metabolism. Arnold: London, 1999. [Google Scholar]
- 12. Panarotto D, Rémillard P, Bouffard L, Maheux P. Insulin resistance affects the regulation of lipoprotein lipase in the postprandial period and in an adipose tissue‐specific manner. Eur J Clin Invest 2002; 32: 84–92. [DOI] [PubMed] [Google Scholar]
- 13. Emmons RR, Garber CE, Cirnigliaro CM et al The influence of visceral fat on the postprandial lipemic response in men with paraplegia. J Am Coll Nutr 2010; 29: 476–481. [DOI] [PubMed] [Google Scholar]
- 14. Blackburn P, Lamarche B, Couillard C et al Contribution of visceral adiposity to the exaggerated postprandial lipemia of men with impaired glucose tolerance. Diabetes Care 2003; 26: 3303–3309. [DOI] [PubMed] [Google Scholar]
- 15. Mekki N, Christofilis MA, Charbonnier M et al Influence of obesity and body fat distribution on postprandial lipemia and triglyceride‐rich lipoproteins in adult women. J Clin Endocrinol Metab 1999; 84: 184–191. [DOI] [PubMed] [Google Scholar]
- 16. Vansant G, Mertens A, Muls E. Determinants of postprandial lipemia in obese women. Int J Obes Relat Metab Disord 1999; 23(Suppl. 1): 14–21. [DOI] [PubMed] [Google Scholar]
- 17. Guerci B, Verges B, Durlach V et al Relationship between altered postprandial lipemia and insulin resistance in normolipidemic and normoglucose tolerant obese patients. Int J Obes Relat Metab Disord 2000; 24: 468–478. [DOI] [PubMed] [Google Scholar]
- 18. Nabeno‐Kaeriyama Y, Fukuchi Y, Hayashi S et al Delayed postprandial metabolism of triglyceride‐rich lipoproteins in obese young men compared to lean young men. Clin Chim Acta 2010; 411: 1694–1699. [DOI] [PubMed] [Google Scholar]
- 19. Cohen JC. Chylomicron triglyceride clearance: comparison of three assessment methods. Am J Clin Nutr 1989; 49: 306–313. [DOI] [PubMed] [Google Scholar]
- 20. Nordoy A, Bønaa KH, Sandset PM, Hansen JB, Nilsen H. Relationship between apolipoprotein E polymorphism, postprandial hyperlipemia and hemostatic variables in patients with combined hyperlipemia. Nutr Metab Cardiovasc Dis 2000; 10: 15–23. [PubMed] [Google Scholar]
- 21. Lekhal S, Borvik T, Nordoy A, Hansen JB. Increased postprandial triglyceride‐rich lipoprotein levels in elderly survivors of myocardial infarction. Lipids 2008; 43: 507–515. [DOI] [PubMed] [Google Scholar]
- 22. Aviram M, Brox J, Nordoy A. Effects of postprandial plasma and chylomicrons on endothelial cells. Differences between dietary cream and cod liver oil. Acta Med Scand 1986; 219: 341–348. [DOI] [PubMed] [Google Scholar]
- 23. Terpstra AH. Isolation of serum chylomicrons prior to density gradient ultracentrifugation of other serum lipoprotein classes. Anal Biochem 1985; 150: 221–227. [DOI] [PubMed] [Google Scholar]
- 24. Burstein M, Scholnick HR, Morfin R. Rapid method for the isolation of lipoproteins from human serum by precipitation with polyanions. J Lipid Res 1970; 11: 583–595. [PubMed] [Google Scholar]
- 25. Friedewald WT, Levy RI, Fredrickson DS. Estimation of the concentration of low‐density lipoprotein cholesterol in plasma, without use of the preparative ultracentrifuge. Clin Chem 1972; 18: 499–502. [PubMed] [Google Scholar]
- 26. Matthews DR, Hosker JP, Rudenski AS et al Homeostasis model assessment: insulin resistance and beta‐cell function from fasting plasma glucose and insulin concentrations in man. Diabetologia 1985; 28: 412–419. [DOI] [PubMed] [Google Scholar]
- 27. Matsuda M, DeFronzo RA. Insulin sensitivity indices obtained from oral glucose tolerance testing: comparison with the euglycemic insulin clamp. Diabetes Care 1999; 22: 1462–1470. [DOI] [PubMed] [Google Scholar]
- 28. Esteghamati A, Ashraf H, Khalilzadeh O et al Optimal cut‐off of homeostasis model assessment of insulin resistance (HOMA‐IR) for the diagnosis of metabolic syndrome: third national surveillance of risk factors of non‐communicable diseases in Iran (SuRFNCD‐2007). Nutr Metab (Lond) 2010; 7: 26. [DOI] [PMC free article] [PubMed] [Google Scholar]
- 29. Gayoso‐Diz P, Otero‐Gonzalez A, Rodriguez‐Alvarez MX et al Insulin resistance (HOMA‐IR) cut‐off values and the metabolic syndrome in a general adult population: effect of gender and age: EPIRCE cross‐sectional study. BMC Endocr Disord 2013; 13: 47. [DOI] [PMC free article] [PubMed] [Google Scholar]
- 30. Gayoso‐Diz P, Otero‐Gonzalez A, Rodriguez‐Alvarez MX et al Insulin resistance index (HOMA‐IR) levels in a general adult population: curves percentile by gender and age. The EPIRCE study. Diabetes Res Clin Pract 2011; 94: 146–155. [DOI] [PubMed] [Google Scholar]
- 31. Wedin WK, Diaz‐Gimenez L, Convit AJ. Prediction of insulin resistance with anthropometric measures: lessons from a large adolescent population. Diabetes Metab Syndr Obes 2012; 5: 219–225. [DOI] [PMC free article] [PubMed] [Google Scholar]
- 32. Duez H, Lamarche B, Uffelman KD et al Hyperinsulinemia is associated with increased production rate of intestinal apolipoprotein B‐48‐containing lipoproteins in humans. Arterioscler Thromb Vasc Biol 2006; 26: 1357–1363. [DOI] [PubMed] [Google Scholar]
- 33. Lopez‐Miranda J, Williams C, Lairon D. Dietary, physiological, genetic and pathological influences on postprandial lipid metabolism. Br J Nutr 2007; 98: 458–473. [DOI] [PubMed] [Google Scholar]
- 34. Nakajima K, Nakano T, Moon HD et al The correlation between TG vs remnant lipoproteins in the fasting and postprandial plasma of 23 volunteers. Clin Chim Acta 2009; 404: 124–127. [DOI] [PMC free article] [PubMed] [Google Scholar]
- 35. Kolovou GD, Mikhailidis DP, Kovar J et al Assessment and clinical relevance of non‐fasting and postprandial triglycerides: an expert panel statement. Curr Vasc Pharmacol 2011; 9: 258–270. [DOI] [PubMed] [Google Scholar]
- 36. Rashid S, Uffelman KD, Lewis GF. The mechanism of HDL lowering in hypertriglyceridemic, insulin‐resistant states. J Diabetes Complications 2002; 16: 24–28. [DOI] [PubMed] [Google Scholar]
- 37. Agledahl I, Hansen JB, Svartberg J. Postprandial triglyceride metabolism in elderly men with subnormal testosterone levels. Asian J Androl 2008; 10: 542–549. [DOI] [PubMed] [Google Scholar]
- 38. Alcala‐Diaz JF, Delgado‐Lista J, Perez‐Martinez P et al Hypertriglyceridemia influences the degree of postprandial lipemic response in patients with metabolic syndrome and coronary artery disease: from the CORDIOPREV study. PLoS ONE 2014; 9: e96297. [DOI] [PMC free article] [PubMed] [Google Scholar]