

Summary
Although many genetic factors and lifestyle interventions are known to affect the mean lifespan of animal populations, the physiological variation displayed by individuals across their lifespans remains largely uncharacterized. Here, we use a custom culture apparatus to continuously monitor five aspects of aging physiology across hundreds of isolated Caenorhabditis elegans individuals kept in a constant environment from hatching until death. Aggregating these measurements into an overall estimate of senescence, we find two chief differences between longer- and shorter-lived individuals. First, though long- and short-lived individuals are physiologically equivalent in early adulthood, longer-lived individuals experience a lower rate of physiological decline throughout life. Second, and counter-intuitively, long-lived individuals have a disproportionately extended “twilight” period of low physiological function. While longer-lived individuals experience more overall days of good health, their proportion of good to bad health, and thus their average quality of life, is systematically lower than that of shorter-lived individuals. We conclude that within a homogeneous population reared under constant conditions, the period of early-life good health is comparatively uniform and the most plastic period in the aging process is end-of-life senescence.
eTOC
Zhang et al. use a novel culture system to study inter-individual variation in aging in C. elegans. They uncover systematic, qualitative differences in the aging process of short- vs. long-lived individuals within a wild-type population.
Introduction
Pioneering work over the last quarter century has identified many molecular pathways involved in determining lifespan and illustrated that aging is a plastic process (Kenyon, 2010, 2005; Guarente and Kenyon, 2000). Many genes, small molecules, and environmental interventions have been found that alter a population’s mean lifespan. However, even in very homogeneous conditions, there is a large degree of variability in the lifespan of individuals around that population’s mean (Vaupel et al., 1998). Comparatively little is known, however, about the origins and consequences of inter-individual differences in the aging process.
In general, the bulk of variability in lifespan is of not of genetic origin, and persists even in homogeneous environmental conditions. Studies estimate that only 15–25% of variation in human lifespan is attributable to genetic variation (Christensen et al., 2006; Gögele et al., 2011; Pettay et al., 2005; Herskind et al., 1996). Moreover, genetically identical populations of model organisms, reared in tightly controlled laboratory conditions have a similar degree of variability in lifespan as outbred humans (relative to the population mean) (Kirkwood et al., 2005; Vaupel et al., 1998). Even conditions and mutations that dramatically extend or shorten lifespan do not generally change the degree of inter-individual variation in longevity (Stroustrup et al., 2016).
This raises a fundamental question: what distinguishes long-lived from short-lived individuals, when they are genetically identical and reared in the same cage, vial, or culture dish? Previous studies of single individuals have identified inter-individual differences in gene expression that are predictive of future lifespan in C. elegans, either early (Pincus et al., 2011; Golden et al., 2008) or late (Sánchez-Blanco and Kim, 2011; Golden et al., 2008) in adulthood. However, chronological lifespan merely measures the end of a complex process of aging and senescence. Pioneering studies of individual animals have therefore sought correlates of early and mid-life physiological health as well (Glenn et al., 2004; Chow et al., 2006; Golden et al., 2008; Eckley et al., 2013). However, due to technical limitations and the use of invasive measurements, many of these efforts were unable to follow an individual’s health longitudinally through time. Therefore, the relationship between the complex progression of aging and ultimate lifespan has been relatively unstudied.
In this work, we focus on the physiological changes that characterize senescent decline in individual C. elegans (Klass, 1977; Hosono et al., 1980; Herndon et al., 2002; Huang et al., 2004). In particular, we determined how the physiological process of aging differs between long- and short-lived wild-type C. elegans. Do individuals with different lifespans senesce in a qualitatively different manner? Or does an identical aging process simply play out at a different rate for short- and long-lived individuals? In order to address these questions, we developed an experimental technique to isolate and image many individual C. elegans over each animal’s entire lifespan. This is not possible with existing automated vermiculture methods, which generally focus on enumeration of lifespans for screening purposes (Gill et al., 2003; Hertweck and Baumeister, 2005; Stroustrup et al., 2013), and are not designed for making detailed measurements of physiology. Here, using custom microscopy hardware and image-analysis software, we performed a battery of non-invasive physiological measurements of each individual, every three hours over their approximately two-week lifespans. This dataset of longitudinal measures of 734 animals, based on over 400,000 images obtained at subcellular resolution, allowed us to retrospectively understand how and when the aging process diverges between long- and short-lived individuals.
Results
Longitudinal Measurements of Physiology in Individual C. elegans
In order to measure physiological changes throughout aging, we developed a specialized culture system to allow for observation of many freely moving, isolated individuals throughout their entire lives. This new system improves on our previous culture techniques (Pincus et al., 2011), allowing for denser culture (~100 animals per standard microscope slide) and fully automated image acquisition and processing. In brief, we produce a smooth hydrogel surface atop standard microscope slides by polymerizing polyethylene glycol (PEG) monomers in situ (see Methods and Resources). We then dispense a grid of ~2 mm diameter droplets of concentrated bacteria onto the gel, to provide a food source. After allowing each droplet to adsorb to the surface, we transfer one egg from the temperature-sensitive sterile strain spe-9(hc88) to each food pad. Finally, we pour a thin layer of polydimethylsiloxane (PDMS) over the gel. While polymerizing overnight at room temperature, the PDMS also cross-links with unreacted acrylate moieties in the PEG gel. This cross-linking proceeds everywhere except where the PEG is separated from the PDMS by the bacterial food pads. Thus while each individual C. elegans is free to move about the 2-dimensional surface of its food pad, it is constrained at all borders by strong covalent bonds within and between the PEG and PDMS polymers (Figure 1A).
Figure 1. Experimental workflow.

(A) A novel culture device allows for lifelong, longitudinal observation of a high-density array of isolated individual C. elegans. Individuals are free to move about on pads of bacterial food, but cannot depart the pads. (B) Images of each individual C. elegans are acquired every three hours throughout life, at 2.2-μm resolution. The spe-9(hc88) temperature-sensitive sterile strain is used to prevent reproduction. Unfertilized oocytes are visible as dark clumps on the bacterial food pad. (C) Custom software automatically annotates the region of the food pad and the position of the animal. (D) These annotations are used to make several physiological measurements (left to right): Movement between and within timepoints is scored as a measure of neuromuscular function. The brightfield image of the animal is used to automatically score tissue integrity. Red autofluorescence is used as a measure of macromolecular homeostasis. To characterize somatic maintenance, body size is measured as cross-sectional area. Last, the number of oocytes laid is counted as a measure of reproductive investment. (E) This battery of five longitudinal physiological measurements is aggregated together to produce an estimate of remaining lifespan at each timepoint. We use this “prognosis” as an operational definition of an individual’s overall degree of senescence. (F) Examples of prognosis scores. Left: a healthy, young adult with 10.3 estimated days of life remaining. Right: an unhealthy, late-life animal with 0.5 estimated days remaining.
We placed slides constructed in this fashion on the stage of a computer-controlled microscope, housed in a temperature- and humidity-controlled enclosure. Every three hours, timepoint data for each individual was acquired autonomously, driven by custom microscope-control scripts (Figure 1B). We designed a comprehensive panel of phenotypic measurements encompassing five diverse aspects of aging physiology. For this, we drew from previously validated “biomarkers of aging” (Baker and Sprott, 1988; Pincus and Slack, 2010). These biomarkers measure aspects of physiology that differ prospectively between long- and short-lived individuals, and can thus be used to predict an individual’s future lifespan. First, we examined C. elegans neuromuscular function, as measured by locomotory ability. Second, we assessed age-associated tissue deterioration through quantitative measurements of textural order and disorder in brightfield images (Johnston et al., 2008; Pincus et al., 2011). Third, we measured age-related declines in homeostatic ability, as manifested in the accumulation of fluorescent non-hydrolyzable materials in intestinal endosomes (Klass, 1977; Clokey and Jacobson, 1986; Gerstbrein et al., 2005; Hermann et al., 2005; Pincus et al., 2016). Fourth, we evaluated nutritional history and somatic investment through cross-sectional body size (Pincus et al., 2011; Hulme et al., 2010). Fifth, we quantified reproductive output and investment through the number of oocytes laid (Huang et al., 2004; Pickett et al., 2013). These measurements were all performed via custom, fully automated image segmentation and analysis software (Figure 1C and D; see Methods and Resources). Taken together, this panel comprises a diverse set of individual measurements, allowing us to characterize longitudinal changes in distinct aspects of aging physiology.
Distinct Physiology of Long- vs. Short-Lived Individuals
In total, we observed 734 individuals from hatching to death, through the stages of larval development, reproductive maturity, and senescence. The population, maintained throughout life at 25°C, had a mean lifespan of 12.1 days with a stand ard deviation of 2.3 days from hatch, within the range of lifespans previously observed at this temperature (Byerly et al., 1976; Fabian and Johnson, 1994; Pincus et al., 2011). In order to rule out potential systematic biases in our data, we confirmed that overall lifespan distributions are consistent across experimental runs spanning roughly three months of time (Figure S1A), and are not influenced by the specific culture slide used within an experimental run, or by the spatial position of an individual’s food pad within the slide (Figure S1B–G).
We find that virtually all variation in lifespan is due to differences in the period between reproductive maturity and death, rather than in the length of larval development (Figure S1H–J). Though larval development takes 2.1 days on average (17.3% of an average animal’s lifespan), the variability of time in development accounts for less than 0.1% of the variability in total lifespan. Therefore, we limited our analysis to the animals’ lifespans after reproductive maturity.
The mean adult lifespan in our population is 10.0 days, ranging from 2.2–15.5 days. For illustration, we grouped the animals into seven cohorts by lifespan, with the first cohort containing individuals with adult lifespans of 2–4 days, the second containing individuals with adult lifespans of 4–6 days, and so forth (Figures 2A and B, S2), and plotted cohort averages of each of our physiological measurements over time (Figure 2C). For our measures of autofluorescence, body texture, and long-term movement, we observed a graded difference between shorter-lived and longer-lived cohorts (Figure 2D–F). At any given age, the shorter-lived cohorts had higher levels of autofluoresence, worse tissue maintenance, and were less mobile than their longer-lived peers. In contrast, for our measures of body size and reproductive output, we noticed a nonlinear trend among our lifespan cohorts (Figure 2G and H). For animals with adult lifespans from 2 to 8 days, larger body size and greater reproductive output were correlated with longer life, as in the existing literature (Huang et al., 2004; Hulme et al., 2010; Pincus et al., 2011). Among the longest-lived cohorts, however, this trend reverses itself: of individuals with lifespans between 10 and 16 days, longer-lived individuals tend to be smaller and produce fewer oocytes.
Figure 2. Variation in lifespan and physiology within a homogeneous population.

(A) The survival curve for all 734 individuals in our study population, as a function of age after reproductive maturity. (B) Histogram of the number of individuals in each of seven cohorts, grouped by lifespan into 2-day-wide bins. A kernel density estimate of the underlying distribution of ages at death is shown in black. (C) An illustration of how we calculate trends of a given measurement over time. At left, the distributions of values for some lifespan-predictive measurement are shown for a long- and short-lived cohort, at day three of adulthood. Dashed lines show the mean of each distribution. At right, the trend in these means over time is plotted for each cohort. (D) Trends of bulk movement between three-hour timepoints over time, for each lifespan cohort. Due to the limited size of the food pad, this measurement saturates around 160 μm/hour. (E) Trends in autofluorescence over time, measured as the 80th percentile of whole-body red-channel autofluorescence. (F) Trends in tissue integrity score over time. This score is produced via support vector regression that maps brightfield image texture into an estimate of remaining days of life. (G) Trends in cumulative oocytes laid. (H) Trends in body size.
We therefore examined this nonlinear relationship between longevity and certain aspects of physiology more closely. Overall, this effect is largely driven by a small subpopulation (13.7% of the total) of small, sickly-looking individuals that appear unhealthy throughout their lives but have very long lifespans (Figure S3A–G). We have also found evidence of this population in standard C. elegans culture conditions (Figure S3D). Overall, however, the existence of this sub-population suggests that there may be a component of functional health that can be de-coupled from lifespan. In particular, it appears that some longer-lived individuals may be qualitatively less healthy over the course of their lives compared to shorter-lived peers. Regardless, excluding this population does not substantially alter the results described below (Figure S4A–H).
Differences in Aging Rate and Health at Death in Long- vs. Short-Lived Individuals
To understand how aging differs in long- and short-lived individuals, we developed a physiological measure of overall senescence. Since the main hallmark of aging is increased mortality over time, more senescent (i.e. less healthy) individuals have shorter expected future lifespans. As each of the diverse physiological parameters we measured is a known biomarker of aging – that is, a predictor of future lifespan – we therefore aggregated these measures into a single, maximally informative estimate of future lifespan. We use this estimate, which we term prognosis, as a measure of an individual’s degree of senescence, or, equivalently, its state of health.
To construct this prognosis, we first verified that in our dataset, each of our measures is a bona fide biomarker of aging and of mortality (Table S3). The trends over time of the raw measurements also indicate that the relationship between each parameter and future lifespan is generally nonlinear (Figure 2D–H). Therefore, we used support vector regression to define a nonlinear mapping from an individual’s measured physiological parameters at any given timepoint to an estimate of its future lifespan at that time. The overall r2 for this regression is 0.695 (10-fold cross-validated r2 = 0.669), suggesting that throughout life, these measures are able to explain the bulk of the total variability in future lifespan. While some of the measurements correlate with one another and thus redundantly measure certain aspects of physiology (Table S1), each contributes a measurable amount of independent, nonredundant information about future lifespan (Tables S2 and S3). This indicates the physiological parameters as a set, and thus our prognosis score, report on multiple distinct aspects of the aging process. We also verified that this prognosis score is neither driven by our choice of regression methodology, nor by any particular physiological measurement (these analyses are described in the STAR Methods section).
We next use this prognosis of future lifespan to distinguish among several possibilities for how long- and short-lived individuals differ in physiological aging. First, it could be that short-lived individuals simply start their adulthoods in worse health (the “starting point hypothesis”; Figure 3A). Second, it is possible that senescence proceeds more rapidly in short-lived individuals (the “rate of aging hypothesis”; Figure 3B). Finally, it may be the case there is no difference in the trajectory of senescent decline between long- and short-lived individuals, and all individuals start out with similar prognoses and decline at the same rate. Here, shorter-lived animals will be those that die “prematurely”, in more healthy-appearing states, before the full process of senescence has played out (the “premature death hypothesis”; Figure 3C). In this latter case, all individuals would be, by our measurements, indistinguishable over the course of aging, and death would be stochastic and unpredictable. Short-lived individuals would differ from long-lived ones by simply happening to be the ones that died early.
Figure 3. How does aging physiology differ between long- and short-lived individuals?

(A) “Starting Point” hypothesis: long-lived individuals start their adulthood healthier than short-lived individuals. (B) “Rate of Aging” hypothesis: long-lived individuals age more slowly than do short-lived individuals. (C) “Premature Death” hypothesis: short- and long-lived individuals are indistinguishable over the course of their lives. In this case, differences in lifespan arise from stochastic, inherently unpredictable causes of death or from factors outside our prognostic criteria. (D) Trends in the decline of prognosis over time, for each of the seven lifespan cohorts in Figure 2. These qualitatively match the “rate of aging” and “premature death” hypotheses from panels b and c. (E) We observe little quantitative relationship between lifespan and starting health (measured by an individual’s prognosis score at reproductive maturity). (F) In contrast, there is a strong negative correlation between lifespan and the rate of decline of physiological health. (G) Last, there is a moderate negative correlation between health at death and lifespan, suggesting stochasticity in death or unmeasured differences in functional health.
The trajectories of our health score look very similar to those predicted by the “rate of aging” and “premature death” hypotheses, even from a cursory visual inspection of Figure 3D. To test this more rigorously, we examined the relationships between lifespan and an individual’s prognosis at the first day of adulthood (i.e. its starting health), its rate of decline in prognosis (its rate of aging, or senescence), and its prognosis at the time of death (how “premature” its demise appears to have been, based on its health immediately prior to death). As shown in Figure 3E and F, there is no substantial relationship between starting health and lifespan, but a strong correlation between the rate of decline (as measured by simply subtracting an individual’s ending health from its starting health and dividing by its lifespan) and lifespan (Pearson r2 = 0.676; p < 10−180, F-test; Spearman ρ2 = 0.615; p < 10−153, F-test) and a modest one between prematurity of death and lifespan (Pearson r2 = 0.096; p < 10−30, F-test; Spearman ρ2 = 0.123; p < 10−16, F-test). (Quadratic fits were used to estimate r2 values due to the clear nonlinearity of these two relationships.) This latter trend indicates a modest but significant contribution either from stochastic death, or from differences in health not captured by our measurements. Overall, we conclude that long-lived individuals are not physiologically different from short-lived individuals at the start of reproductive maturity, but age more slowly throughout adulthood and experience the full scope of senescent decline.
Uneven Rates of Aging Produce Lower Quality of Life in Longer-Lived Individuals
Next, we asked whether long and short-lived individuals exhibit qualitatively different aging processes, in addition to having quantitatively different rates of aging. The black line in Figure 4A presents a “neutral rate of aging” for both long- and short-lived individuals: the level of health decreases uniformly throughout life. However, an individual might have a positive deviation (green line) from the neutral, straight-line decline, such that the individual appears to maintain a high level of function until a precipitous decline at the very end of its life – a phenomenon known as “morbidity compression” (Fries, 1980). Alternately, an individual may have a negative deviation (red line) from the neutral decline, and will thus senesce relatively early in its life, and persist in an extended “twilight” period of low physiological function for a larger fraction of its life.
Figure 4. Systematic differences in the trajectories of physiological decline.

(A) The pattern of decline can differ even among individuals with identical lifespans, starting prognoses, and ending prognoses. Individuals may experience senescence evenly throughout life (black; “neutral decline”). Alternately, senescence can accelerate early (red; a “negative deviation”), which produces a relatively extended period of low function. Finally, senescence can be delayed (green; “positive deviation”), leading to a compressed period of low function. (B) We quantify an individual’s trajectory deviation as the area between the actual trajectory (green) and a linear decline (black). This value is positive for trajectories above neutral decline, and negative for those below. To compare individuals with different lifespans, we divide this total area by each individual’s lifespan to produce the “average deviation” throughout life. (C) How trajectories of senescent decline may differ between long- and short-lived individuals. Left: Senescence is identical between long- and short-lived individuals and is merely stretched in time, causing the trajectories to align when plotted in terms of the relative fraction of life elapsed. Middle: Longer-lived individuals might have more positive deviations from neutral declines. Right: Shorter-lived individuals may have more positive deviations. (D) Trajectories of senescence for different lifespan cohorts in relative time. As in the “negative hypothesis”, shorter-lived individuals are systematically healthier at any given fraction of adult lifespan. (E) Lifespan is plotted against “average deviation”, where neutral decline is defined as the straight line between the population mean prognoses at reproductive maturity and death. Longer-lived individuals have negative deviation, while short-lived individuals experience positive deviation. (F) After controlling for differences in starting and ending prognosis, the “negative hypothesis” still applies qualitatively and (G) quantitatively.
To visualize these qualitatively different classes of functional declines independently of their quantitative rate, we represent physiological change not as a function of chronological time, but as a function of the relative fraction of lifespan elapsed. If the process of aging is identical between long- and short-lived individuals except for differences in rate, then the trajectory of physiological decline of cohorts with different lifespans should fully overlap when rescaled to “relative time” (Figure 4C, left). Alternately, long-lived individuals may have systematically more positive deviations, and thus will remain healthy for a greater proportion of their lives (Figure 4C, center). This would lead long-lived animals to experience a higher average quality of life, as measured by the area under the health vs. relative-lifespan curve for long-lived vs. short-lived individuals. Finally, the opposite may be true: long-lived individuals may exhibit declines in health relatively earlier in life, leading to a greater proportion of life spent in poor health (Figure 4C, right). In this scenario, due to an extended period of poor physiological function, longer-lived individuals would have an overall lower average quality of life than shorter-lived individuals.
Figure 4D shows that this latter hypothesis is most accurate, and that long-lived individuals experience a lower average quality of life compared to their short-lived counterparts. This is visible not only in the cohort averages of Figure 4D but in the clear negative relationship between each individual’s lifespan and the deviation from a neutral, straight-line decline from the population mean starting prognosis to the mean prognosis at death (Figure 4E; Pearson r2 = 0.207; p < 10−37, F-test; Spearman ρ2 = 0.183; p < 10−33, F-test). Longer-lived animals typically have negative deviations (i.e. they decline in health relatively early in life), while shorter-lived animals have more positive deviations and decline in health relatively late in life.
To control for shorter-lived individuals dying in healthier states, we repeated the analysis with each animal’s health set to 1 at the onset of reproductive maturity and to 0 at the time of death (Figure 4F and G). Even when adjusted for each individual animal’s starting and ending health, the association between long lifespan and negative deviation remains (Pearson r2 = 0.123; p < 10−21, F-test; Spearman ρ2 = 0.106; p < 10−18, F-test).
Taken together, these results demonstrate that longer-lived individuals have systematically worse qualitative physiological declines, despite the fact that longer-lived individuals typically have a better health prognosis on any chronological day of life (Figure 3D). The extended end-of-life period of low function in long-lived animals simply drags the overall average quality of life below that of short-lived animals.
Longer-Lived Individuals Have Disproportionately Extended Gerospans
The qualitatively worse senescent declines of long-lived individuals can be observed more starkly by partitioning each individual’s life into two segments: “healthspan”, the period of high physiological function, and “gerospan”, the period of low physiological function. Given a threshold prognosis score, we define healthspan as the period of time from the beginning of adulthood until an individual’s prognosis dips below that threshold for the first time. Gerospan is then the remainder of life thereafter (Figure 5A and B). In order to make a neutral comparison, we selected a threshold value that yields identical average healthspans and gerospans across the population: 5.0 days each. (Similar analysis with different thresholds yields essentially identical results to the below; see Figure S5A–P.) Figure 5A and C show that, as expected, longer-lived individuals enjoy longer healthspans in absolute chronological time. However, the differences in healthspans among long- and short-lived cohorts are small compared to the differences in gerospans.
Figure 5. Healthspan and gerospan analysis.

In both chronological (A) and relative (B) time, the trajectory of physiological aging can be thresholded into a span of high physiological function (“healthspan”; time spent above dotted line) and a span of low function (“gerospan”; time below dotted line). (C) In chronological time, longer-lived cohorts generally have longer period of good prognosis. However the differences in healthspan between these cohorts are small compared to the differences in gerospan. (D) In relative time, it is clear that longer-lived individuals are healthy for a smaller fraction of their total lifespan than shorter-lived individuals. (E) Data from a previous experiment using spe-9(hc88); fer-15(b26) individuals on standard C. elegans culture conditions (Stroustrup et al., 2013) confirm that individuals with longer lifespans spend a larger fraction of their life in poor physiological function, as measured by fraction of life spent moving very poorly or not at all (n = 55 in each group). (F) An equivalent analysis of movement data from our culture apparatus produces similar results (n = 146 in each group). Across our population, lifespan positively correlates with both (G) healthspan (as calculated in panel A), and (H) gerospan. Compared to healthspan, variability in gerospan explains almost twice as much of the variability in lifespan (r2 of 0.302 vs. 0.672). (I) This is because, despite having the same mean duration by construction, gerospan (red curve) is more variable across our study population than healthspan (green curve). The mean of both distributions is 5.0 days, with standard deviations of 1.3 and 1.9 days for healthspan and gerospan respectively.
In contrast, we observe that despite this long chronological healthspan, longer-lived individuals nevertheless experience a systematically larger fraction of their total lives in senescent gerospan (Figure 5B and D). This is analogous to the results of our analysis of the full trajectories of senescence, above: long-lived individuals enjoy a better prognosis at any point in absolute chronological time, but experience declines in health relatively early in their lives.
In order to validate this key result and ensure it is not an artifact of our culture system or analysis methods, we turned to data from the “Lifespan Machine”, which measures the movement individual C. elegans on standard culture plates in order to tally lifespans in an automated fashion (Stroustrup et al., 2013). The Lifespan Machine tracks individual animals once they are no longer able to move more than a few hundred microns in any direction; therefore this system inherently measures a “fast moving span” and a “slow moving” span for each individual. We manually validated these span annotations from an extant dataset with a similar genetic background and culture conditions, and computed the “slow moving span” (i.e. gerospan) as a fraction of total lifespan for each individual. As shown in Figure 5E, longer-lived individuals in these conditions experience a larger portion of life in senescent, slow-moving states. If we define the slow-moving and fast-moving spans similarly in our present dataset, we observe a very similar trend in (Figure 5F).
This analysis provides an intuitive understanding of why longer-lived individuals spend more of their lives in gerospan. Figure 5G and H plot the relationship between total lifespan and healthspan or gerospan, respectively. Longer-lived individuals are both likelier to have longer healthspans and longer gerospans. However, while inter-individual differences in healthspan account for about 30% of the total variability in lifespan, differences in gerospan account for about 67% of variability in lifespan. As shown in Figure 5I, though we selected a threshold that yields equal mean healthspan and gerospan, there is simply more inter-individual variability in gerospan than healthspan. Indeed, this relationship holds for several choices of threshold (Figure S5Q and R) and our full deviation analysis, which is not subject to any arbitrary threshold. In sum, variability in lifespan is in large part driven by differences in individual gerospans, and much less so by differences in healthspans. Taken together, this indicates that gerospan may be inherently more flexible than healthspan.
Discussion
In this work, we examined the substantial variation in lifespan and aging physiology that exists even in isogenic individuals reared in identical environments. We developed a culture method that, to the best of our knowledge, allows for the first time high-resolution imaging of a large number of individual C. elegans throughout life. This enabled us to analyze many different aspects of each individual animal’s physiology in longitudinal fashion, from hatching until death. Motivated by similar efforts to define and characterize a “biological age” (Borkan and Norris, 1980; Baker and Sprott, 1988) or “frailty score” (Fried et al., 2001; Hubbard, 2015) in humans, we aggregated these measurements into a prognostic estimate of days of life remaining. Using this prognosis, we were able to determine how the progress of senescence differs between longer- and shorter-lived individuals.
As one might expect for a genetically identical population reared in homogenous conditions, long-lived C. elegans do not begin adulthood with healthier physiology according to any of our measures. This is consistent with our previous work, which found that while physiological measurements made on the third and fourth day of adulthood can readily distinguish long- from short-lived individuals, physiological measures earlier in life cannot (Pincus et al., 2011). However, several fluorescent gene-expression reporters can be used to predict future lifespan even at the onset of adulthood: the level of the microRNA mir-71, which regulates insulin signaling (Pincus et al., 2011), and the expression, after a heat shock, of the heat-shock response protein hsp-16.2 (Rea et al., 2005). Thus, while long- and short-lived animals are not physiologically distinguishable at the start of adulthood, gene-regulatory and biochemical differences between individuals with different future fates are already established, and only later manifest themselves as phenotypic differences.
Indeed, we find that the population does not remain physiologically identical for long. Systematic differences between the longest- and shortest-lived individuals are detectable less than one day after reproductive maturity. Overall, shorter-lived animals age more rapidly throughout adulthood. That is, short-lived individuals are generally in worse physiological health than their long-lived counterparts at any particular chronological age. In addition, short-lived individuals typically die before experiencing the most advanced stages of senescence. However, senescence typically occurs relatively late in life in shorter-lived individuals, which thus remain healthy-appearing for a large fraction of their lives. In contrast, longer-lived animals undergo the full range of senescent decline, from good to ill health. These declines typically begin relatively earlier in life, leading long-lived animals to die after an extended twilight period of low physiological function (Figure 6). Moreover, we identified a previously uncharacterized subpopulation of individuals that demonstrate these trends in the extreme. Small in size, with very poor oocyte production, and qualitatively and quantitatively ill appearing, these individuals are, however, extremely long-lived.
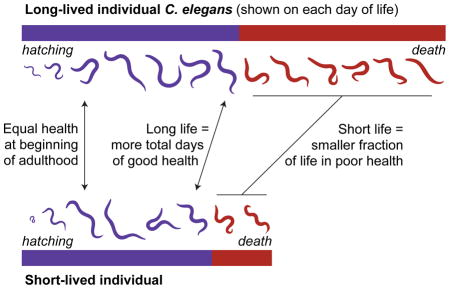
Figure 6. Summary of key findings.

We evaluated the process of senescence in long- vs. short-lived individual, based on a “prognosis” score that aggregates multiple measures of aging physiology. First, based on our physiological measurements, long- and short-lived individuals are indistinguishable at the beginning of adulthood. Second, soon after the onset of reproductive maturity, short- and long-lived individuals diverge rapidly. Overall, short-lived individuals experience faster physiological aging than long-lived individuals. In addition, short-lived individuals often die “prematurely”, while still healthy-appearing. Third, we discovered that long-lived individuals spend a disproportionate fraction of their lives in highly senescent, ill-appearing states. This extended “twilight period” of low physiological function has the paradoxical effect of reducing the overall average physiological health of long-lived individuals to below that of short-lived individuals.
While the mechanisms underlying this expansion in fractional gerospan in long-lived individuals are unclear, it is possible that they may result from diminished homeostatic capacity in older animals. One possibility is that phenotypically similar individuals entering gerospan may nevertheless have different degrees of homeostatic capacity (also known as “organ reserve” (Montgomery, 2000; Ghezzi and Ship, 2003) or “resilience” (McEwen, 2003; Stroustrup et al., 2016). Such latent, currently unobservable variability could allow some individuals to persist longer than others in highly senescent states. Alternately, a uniformly diminished homeostatic reserve across all individuals in gerospan might leave individuals susceptible to lethal stochastic insults (e.g. free-radical damage or protein translation errors) that would be survivable by a healthier individual. In this scenario, the variability in gerospan would be driven by the rate at which these insults occur. Therefore, determining the mechanistic underpinnings of these systematic trends in aging physiology is an important direction for future study.
Our results highlight how the physiological determinants of lifespan and of health need not completely overlap. As shown in Figure 3, some individuals die in outward good health, while others spend unexpectedly long in a twilight of ill health before death. And though we observed distinct phenotypes of late-life senescence – gonadal hypertrophy, large collections of clear fluid, “wrinkling” of the cuticle due to shrinkage, and distended intestines packed with bacteria (Figure S3H–K) – we did not observe significant differences in lifespan among individuals with these different phenotypes (Figure S3L and M). Overall, individuals exhibiting ostensibly similar phenotypic health can have very different lifespans, while at the same time individuals with seemingly very different senescent pathologies can have very similar lifespans.
These results provide additional context for recent work on physiologic determinants of lifespan in C. elegans (Stroustrup et al., 2016). Stroustrup and colleagues found that diverse interventions, including oxidative stress, changes in body temperature, and lifespan-extending mutations, do not change the overall shape of the population survival curve, but instead scale it uniformly in time. The data presented here show that the health declines of long- vs. short-lived individuals within a population do have qualitatively different shapes, however (Figure 4), and thus do not reflect a simple rescaling of time. Perhaps the decoupling of the health measures we observe from lifespan, and the similarity in lifespan of animals dying with different senescent pathologies, may be an important element in explaining how diverse interventions all produce similar effects on lifespan distributions.
Our data also offer a new perspective on recent studies of functional declines in health in long-lived mutants. Bansal et al. measured the population average of several tests of stress resistance and physiological function in wild-type and long-lived mutant C. elegans, defining “healthspan” for any particular test as the period of time with greater than 50% of the maximal wild-type functional capacity (Bansal et al., 2015). These investigators found that while some long-lived mutants had longer healthspans in absolute time on certain functional tests, the relative fraction of life spent in good health was diminished in many long-lived mutant strains. (A notable exception is the insulin-signaling deficient mutant daf-2; see also (Hahm et al., 2015).) This overall result has been taken by some to suggest that these long-lived mutants are not good models for wild-type aging, and that the observed extension of relative time spent in poor life may have been a pleiotropic effect of the lifespan-extending genetic mutations. However, we show here that this is not necessarily the case. Our study, which incorporates comprehensive, lifelong measurements and an integrated definition of overall health (both suggested to be critical factors for such an analysis (Melov, 2016)), shows similar results in a genetically identical, wild-type population. Specifically, we observe a continuum in which the fraction of lifespan spent in good health systematically diminishes from short- to long-lived individuals. The results of Bansal et al. can thus be seen as placing many longevity mutants along this same continuum. As such, a relative expansion in gerospan may not be a “bug” specific to certain long-lived mutants, but rather a general property of the aging process itself.
Together, these results demonstrate that extended lifespan, whether induced by stochastic events (in the case of inter-individual variability) or mutations (in the case of inter-strain differences), is often due to a disproportionate extension of a highly senescent “twilight period” of low physiological function. Put simply, it appears that an individual’s gerospan is inherently more plastic than its healthspan.
Determining whether these results hold in more complex organisms is an important task. First, it is certainly true that in humans and other mammals, longer-lived individuals typically enjoy more total days of healthy life. Likewise, it is well established that individuals with higher physiological function and better physical fitness generally live longer. In particular, several remarkable studies in humans have shown that heritable factors that favor exceptional longevity also increase healthspan (Sebastiani et al., 2013; Ash et al., 2015). Further, longevity is more generally associated with a longer chronological span of healthy life, both within a relatively homogeneous Ashkenazi Jewish population (Ismail et al., 2016), and among the ethnically diverse general Chinese population (Gu et al., 2009). Our results in C. elegans are identical: longer-lived C. elegans enjoy longer absolute healthspans (Figure 4C), and better health at any point in time is correlated with extended future lifespan (Figure 4A).
It is an open question, however, whether longer-lived individuals within mammalian populations spend a smaller fraction of their lives in good health, as we observe in C. elegans (Figure 4D). As above, several studies in humans have demonstrated in different contexts that extended lifespan is associated with extended chronological healthspan. Nevertheless, it remains a matter of some debate whether longer life brings with it a proportionate extension in healthspan (Rechel et al., 2013; Ash et al., 2015). As most of the current studies do not include data on ultimate lifespan, either due to cross-sectional study design or ongoing follow-up in a longitudinal study, these analyses cannot yet shed light on the proportion of life spent in good health in short- vs. long-lived individuals. Some recent work has been able to address this question by asking whether modern advances in medicine have been more successful in extending disability-free life (healthspan) or activity-limited life (gerospan). There is evidence that, especially for females, medical advances have prolonged longevity primarily by expanding the late-life period of morbidity, without much effect on the span of disability-free life (Freedman et al., 2016). Fundamentally, however, whether it is worthwhile to extend lifespan in this fashion is a value judgment that may vary between individuals, and is thus more in the realm of clinical decision analysis (Kassirer, 1976; Weinstein and Stason, 1977; Lee et al., 2009) than experimental biology. (The simple analysis in Figure S5S–U shows how the desirability of such extensions can depend on the threshold for acceptable quality of life.)
It is, however, an experimental question whether there are conditions, interventions, or mutations that can extend fractional healthspan as easily as fractional gerospan. In mammals, exercise (Garcia-Valles et al., 2013) and caloric restriction (Mattison et al., 2012) may extend the ratio of healthspan to gerospan. In C. elegans, the data from Bansal et al. and Hahm et al. both show that the long-lived daf-2 mutant enjoys a proportionate extension of both healthspan and gerospan in relevant physiological assays. Thus the daf-2 mutant likely departs from the relationship between long life and extended fractional gerospan that we have characterized. Our longitudinal approach now allows for a more detailed understanding of how health integrates across physiological systems and evolves over time in different genetic backgrounds, filling a previously unmet experimental need (Melov, 2016). Future studies with these approaches promise to unravel the complex relationship between the plasticity of different phases of senescence and lifespan extension in general.
Methods and Resources
Contact for Reagent and Resource Sharing
Zachary Pincus is the Lead Contact and may be contacted at 660 South Euclid Avenue; Department of Genetics, CB 8232; St. Louis, MO 63110-1031 and at zpincus@wustl.edu.
Experimental Model and Subject Details
Strains
The C. elegans strain spe-9(hc88), a temperature-sensitive fertilization-defective mutant, was provided by the Caenorhabditis Genetics Center (CGC). The strain was maintained at 15°C and assays were conducted at a restrictive temperature of 25°C. spe-9(hc88) strains are widely used as an alternative to 5-fluoro-2′-deoxyuridine (FUDR) sterilization, and have been validated to have wild-type lifespans at the restrictive temperature of 25.5°C (Fabian and Johnson, 1994) and wild-type brood sizes at the permissive temperatures of 16°C and 20 °C (Singson et al., 1998). We used spe-9(hc88) to avoid the known confounding effects of FUDR (Anderson et al., 2016) and to eliminate issues due to the timing of administration (such as being administered at different phases of life for fast- and slow-developing individuals on the same slide).
Method Details
Single-Animal Vermiculture
Standard 25 mm × 75 mm (1.2 mm thick) glass microscopy slides (obtained from VWR International, LLC; Radnor, PA, USA) were used as the base support for our culture device. Before use, the glass slides were bonded to custom-machined aluminum frames (outer dimensions 25 mm × 75 mm; inner dimensions 20 mm × 70 mm; thickness 2.36 mm) using 120 μL of polydimethylsiloxane (PDMS; Sylgard 184 Silicone Elastomer Kit obtained from Dow Corning Corporation; Midland, MI, USA). The PDMS was then cured in an oven at 100°C f or 3 hours. The device was then cleaned with distilled water and ethanol, sealed in aluminum foil, and dry heat sterilized at 160°C for 2 hours.
Next, a modified version of standard nematode growth media (NGM) (Brenner, 1974) was made by mixing 97.5 mL of distilled water with 0.3 g of sodium chloride, 0.25 g of peptone, 0.1 mL of 1M magnesium sulfate, and 2.5 mL of 1M potassium phosphate buffer (pH 6.3, titrated with sodium hydroxide and hydrochloric acid). We omit the calcium chloride used in standard NGM, and modify the pH of the potassium phosphate buffer from 6.0 to 6.3 to allow for polymerization of the polyethylene glycol (PEG) gel. Instead of autoclaving, which can darken sugar-containing solutions, we filter-sterilized the modified NGM to maximize optical clarity.
Then, 8 μL/mL of cholesterol stock (5 mg/mL in 95% ethanol) was added to the NGM, which was then used to separately dissolve an 8-armed PEG-thiol (Jenkem Technology; Beijing, P. R. China; Item Number: 8ARM(TP)-SH-10K) and PEG-diacrylate (Sigma-Aldrich; St. Louis, MO, USA; Catalog Number: 455008 Aldrich) at 140 mg/mL and 40 mg/mL, respectively. The NGM-PEG-thiol and NGM-PEG-diacrylate solutions were then mixed in a 1:1 ratio and vortexed vigorously. 1.7 mL of the mixture was then added to the center of the aluminum frame on the culture device. The device was tilted to break the surface tension of the PEG mixture and to achieve an even layer of fluid. The device was then placed in a standard 100 mm × 15 mm petri dish. A delicate task wipe was cut in half and added to the petri dish, and 700 μL of distilled water was pippetted onto each half wipe in order to maintain the humidity of the petri dish and prevent excessive evaporation of water from the PEG gel. Finally, an additional 25 mm × 75 mm glass slide was sterilized with ethanol, dried, and placed on top of the aluminum frame to further isolate the gel during polymerization. The petri dish containing the device is then left at room temperature for 90 minutes, during which the 8-armed PEG-thiol crosslinks to the PEG-diacrylate via Michael addition.
Next, an array of 0.2 μL droplets of an OP50 E. coli (50% by mass) food source was deposited onto the gel. Single, individual pretzel-stage eggs were picked into each droplet using an eyelash pick. Approximately 100 eggs can be picked onto each slide in 20 rows of 5 eggs each. After the E. coli droplets were dried, 1.2 mL of PDMS was deposited over the PEG gel using a syringe. The PDMS polymerizes overnight at 25°C. During polymerizatio n, each individual is trapped on its food pad by hydrosilylation chemistry between unreacted moieties in the PDMS cure agent and unreacted acrylate groups in the PEG-diacrylate. This reaction results in a covalent bond between the PDMS and the PEG gel, formed at all locations where the gel is in direct contact with the PDMS (i.e. everywhere except the bacterial food pads). Immediately after deposition of the PDMS, the glass slide was placed on the stage of our computer-controlled microscope, and automated image acquisition was initiated.
Image Acquisition
All images were acquired at 5× magnification using custom-built hardware and software. The microscope itself was housed in a climate-controlled enclosure to provide consistent temperature and humidity for the animals studied. A thermoelectric cooler with continuous temperature monitoring (Torrey Pines Scientific, La Jolla, CA) was used to maintain the temperature of the enclosure at 25.0±0.1°C. Humidity was maintained at 85±10% relative humidity by including a tub of distilled water in the enclosure and using two aquarium air diffusion stones along with an air pump to aerate the water. Consistent air circulation was achieved with the use of several 80 mm DC fans attached to the thermoelectric cooler and the walls of the enclosure.
Custom in-house control software was developed and used to move to and automatically focus (Firestone et al., 1991; Brenner et al., 1976) on each animal every three hours. At each time point, a series of six brightfield and one fluorescence image was acquired, taking approximately 17 seconds per animal. The fluorescence image and one bright-field image were taken first, taking less than 60 ms combined time to acquire. The fluorescence image taken with a 50 ms exposure using a TRITC filter (Semrock part DA/FI/TR-3X-A-000), with light from a Lumencor Spectra X. The center wavelengths of the excitation and emission bands were 556 nm and 613 nm, respectively. Next, a series of 5 bright-field images to assess short-term movement were taken over 4.5 seconds, with 0.5 seconds between the first and second images, 1.0 seconds between the second and third images, during which time the animals were stimulated with a 0.5 second pulse of cyan light (Edwards et al., 2008), 1.5 seconds between the third and fourth images, and 1.5 seconds between the fourth and fifth images. For the first 10 timepoints, the 0.5 second pulse of cyan light and the fluorescence image were omitted to avoid excessive stimulation of the animals during early larval development.
The microscope was automatically re-calibrated at every three-hour timepoint for spatial and temporal variation in light-source intensity for both the bright-field lamp and the fluorescence light source. In addition, images were corrected for variation in sensitivity of the camera image sensor. Finally, bright-field exposure times and lamp intensities were adjusted at every time point to optimize the dynamic range of the acquired images. Overall, all images were corrected for background camera noise (dark current), spatial illumination inhomogeneity (flat field) and temporal variation in illumination. After correction, image intensity values were divided by the exposure time to render all images comparable.
Image Segmentation
The acquired image series were then manually annotated for time of hatching, reproductive maturity as indicated by first oocyte laid, and death as indicated by total cessation of coordinated movement. Eight developmentally defective animals that never reached reproductive maturity were censored from our analysis, while 734 were included in the final analysis. All animals were observed for an additional 30 hours post-mortem to confirm death.
A suite of custom image analysis software was written to automatically identify the location of the animal in the over 400,000 bright-field images. First, the rough location of the animal was determined using background subtraction (Piccardi, 2004), which takes advantage of the fact that the animal moves around in the image, while other objects such as the bacterial lawn are stationary. The current image was combined with the previous nine images taken for the same individual by computing a pixel-wise median, which produces a model of the background. This background image was then subtracted from the current image, and thresholded for only pixels above the 97.5th percentile of brightness. The largest contiguous object in the thresholded image was then identified as the animal, and all internal holes in the object were filled. This location was then masked out of future background contexts to improve the robustness of the background model. Finally, the algorithm was run backwards in time to identify the position of the animal during the first nine time points.
Next, the location of the individual was refined using the Canny edge detector (Canny, 1986). While the background subtraction segmentation is sensitive to changes in the bacterial lawn surrounding the animal due to illumination changes or physical churning by the animal’s movement, edge-detection defines sharper borders based on local spatial intensity gradients. The largest object in the field of view (excluding the edge of illumination from vignetting and the border of the bacterial lawn itself) was identified as the worm, and all internal holes in the object were filled. However, edge detection can occasionally locate the wrong object due to a large pattern of churned bacteria or the introduction of a piece of dust or air bubble into the field of view. Therefore, the background subtraction-derived location was used as a fallback for cases in which the location of the animal as defined by edge detection was more than 50 pixels from the location as identified by the more reliable background subtraction.
Finally, a support vector classifier (SVC) (Cortes and Vapnik, 1995) with a radial basis function kernel (γ = 4.88 × 10⁻⁴, ν = 8.99 × 10⁻⁴) was trained on the intensities from 10,000 5 × 5 pixel patches from 1,617 manually drawn outlines of worms to distinguish between the animals and their surrounding bacteria. This classifier was then applied to patches centered on each individual pixel within the animal’s location as computed by the previous two methods. Using the SVC allowed us to improve our image segmentation significantly in cases in which the animal was in a curled posture and looped back on itself. While the simple hole-filling would naïvely identify patches of bacteria surround by the animal as part of the animal itself, the SVC is generally able to distinguish between the two. Overall, the automated segmentation agreed strongly with manual segmentation, with Pearson correlation coefficients between automated size and manual size of r2 = 0.81 and between automated position and manual position of r2 > 0.95 (Figure S1K–O).
Physiological Panel Design
Several “biomarkers of aging” (Baker and Sprott, 1988; Pincus and Slack, 2010) – properties that can predict an individual’s future lifespan better than age alone – have previously been identified in C. elegans. As each biomarker represents an aspect of physiology that differs between long- and short-lived individuals at some point in life, we selected a number of these markers to follow longitudinally across our population. First, we examined C. elegans neuromuscular function, as measured by locomotory ability. Previous work has shown that locomotion in age-matched animals diminishes over time, correlates with remaining lifespan (Hosono et al., 1980; Herndon et al., 2002; Huang et al., 2004; Hsu et al., 2009; Hulme et al., 2010; Pincus et al., 2011) and with the degree of sarcopenia (Herndon et al., 2002). Second, we assay the accumulation of non-hydrolyzable autofluorescent material in intestinal endosomes (Klass, 1977; Clokey and Jacobson, 1986; Gerstbrein et al., 2005; Hermann et al., 2005; Pincus et al., 2016). This is a marker for declining macromolecular homeostatic capacity over time, as individuals fail to clear the fluorescent material at a pace that balances its production. We chose to follow red-wavelength autofluorescence, which is most predictive of future lifespan (Pincus et al., 2016), instead of blue or green autofluorescence, which largely report only incipient death (Coburn et al., 2013; Pincus et al., 2016). Third, we also measure declining tissue organization through quantitative measurements of textural order and disorder in brightfield images, which has been shown to correlate with lifespan (Herndon et al., 2002; Johnston et al., 2008; Shamir et al., 2009; Pincus et al., 2011). Fourth, C. elegans reproductive output has also been identified as a biomarker of aging and has been shown to decrease with age (Pickett et al., 2013). While Huang et al. found no correlation between reproduction and lifespan was found in unmated, and hence sperm-limited, hermaphrodite C. elegans (Huang et al., 2004), we here examine the temperature-sensitive sterile strain spe-9, which lays unfertilized oocytes, and may thus not be sperm-limited in the same way. Finally, we and others have shown that overall body size, and rate growth and/or shrinkage correlate with future lifespan (Pincus et al., 2011; Hulme et al., 2010). Taken together, this panel comprises a diverse set of individual measurements, allowing us to characterize longitudinal changes in distinct aspects of aging physiology (Figure 1C–E).
Image Measurements
Autofluorescence measurements (in red wavelengths; excitation 556 nm, emission 613 nm (Pincus et al., 2016)) were made using pixel values within the defined animal location from automated image segmentation of the paired bright field image. Intensity values were extracted and summary statistics such as 80th percentile of intensity and integrated total body fluorescence were computed. Using a percentile score provides robustness against brightly autofluorescent clumps of debris or oocytes overlapping the individual (see Figures S6A for example illustrative images).
Four measures of motion were made at each time point. Long-term movement over a three-hour time scale was assessed by measuring the displacement between the centroid of the animal’s current position and that of its previous position. Unstimulated movement and stimulated movement immediately before and after blue-light stimulus were assessed by measuring distances between centroids of animal positions from the sequence of five bright-field images (see Figures S6B for example illustrative images).
An estimate of the number of oocytes laid was used as a proxy for reproductive investment. This measure was made by measuring the total area of objects detected within the bacterial lawn, excluding the animal itself and thresholding by size to remove small debris. This total area was then divided by the area of an average oocyte to obtain an estimate of the total number laid (see Figure S6C for example illustrative images).
Cross-sectional size of the animal was measured by simply counting the number of pixels within the segmented animal region. The raw measured size was adjusted for a slight systematic bias towards overestimating the animal’s size by a linear regression between automatically measured size and size from 1,617 human-drawn outlines of the animal (see Figure S6D for example illustrative images).
Finally, a quantitative measure of tissue degeneration similar to the score used in (Pincus et al., 2011) was made by analyzing pixel patches within animals’ outlines. First, representative texture patches (“textons”) for different stages of decrepitude were obtained by grouping images by the number of days remaining in the animal’s life at that point in time (bins of 0–3, 3–6, 6–9, etc. days left to live), sampling 200,000 17 × 17 pixel patches from images in each bin, and using k-means classification to obtain 60 representative patches for bin (300 total). Then, the texture pattern of an image was defined as the 300-element histogram containing the count of closest- matching 17 × 17 pixel patches for each texton, normalized by the total number of patches in that image. These histograms were then used to train a support vector regression procedure to produce a tissue degeneration score in terms of predicted days of remaining life (see Figure S6E for example illustrative images).
Quantification and Statistical Analysis
Smoothing
Individual animals’ time traces for each measurement were smoothed using 3 iterations of the one-dimensional Savitzsky–Golay filter (Savitzky and Golay, 1964) with a 1-degree polynomial and a window length of 9. Smoothing parameters were optimized for signal-to-noise ratio by checking the physiological measurements’ cross-validated partial Pearson r2 with remaining lifespan, controlled for age.
Pearson Correlations
p-values for Pearson correlations were computed using an F-test for linear regression. The F-statistic was computed in the usual way as F = r2(df)/(1 − r2), where df = n − 2, n is the sample size, and r is the Pearson coefficient of correlation. The test was performed under the assumption of normality, so for computational efficiency an appropriately renormalized chi-squared distribution was used as an approximation for the exact Fisher–Snedecor distribution.
Non-parametric Spearman Correlations
To validate our results without the assumption of normality made in computing Pearson correlations and their associated p-values, we also performed non-parametric Spearman correlations on the ranks of the data for each statistical test. These were performed identically to the Pearson correlation p-values.
Overfitting and Multiple Hypothesis Testing
To guard against overfitting, we analyzed the cross-validated Pearson r2 for defining our prognosis measurement, finding that it was not substantially lower than the non-cross-validated version.
All p-values are significant even after applying the conservative Bonferroni correction for the 6 hypothesis tests conducted.
Alternate Health Regression Approaches
To ensure that our results were not artifacts of our particular methodology for computing a prognosis and measuring health, we examined several alternate approaches, none of which altered our key findings. Table S4 demonstrates our key results are visible from each of the individual aspects of aging physiology we measured, without combining them to form the prognosis score. Figure S4I–P shows that these results also hold when using linear regression to create the prognosis, which also allows the relative contributions of each raw measurement used to be compared (Table S5). This indicates that no specific measurement, nor the regression methodology, drives the central findings of this study.
Next, we used multivariate support vector regression to create alternates to our “prognosis” score. By regressing against age rather than remaining lifespan we created a “youthfulness” or “biological age” score (Borkan and Norris, 1980; Baker and Sprott, 1988). Similarly, regressing against predicted three-day survival created a “frailty” score (Fried et al., 2001; Hubbard, 2015) (Figure S4Y, inset). Both frailty and youthfulness scores produced similar findings to our approach above (Figure S4Q–X and Y–FF).
Data and Software Availability
All physiological data used in this study is included with this manuscript in Supplemental_Data.zip, which is related to Figures 1–6.
The image acquisition software is freely available at https://github.com/zplab/rpc-scope, and the image processing and statistical analysis software is freely available at https://github.com/zplab/wormPhysiology.
Additional Resources
Additional galleries of randomly selected images are available on Mendeley Data at DOI: 10.17632/9xdthhmm75.1.
Supplementary Material
Highlights.
Fully automated C. elegans culture allows for study of inter-individual variation.
Short and long-lived individuals start adulthood in equal physiological health.
Short-lived individuals age more quickly but have a better average quality of life.
The span of poor health is more variable among individuals than that of good health.
Acknowledgments
We would like to thank Shin-ichiro Imai, Heidi Tissenbaum, Brian Kim, Amy Xu, and Seth Pincus for helpful discussions and thoughtful feedback. ZP began this work in the lab of Frank J. Slack, supported by NIH R01 AG033921. WZ, DS, WP, EH and ZP are supported by NIH R00 AG042487. WZ and ZP are supported by Longer Life Foundation grant 2015-008. WZ is additionally supported by NIH T32 GM07200. NS is supported by a Glenn Award from the Glenn Foundation for Medical Research. Some strains were provided by the CGC, which is funded by the NIH Office of Research Infrastructure Programs (P40 OD010440).
Footnotes
Author Contributions
WZ and ZP designed the experiments. WZ designed and implemented the image segmentation and analysis software and analyzed the data. WZ, DS, and WP conducted the experiments. WP, WZ, DS, and ZP developed the single-worm culture system. ZP designed and built the custom microscope control and incubation hardware, and ZP and EH wrote the custom microscope control software. NS provided data and analysis for validation of key results in standard culture conditions. WZ and ZP wrote the manuscript with feedback from DS and NS.
Publisher's Disclaimer: This is a PDF file of an unedited manuscript that has been accepted for publication. As a service to our customers we are providing this early version of the manuscript. The manuscript will undergo copyediting, typesetting, and review of the resulting proof before it is published in its final citable form. Please note that during the production process errors may be discovered which could affect the content, and all legal disclaimers that apply to the journal pertain.
References
- Anderson EN, Corkins ME, Li JC, Singh K, Parsons S, Tucey TM, Sorkaç A, Huang H, Dimitriadi M, Sinclair DA, et al. C. elegans lifespan extension by osmotic stress requires FUDR, base excision repair, foxo, and sirtuins. Mechanisms of ageing and development. 2016;154:30–42. doi: 10.1016/j.mad.2016.01.004. [DOI] [PMC free article] [PubMed] [Google Scholar]
- Ash AS, Kroll-Desrosiers AR, Hoaglin DC, Christensen K, Fang H, Perls TT. Are members of long-lived families healthier than their equally long-lived peers? Evidence from the long life family study. The Journals of Gerontology Series A: Biological Sciences and Medical Sciences. 2015;70:971–976. doi: 10.1093/gerona/glv015. [DOI] [PMC free article] [PubMed] [Google Scholar]
- Baker GT, Sprott RL. Biomarkers of aging. Experimental gerontology. 1988;23:223–239. doi: 10.1016/0531-5565(88)90025-3. [DOI] [PubMed] [Google Scholar]
- Bansal A, Zhu LJ, Yen K, Tissenbaum HA. Uncoupling lifespan and healthspan in Caenorhabditis elegans longevity mutants. Proceedings of the National Academy of Sciences. 2015;112:E277–E286. doi: 10.1073/pnas.1412192112. [DOI] [PMC free article] [PubMed] [Google Scholar]
- Borkan GA, Norris AH. Assessment of biological age using a profile of physical parameters. Journal of Gerontology. 1980;35:177–184. doi: 10.1093/geronj/35.2.177. [DOI] [PubMed] [Google Scholar]
- Brenner JF, Dew BS, Horton JB, King T, Neurath PW, Selles WD. An automated microscope for cytologic research a preliminary evaluation. Journal of Histochemistry & Cytochemistry. 1976;24:100–111. doi: 10.1177/24.1.1254907. [DOI] [PubMed] [Google Scholar]
- Brenner S. The genetics of Caenorhabditis elegans. Genetics. 1974;77:71–94. doi: 10.1093/genetics/77.1.71. [DOI] [PMC free article] [PubMed] [Google Scholar]
- Byerly L, Cassada R, Russell R. The life cycle of the nematode Caenorhabditis elegans: I. wild-type growth and reproduction. Developmental biology. 1976;51:23–33. doi: 10.1016/0012-1606(76)90119-6. [DOI] [PubMed] [Google Scholar]
- Canny J. A computational approach to edge detection. Pattern Analysis and Machine Intelligence, IEEE Transactions on. 1986:679–698. [PubMed] [Google Scholar]
- Chow DK, Glenn CF, Johnston JL, Goldberg IG, Wolkow CA. Sarcopenia in the Caenorhabditis elegans pharynx correlates with muscle contraction rate over lifespan. Experimental gerontology. 2006;41:252–260. doi: 10.1016/j.exger.2005.12.004. [DOI] [PMC free article] [PubMed] [Google Scholar]
- Christensen K, Johnson TE, Vaupel JW. The quest for genetic determinants of human longevity: challenges and insights. Nature Reviews Genetics. 2006;7:436–448. doi: 10.1038/nrg1871. [DOI] [PMC free article] [PubMed] [Google Scholar]
- Clokey GV, Jacobson LA. The autofluorescent “lipofuscin granules” in the intestinal cells of Caenorhabditis elegans are secondary lysosomes. Mechanisms of ageing and development. 1986;35:79–94. doi: 10.1016/0047-6374(86)90068-0. [DOI] [PubMed] [Google Scholar]
- Coburn C, Allman E, Mahanti P, Benedetto A, Cabreiro F, Pincus Z, Matthijssens F, Araiz C, Mandel A, Vlachos M, et al. Anthranilate fluorescence marks a calcium-propagated necrotic wave that promotes organismal death in C. elegans. PLoS Biol. 2013;11:e1001613. doi: 10.1371/journal.pbio.1001613. [DOI] [PMC free article] [PubMed] [Google Scholar]
- Cortes C, Vapnik V. Support-vector networks. Machine learning. 1995;20:273–297. [Google Scholar]
- Eckley DM, Rahimi S, Mantilla S, Orlov NV, Coletta CE, Wilson MA, Iser WB, Delaney JD, Zhang Y, Wood W, III, et al. Molecular characterization of the transition to mid-life in Caenorhabditis elegans. Age. 2013;35:689–703. doi: 10.1007/s11357-012-9401-2. [DOI] [PMC free article] [PubMed] [Google Scholar]
- Edwards SL, Charlie NK, Milfort MC, Brown BS, Gravlin CN, Knecht JE, Miller KG. A novel molecular solution for ultraviolet light detection in Caenorhabditis elegans. PLoS Biol. 2008;6:e198. doi: 10.1371/journal.pbio.0060198. [DOI] [PMC free article] [PubMed] [Google Scholar]
- Fabian TJ, Johnson TE. Production of age-synchronous mass cultures of Caenorhabditis elegans. Journal of gerontology. 1994;49:B145–B156. doi: 10.1093/geronj/49.4.b145. [DOI] [PubMed] [Google Scholar]
- Firestone L, Cook K, Culp K, Talsania N, Preston K. Comparison of autofocus methods for automated microscopy. Cytometry. 1991;12:195–206. doi: 10.1002/cyto.990120302. [DOI] [PubMed] [Google Scholar]
- Freedman VA, Wolf DA, Spillman BC. Disability-free life expectancy over 30 years: A growing female disadvantage in the us population. American Journal of Public Health. 2016:e1–e7. doi: 10.2105/AJPH.2016.303089. [DOI] [PMC free article] [PubMed] [Google Scholar]
- Fried LP, Tangen CM, Walston J, Newman AB, Hirsch C, Gottdiener J, Seeman T, Tracy R, Kop WJ, Burke G, et al. Frailty in older adults evidence for a phenotype. The Journals of Gerontology Series A: Biological Sciences and Medical Sciences. 2001;56:M146–M157. doi: 10.1093/gerona/56.3.m146. [DOI] [PubMed] [Google Scholar]
- Fries JF. Aging, natural death, and the compression of morbidity. New England journal of medicine. 1980;303:130–135. doi: 10.1056/NEJM198007173030304. [DOI] [PubMed] [Google Scholar]
- Garcia-Valles R, Gomez-Cabrera MC, Rodriguez-Mañas L, Garcia-Garcia FJ, Diaz A, Noguera I, Olaso-Gonzalez G, Viña J. Life-long spontaneous exercise does not prolong lifespan but improves health span in mice. Longevity & healthspan. 2013;2:1. doi: 10.1186/2046-2395-2-14. [DOI] [PMC free article] [PubMed] [Google Scholar]
- Gerstbrein B, Stamatas G, Kollias N, Driscoll M. In vivo spectrofluorimetry reveals endogenous biomarkers that report healthspan and dietary restriction in Caenorhabditis elegans. Aging cell. 2005;4:127–137. doi: 10.1111/j.1474-9726.2005.00153.x. [DOI] [PubMed] [Google Scholar]
- Ghezzi E, Ship J. Aging and secretory reserve capacity of major salivary glands. Journal of dental research. 2003;82:844–848. doi: 10.1177/154405910308201016. [DOI] [PubMed] [Google Scholar]
- Gill MS, Olsen A, Sampayo JN, Lithgow GJ. An automated high-throughput assay for survival of the nematode Caenorhabditis elegans. Free Radical Biology and Medicine. 2003;35:558–565. doi: 10.1016/s0891-5849(03)00328-9. [DOI] [PubMed] [Google Scholar]
- Glenn CF, Chow DK, David L, Cooke CA, Gami MS, Iser WB, Hanselman KB, Goldberg IG, Wolkow CA. Behavioral deficits during early stages of aging in Caenorhabditis elegans result from locomotory deficits possibly linked to muscle frailty. The Journals of Gerontology Series A: Biological Sciences and Medical Sciences. 2004;59:1251–1260. doi: 10.1093/gerona/59.12.1251. [DOI] [PMC free article] [PubMed] [Google Scholar]
- Gögele M, Pattaro C, Fuchsberger C, Minelli C, Pramstaller PP, Wjst M. Heritability analysis of life span in a semi-isolated population followed across four centuries reveals the presence of pleiotropy between life span and reproduction. The Journals of Gerontology Series A: Biological Sciences and Medical Sciences. 2011;66:26–37. doi: 10.1093/gerona/glq163. [DOI] [PubMed] [Google Scholar]
- Golden TR, Hubbard A, Dando C, Herren MA, Melov S. Age-related behaviors have distinct transcriptional profiles in Caenorhabditis elegans. Aging cell. 2008;7:850–865. doi: 10.1111/j.1474-9726.2008.00433.x. [DOI] [PMC free article] [PubMed] [Google Scholar]
- Gu D, Dupre ME, Sautter J, Zhu H, Liu Y, Yi Z. Frailty and mortality among Chinese at advanced ages. The Journals of Gerontology Series B: Psychological Sciences and Social Sciences. 2009:gbn009. doi: 10.1093/geronb/gbn009. [DOI] [PMC free article] [PubMed] [Google Scholar]
- Guarente L, Kenyon C. Genetic pathways that regulate ageing in model organisms. Nature. 2000;408:255–262. doi: 10.1038/35041700. [DOI] [PubMed] [Google Scholar]
- Hahm JH, Kim S, DiLoreto R, Shi C, Lee SJV, Murphy CT, Nam HG. C. elegans maximum velocity correlates with healthspan and is maintained in worms with an insulin receptor mutation. Nature communications. 2015:6. doi: 10.1038/ncomms9919. [DOI] [PMC free article] [PubMed] [Google Scholar]
- Hermann GJ, Schroeder LK, Hieb CA, Kershner AM, Rabbitts BM, Fonarev P, Grant BD, Priess JR. Genetic analysis of lysosomal trafficking in caenorhabditis elegans. Molecular biology of the cell. 2005;16:3273–3288. doi: 10.1091/mbc.E05-01-0060. [DOI] [PMC free article] [PubMed] [Google Scholar]
- Herndon LA, Schmeissner PJ, Dudaronek JM, Brown PA, Listner KM, Sakano Y, Paupard MC, Hall DH, Driscoll M. Stochastic and genetic factors influence tissue-specific decline in ageing C. elegans. Nature. 2002;419:808–814. doi: 10.1038/nature01135. [DOI] [PubMed] [Google Scholar]
- Herskind AM, McGue M, Holm NV, Sörensen TI, Harvald B, Vaupel JW. The heritability of human longevity: a population-based study of 2872 danish twin pairs born 1870–1900. Human genetics. 1996;97:319–323. doi: 10.1007/BF02185763. [DOI] [PubMed] [Google Scholar]
- Hertweck M, Baumeister R. Automated assays to study longevity in C. elegans. Mechanisms of ageing and development. 2005;126:139–145. doi: 10.1016/j.mad.2004.09.010. [DOI] [PubMed] [Google Scholar]
- Hosono R, Sato Y, Aizawa SI, Mitsui Y. Age-dependent changes in mobility and separation of the nematode Caenorhabditis elegans. Experimental gerontology. 1980;15:285–289. doi: 10.1016/0531-5565(80)90032-7. [DOI] [PubMed] [Google Scholar]
- Hsu AL, Feng Z, Hsieh MY, Xu XS. Identification by machine vision of the rate of motor activity decline as a lifespan predictor in C. elegans. Neurobiology of aging. 2009;30:1498–1503. doi: 10.1016/j.neurobiolaging.2007.12.007. [DOI] [PMC free article] [PubMed] [Google Scholar]
- Huang C, Xiong C, Kornfeld K. Measurements of age-related changes of physiological processes that predict lifespan of Caenorhabditis elegans. Proceedings of the National Academy of Sciences of the United States of America. 2004;101:8084–8089. doi: 10.1073/pnas.0400848101. [DOI] [PMC free article] [PubMed] [Google Scholar]
- Hubbard RE. Frailty in Aging. Vol. 41. Karger Publishers; 2015. Sex differences in frailty; pp. 41–53. [DOI] [PubMed] [Google Scholar]
- Hulme SE, Shevkoplyas SS, McGuigan AP, Apfeld J, Fontana W, Whitesides GM. Lifespan-on-a-chip: microfluidic chambers for performing lifelong observation of c. elegans. Lab on a Chip. 2010;10:589–597. doi: 10.1039/b919265d. [DOI] [PMC free article] [PubMed] [Google Scholar]
- Ismail K, Nussbaum L, Sebastiani P, Andersen S, Perls T, Barzilai N, Milman S. Compression of morbidity is observed across cohorts with exceptional longevity. Journal of the American Geriatrics Society. 2016 doi: 10.1111/jgs.14222. [DOI] [PMC free article] [PubMed] [Google Scholar]
- Johnston J, Iser WB, Chow DK, Goldberg IG, Wolkow CA. Quantitative image analysis reveals distinct structural transitions during aging in Caenorhabditis elegans tissues. PLoS One. 2008;3:e2821. doi: 10.1371/journal.pone.0002821. [DOI] [PMC free article] [PubMed] [Google Scholar]
- Kassirer JP. The principles of clinical decision making: an introduction to decision analysis. The Yale journal of biology and medicine. 1976;49:149. [PMC free article] [PubMed] [Google Scholar]
- Kenyon C. The plasticity of aging: insights from long-lived mutants. Cell. 2005;120:449–460. doi: 10.1016/j.cell.2005.02.002. [DOI] [PubMed] [Google Scholar]
- Kenyon CJ. The genetics of ageing. Nature. 2010;464:504–512. doi: 10.1038/nature08980. [DOI] [PubMed] [Google Scholar]
- Kirkwood TB, Feder M, Finch CE, Franceschi C, Globerson A, Klingenberg CP, LaMarco K, Omholt S, Westendorp RG. What accounts for the wide variation in life span of genetically identical organisms reared in a constant environment? Mechanisms of ageing and development. 2005;126:439–443. doi: 10.1016/j.mad.2004.09.008. [DOI] [PubMed] [Google Scholar]
- Klass MR. Aging in the nematode Caenorhabditis elegans: major biological and environmental factors influencing life span. Mechanisms of ageing and development. 1977;6:413–429. doi: 10.1016/0047-6374(77)90043-4. [DOI] [PubMed] [Google Scholar]
- Lee A, Joynt GM, Ho AM, Keitz S, McGinn T, Wyer PC, Group ETSW, et al. Tips for teachers of evidence-based medicine: making sense of decision analysis using a decision tree. Journal of general internal medicine. 2009;24:642–648. doi: 10.1007/s11606-009-0918-8. [DOI] [PMC free article] [PubMed] [Google Scholar]
- Mattison JA, Roth GS, Beasley TM, Tilmont EM, Handy AM, Herbert RL, Longo DL, Allison DB, Young JE, Bryant M, et al. Impact of caloric restriction on health and survival in rhesus monkeys from the NIA study. Nature. 2012;489:318–321. doi: 10.1038/nature11432. [DOI] [PMC free article] [PubMed] [Google Scholar]
- McEwen BS. Interacting mediators of allostasis and allostatic load: towards an understanding of resilience in aging. Metabolism. 2003;52:10–16. doi: 10.1016/s0026-0495(03)00295-6. [DOI] [PubMed] [Google Scholar]
- Melov S. Geroscience approaches to increase healthspan and slow aging. F1000Research. 2016:5. doi: 10.12688/f1000research.7583.1. [DOI] [PMC free article] [PubMed] [Google Scholar]
- Montgomery H. Cardiac reserve: linking physiology and genetics. Intensive Care Med. 2000;26:144. doi: 10.1007/s001340051131. [DOI] [PubMed] [Google Scholar]
- Pettay JE, Kruuk LE, Jokela J, Lummaa V. Heritability and genetic constraints of life-history trait evolution in preindustrial humans. Proceedings of the National Academy of Sciences of the United States of America. 2005;102:2838–2843. doi: 10.1073/pnas.0406709102. [DOI] [PMC free article] [PubMed] [Google Scholar]
- Piccardi M. 2004 IEEE international conference on systems, man and cybernetics. Vol. 4. IEEE; 2004. Background subtraction techniques: a review; pp. 3099–3104. [Google Scholar]
- Pickett CL, Dietrich N, Chen J, Xiong C, Kornfeld K. Mated progeny production is a biomarker of aging in caenorhabditis elegans. G3: Genes Genomes Genetics. 2013;3:2219–2232. doi: 10.1534/g3.113.008664. [DOI] [PMC free article] [PubMed] [Google Scholar]
- Pincus Z, Mazer TC, Slack FJ. Autofluorescence as a measure of senescence in C. elegans: look to red, not blue or green. Aging. 2016:8. doi: 10.18632/aging.100936. [DOI] [PMC free article] [PubMed] [Google Scholar]
- Pincus Z, Slack FJ. Developmental biomarkers of aging in Caenorhabditis elegans. Developmental Dynamics. 2010;239:1306–1314. doi: 10.1002/dvdy.22224. [DOI] [PMC free article] [PubMed] [Google Scholar]
- Pincus Z, Smith-Vikos T, Slack FJ. Microrna predictors of longevity in Caenorhabditis elegans. PLoS Genet. 2011;7:e1002306. doi: 10.1371/journal.pgen.1002306. [DOI] [PMC free article] [PubMed] [Google Scholar]
- Rea SL, Wu D, Cypser JR, Vaupel JW, Johnson TE. A stress-sensitive reporter predicts longevity in isogenic populations of Caenorhabditis elegans. Nature genetics. 2005;37:894–898. doi: 10.1038/ng1608. [DOI] [PMC free article] [PubMed] [Google Scholar]
- Rechel B, Grundy E, Robine JM, Cylus J, Mackenbach JP, Knai C, McKee M. Ageing in the European union. The Lancet. 2013;381:1312–1322. doi: 10.1016/S0140-6736(12)62087-X. [DOI] [PubMed] [Google Scholar]
- Sánchez-Blanco A, Kim SK. Variable pathogenicity determines individual lifespan in Caenorhabditis elegans. PLoS Genet. 2011;7:e1002047. doi: 10.1371/journal.pgen.1002047. [DOI] [PMC free article] [PubMed] [Google Scholar]
- Savitzky A, Golay MJ. Smoothing and differentiation of data by simplified least squares procedures. Analytical chemistry. 1964;36:1627–1639. doi: 10.1021/ac60319a045. [DOI] [PubMed] [Google Scholar]
- Sebastiani P, Sun F, Andersen SL, Lee J, Wojczynski MK, Sanders JL, Yashin AI, Newman AB, Perls TT. Families enriched for exceptional longevity also have increased health-span: findings from the long life family study. Frontiers in public health. 2013;1:38. doi: 10.3389/fpubh.2013.00038. [DOI] [PMC free article] [PubMed] [Google Scholar]
- Shamir L, Wolkow CA, Goldberg IG. Quantitative measurement of aging using image texture entropy. Bioinformatics. 2009;25:3060–3063. doi: 10.1093/bioinformatics/btp571. [DOI] [PMC free article] [PubMed] [Google Scholar]
- Singson A, Mercer KB, L’Hernault SW. The C. elegans spe-9 gene encodes a sperm transmembrane protein that contains egf-like repeats and is required for fertilization. Cell. 1998;93:71–79. doi: 10.1016/s0092-8674(00)81147-2. [DOI] [PubMed] [Google Scholar]
- Stroustrup N, Anthony WE, Nash ZM, Gowda V, Gomez A, López-Moyado IF, Apfeld J, Fontana W. The temporal scaling of Caenorhabditis elegans ageing. Nature. 2016 doi: 10.1038/nature16550. [DOI] [PMC free article] [PubMed] [Google Scholar]
- Stroustrup N, Ulmschneider BE, Nash ZM, López-Moyado IF, Apfeld J, Fontana W. The Caenorhabditis elegans lifespan machine. Nature methods. 2013;10:665–670. doi: 10.1038/nmeth.2475. [DOI] [PMC free article] [PubMed] [Google Scholar]
- Vaupel JW, Carey JR, Christensen K, Johnson TE, Yashin AI, Holm NV, Iachine IA, Kannisto V, Khazaeli AA, Liedo P, et al. Biodemographic trajectories of longevity. Science. 1998;280:855–860. doi: 10.1126/science.280.5365.855. [DOI] [PubMed] [Google Scholar]
- Weinstein MC, Stason WB. Foundations of cost-effectiveness analysis for health and medical practices. New England journal of medicine. 1977;296:716–721. doi: 10.1056/NEJM197703312961304. [DOI] [PubMed] [Google Scholar]
Associated Data
This section collects any data citations, data availability statements, or supplementary materials included in this article.