Abstract
Background
We examined the relationship between glucose homeostasis and comprehensive measures of cardiac structure and function among a representative sample of U.S. Hispanics.
Methods and Results
ECHO-SOL, an echocardiographic ancillary study of The Hispanic Community Health Study/Study of Latinos (HCHS/SOL), enrolled 1,818 Hispanic/Latino men (43%) and women (57%) age≥45 years (mean=56). Glucose intolerance was defined as: i) Prediabetes: HbA1c≥5.7 and <6.5%; ii) Diabetes: fasting plasma glucose≥126 mg/dL, 2-h postload glucose≥200 mg/dL, HbA1c≥6.5%, or hypoglycemic agent use. Uncontrolled diabetes (UD) was defined as HbA1c≥7.0%. Insulin resistance was defined using HOMA-IR. Echocardiography exams assessed left ventricular (LV) structure and systolic/diastolic function. Multivariable linear and logistic regression models were utilized. Prediabetes prevalence was 42% and diabetes prevalence was 28% (47% uncontrolled). Glucose intolerance was associated with increased LV posterior wall and inter-ventricular septal and relative wall thicknesses (RWT), all p<0.05; reduced ejection fraction (p<0.01); stroke and end diastolic volumes (both p-values<0.001); decreased peak e' velocity (lateral and septal p-values<0.001), increased E/e' ratio (lateral and septal p-values<0.01). The odds ratios(95% confidence intervals) for diastolic dysfunction among individuals with prediabetes and diabetes (vs. diabetes-free) respectively, were 1.36(0.96-1.9) and 1.90(1.3-2.8), p=0.006. Results were consistent for uncontrolled diabetes vs. diabetes. HOMA-IR was associated with increased E/e' (p<0.001), and greater RWT, septal thickness (both p<0.05); lower stroke volume (p<0.0001); and lower peak lateral and septal e' velocities (both p<0.01).
Conclusions
Glucose intolerance and insulin resistance are associated with unfavorable cardiac structure and function, particularly worsened measures of diastolic function, even prior to diabetes development.
Keywords: diabetes mellitus, diabetic cardiomyopathy, epidemiology, echocardiography, insulin resistance
In contrast to flattening or declining secular trends in the incidence and mortality rates of coronary heart disease, it is less clear that similar trends exist for heart failure incidence and hospitalization rates (HF) in the U.S.1, 2. What is clear is that the prevalence of HF is rising in the U.S. with a projected 46% increase between 2012 and 201301. The projected increase has multifactorial explanations including an aging population and population growth, but another potential prominent driver is the concurrent increase in the prevalence of type 2 diabetes mellitus (T2DM), the prevalence of which in the U.S. continues to increase steadily and is expected to more than double by 20503.
Due to higher rates of cardiac structure and function abnormalities4, and increased rates of incident HF5, individuals with T2DM are frequently characterized clinically as having “diabetic cardiomyopathy” (i.e., adverse changes in cardiac structure and function). However, most prior studies have only performed limited measures of cardiac structure and function and none have comprehensively evaluated cardiac parameters, particularly diastolic function with echocardiographic 2D imaging, pulse and tissue Doppler. Only the Multi-Ethnic Study of Atherosclerosis (MESA) has published results suggesting that the mechanisms linking T2DM and cardiac structure and function might be different across race/ethnicity – specifically, left ventricular mass, end diastolic volume and stroke volume6. However, in MESA, several Hispanic/Latino heritage subgroups are underrepresented (e.g. Cuban-Americans) and the MESA protocol did not assess diastolic function. Additionally, beyond the role of “diabetic cardiomyopathy” in HF development, it is unclear whether elevated, yet clinically normal, levels of T2DM risk biomarkers, such as glycosylated hemoglobin (HbA1c), fasting glucose or insulin resistance are related to cardiac structure and function among diabetes-free participants.
ECHO-SOL is an echocardiographic ancillary study to the Hispanic Community Health Study/Study of Latinos (HCHS/SOL), a multi-center epidemiologic study designed to include a diverse Hispanic/Latino subgroup representation and provide a unique opportunity to explore the role of abnormal glucose metabolism across the spectrum of glycemic homeostasis in relation to clinical and preclinical markers of cardiac structure and function.
METHODS
The HCHS/SOL is a multicenter community-based cohort study of Hispanics/Latinos in the United States designed to examine chronic disease risk factors and related longitudinal morbidity and mortality7, 8. Participants were recruited from four US communities (Bronx, New York; Chicago, Illinois; Miami, Florida; San Diego, California) using a probability sample design.
ECHO-SOL is an echocardiographic ancillary study to the HCHS/SOL with previously described methodology9. Briefly, 1,818 participants were enrolled using a stratified random sampling design to ensure that a balanced number of participants representative of the overall HCHS-SOL were enrolled at each center. Participants were eligible for ECHO-SOL if they were ≥age 45 years, self-identified as Cuban, Mexican, Puerto Rican, Dominican, Central American or South American and were within 36 months from their initial HCHS-SOL visit. The Institutional Review Board at the Wake Forest School of Medicine and at each study site provided approval and oversight of all study materials and activities. All ECHO-SOL participants gave informed consent.
In-Person Examination
The HCHS/SOL examination protocol has been previously published10. Participants were examined after an overnight, minimum 8-hour fast during which participants were asked to only consume water and necessary medications. Height (centimeters) and weight (kilograms) were measured and body mass index (BMI) was calculated as weight/height2. Seated resting blood pressures were measured in triplicate and the average of the 2nd and 3rd readings were used for analysis. Fasting blood glucose was measured from plasma using a hexokinase enzymatic method (Roche Diagnostics) and fasting insulin was assessed using a hexokinase enzymatic method (Roche Diagnostics Corporation, Indianapolis, IN)11. Hemoglobin A1c was measured from whole blood with a Tosoh G7 Automated HPLC Analyzer (Tosoh Bioscience).
Echocardiographic Protocol
A Philips IE-33 or Sonos 5500/7500 ultrasound imaging platform was used across all the Field Imaging Centers9. Trained sonographers performed echocardiography examinations, including M-mode, 2D imaging with harmonics optimizing depth and sector to maintain a high frame-rate, spectral Doppler. Color flow and tissue Doppler were performed by experienced sonographers at each Field Imaging Center as per American Society of Echocardiography (ASE) recommendations12, 13.
The following echocardiographic measured and derived variables were utilized: LV mass (LVM) was determined by subtracting the LV endocardial cavity volume from the LV epicardial volume and multiplying the resultant myocardial volume by the myocardial density (1.05 g/ml) then indexing based on BSA or height2.7. LV geometry was predicated on measurement of LVM, LV posterior wall thickness at diastole (LVPWd), inter-ventricular septal thickness at diastole (IVSd) and relative wall thickness (RWT) defined as 2*(LVPWd/LV internal diameter at diastole). Abnormal LVM and RWT were defined as >125 gm/m2 and 0.42, respectively. LV geometry was defined as normal (normal LVM, normal RWT) or abnormal with abnormal LV geometry categorized as: concentric remodeling (normal LVM, increased RWT), eccentric hypertrophy (increased LVM, normal RWT), and concentric hypertrophy (increased LVM, increased RWT)13. Our assessment of left ventricular diastolic function (LVDD) has been previously published14 and focused on 1) pulse-wave Doppler performed in the apical four chamber view with the sample volume placed in the mitral valve orifice at the level of the leaflet tips to obtain peak early (E) and late (A) diastolic transmitral inflow velocities; 2) tissue Doppler imaging to acquire mitral early diastolic (e’) annular velocities from the apical 4-chamber view (the average of septal and lateral annular velocities were used); 3) left atrial volume measured in biplane views indexed (LAVI) to BSA; and 4) pulsed-wave Doppler used for interrogation of pulmonary venous flow systolic (S) and diastolic (D) inflow velocities. The grading scheme for Diastolic Dysfunction (DD) was grade I (mild), grade II (moderate) or grade III (severe) incorporating previously published definitions using a combination of published ASE and Redfield definitions12, 15. LV stiffness was characterized by considering the end diastolic pressure-volume relationship using previous developed methods to predict the EDV at 20 mmHg (EDV20)16 where decreasing values denote increasing LV stiffness. To characterize systolic function LVEF was derived from Volumetric Assessments using the biplane method of disks,17 using the apical 4- and 2-chamber long-axis views to measure end-diastolic (EDV) and end-systolic (ESV) volumes and the LVEF calculated as follows: EF=(EDV − ESV) ⁄ EDV.
Echocardiograms were analyzed and interpreted centrally at Wake Forest School of Medicine (Winston-Salem, NC). All ECHO- SOL echocardiograms were read by a certified technical reader and over-read by a board-certified cardiologist with expertise in echocardiography (Dr. Rodriguez) with COCATS level 3 advanced training in Echocardiography and ASE Board Certification in Comprehensive Adult Echocardiography. Inter-reader reliability studies have been performed and intraclass correlations were >0.80 for all measures9, 14 indicating strong agreement.
Diabetes and Insulin Resistance Classification
Diabetes status was classified and based on American Diabetes Association (ADA) criteria11: either FPG≥126 mg/dL (7 mmol/L), 2-h postload glucose (2-h OGTT)≥200 mg/dL (11.2 mmol/L), HbA1c≥6.5% (48 mmol/mol), or documented hypoglycemic use (scanned medications). No information was available to distinguish between type 1 and T2DM. The ADA goal for HbA1c level of <7.0% (53 mmol/mol) was used to define glycemic control. Prediabetes was defined as HbA1c≥5.7 but <6.5% in the absence of treatment. Insulin resistance was calculated as insulin in μU/mL × glucose in mmol/L/22.5 according to the Homeostatic Model Assessment for Insulin Resistance (HOMA-IR)18 and participants were categorized into HOMA-IR quintiles.
Statistical Analysis
All analyses were conducted using SAS version 9.4. SAS SURVEY procedures and sampling weights were used to account for the complex survey design7, 8, 19.
Several analyses were performed to examine the associations between three primary exposures (diabetes status, diabetes control or HOMA-IR quintiles) and the aforementioned echocardiographic outcomes. First, distributions of potential confounders of the relationship between diabetes and cardiac structure and function were summarized. Age standardized (2010 census) diabetes prevalence was estimated using PROC DESCRIPT via SAS callable SUDAAN release 1111.
In separate multivariable linear regressions, the mean levels of continuous echocardiographic outcomes were regressed across categories of diabetes status, diabetes control or HOMA-IR quintiles. Adjusted mean values of select outcomes are presented across exposure categories and reported p-values are based on F-statistics. For binary outcomes under study, multivariable logistic regression was used to model the log odds of the outcome according to diabetes status. Odds ratios (95% confidence intervals) are presented. Multivariable adjusted prevalence estimates for LVDD were derived by converting the log odds obtain in logistic regression to probabilities.
We present results from crude and multivariable statistical models to inform the strength and direction of possible confounding by age, sex, study site, tobacco use (never/former/current), alcohol use (never/former/current), physical activity levels (low/moderate/high, based on self-report14), body mass index, hypertension (blood pressure medication or systolic blood pressure≥140 or diastolic blood pressure≥90 mmHg), and chronic kidney disease (eGFR<60 ml/min per 1.73 m2); GFR was estimated from serum creatinine according to NIDDK guidelines and the CKD-Epi equation. Models including income and education adjustments were also considered but had no meaningful influence on results and were removed to enhance parsimony and precision.
The scaling used in figures is based on clinically meaningful ranges. Zero was not included in the scale, as values of zero are not biologically plausible for any of our echocardiographic outcomes.
RESULTS
The average age for the ECHO-SOL target population was 56 years with 57% female. The proportion self-identifying as Central/South American, Cuban, Mexican, Puerto Rican or Dominican background were 18%, 19%, 25%, 18% and 18% respectively. Additional general characteristics are summarized in Table 1 and Supplemental Tables 1-3.
Table 1.
General Characteristics of 1,818 Participants enrolled in the echocardiographic ancillary study of The Hispanic Community Health Study / Study of Latinos (ECHO-SOL).
| Variable | Mean±SD or unweighted N (weighted%) |
|---|---|
| Age, Mean | 56.36±0.37 |
| Age, Greater than 65 years | 214 (21.0) |
| Male | 631 (42.6) |
| Hypertension | 861 (50.0) |
| Renal disease§ | 106 (6.40) |
| Body Mass Index, mean | 30.11 ± 0.22 |
| Body Mass Index greater than or equal to 30 kg/m2 | 822 (44.30) |
| Current Alcohol Use | 770 (43.50) |
| Current Tobacco Use | 304 (17.60) |
| Health Insurance | 1042 (60.10) |
| Education, Less than high school | 647 (34.80) |
| Income below 20,000 US Dollars | 900 (54.50) |
|
| |
| Hispanic Subgroup Distribution | |
|
| |
| Dominican | 326 (18.20) |
| Central American | 176 (6.40) |
| Cuban American | 356 (31.60) |
| Mexican American | 458 (20.40) |
| Puerto Rican | 348 (17.10) |
| South American | 150 (6.20) |
|
| |
| Echocardiographic Variables | |
|
| |
| Left Atrial Volume Index >29 ml/m2 | 319 (17.1) |
|
| |
| Left Atrial Volume Index >34 ml/m2 | 122 (6.9) |
| Early diastolic mitral annular velocity (E') < 8 cm/sec | 905 (52.50) |
| E/E' ratio > 10 | 747(41.0) |
| No LV Diastolic Dysfunction | 753 (46.50) |
| LV Diastolic Dysfunction, Grade 1 | 230 (16.10) |
| LV Diastolic Dysfunction, Grade 2 | 607 (35.50) |
| LV Diastolic Dysfunction, Grade 3 | 39 (1.90) |
| Ejection Fraction, % | 59.80 ± 0.20 |
| End Systolic Volume, ml | 33.80 ± 0.37 |
| End Diastolic Volume, ml | 83.50 ± 0.70 |
|
| |
| Comorbidities | |
|
| |
| Myocardial infarction defined by ECG | 39 (2.76) |
| Stroke or TIA | 59 (3.75) |
| Heart failure | 49 (3.65) |
| Cardiovascular Disease* | 791 (41.55) |
|
| |
| Chronic kidney disease | |
|
| |
| Mild | 958 (53.69) |
| Moderate | 99 (6.05) |
| Severe | 4 (0.16) |
| End-stage | 2 (0.24) |
| Estimated-Glomerular Filtration Rate (mL/min per 1.73 m2 | 90.0±0.66 |
Data are presented as mean ± SEM or N (%) using weighted row percentages; N’s presented are unweighted counts of total participants in the HCHS-SOL with respective characteristic. It is HCHS/SOL publication policy to present weighted percents but unweighted percents can be calculated based on unweighted Ns presented. The number of participants with missing data for select variables are summarized as follows: renal disease, n=5; BMI, n=1; alcohol use, n=1; cigarette use, n=2; health insurance, n=20; educational status, n=39; income, n=131; LAVI, n=37; (E') < 8 cm/sec, n=10; E/E' ratio > 10 , n=21; diastolic dysfunction, n=32;
Chronic kidney disease defined by eGFR <60 mL/min and NIDDK criteria.
Defined via Framingham CVD composite criteria.
The prevalence of diabetes in the ECHO-SOL population was 28% (53%=controlled and 47%=uncontrolled) while prediabetes prevalence was 42%. The age-standardized prevalence of diabetes was 29% (30% vs. 28% in men vs. women). The overall mean HbA1c level was 6.06%±0.04% and mean HbA1c values among individuals who were diabetes-free, or had prediabetes, controlled diabetes or uncontrolled diabetes were 5.3%±0.02%, 5.8%±0.02%, 6.2%±0.03% and 8.7%±0.15%, respectively. Median(25th,75th percentile) HOMA-IR values across quintiles of HOMA-IR were 1.0(0.9,1.2), 1.8(1.6,1.9), 2.5(2.3,2.7), 3.6(3.3,4.1) and 6.7(5.4,9.7) respectively. Prevalence of increased LV hypertrophy was 26%, abnormal LV geometry (45%), systolic dysfunction (3.6%) and diastolic dysfunction (grade I-III) (61%).
Relationship between prediabetes, diabetes and cardiac structure and function
In multivariable analysis adjusted for the aforementioned cardiometabolic risk factors, glycemic status was not associated with LVM, although several individual indices of LVM (LVPWd, IVSd) were elevated in diabetes vs. diabetes-free individuals (all p<0.05, Table 2). LV geometry differed significantly by diabetes status with higher RWT and more prevalent abnormal LV geometry among diabetes vs. diabetes-free individuals Table 2 and Supplemental Figure 1). Ejection fraction and LV stroke volume were significantly reduced among individuals with diabetes when compared to diabetes-free individuals. E/e' lateral ratio was elevated in prediabetes and diabetes by ~5% and 7% respectively while lateral and medial peak e' velocities were both decreased by a similar degree (all p-values<0.001). Prediabetes and diabetes were associated with a 1.36 (p=0.057) and 1.90 (p<0.05) fold increase in the odds of LVDD. Values of EDV20 among individuals who were diabetes-free, had prediabetes or diabetes were 92.4±1.5, 88.8±1.0 and 85.3±1.6 respectively (p=0.005).
Table 2.
Measures of cardiac structure and function according to diabetes or prediabetes status. Results presented as mean(SE) or odds ratio(95%CI) as appropriate. From echocardiographic ancillary study of The Hispanic Community Health Study/Study of Latinos (ECHO-SOL).
| Cardiac Structure | Systolic Function | Diastolic Function | ||||||||||||
|---|---|---|---|---|---|---|---|---|---|---|---|---|---|---|
| Nondiabetic n=545(30%) |
Prediabetic n=743(42%) |
Diabetic n=518(28%) |
P-Value | Nondiabetic n=545(30%) |
Prediabetic n=743(42%) |
Diabetic n=518(28%) |
P-Value | Nondiabetic n=545(30%) |
Prediabetic n=743(42%) |
Diabetic n=518(28%) |
P-Value | |||
| Left Ventricular Mass Index(2.7) | Ejection Fraction (MOD- biplane)% | E/e' Lateral Ratio | ||||||||||||
| M1 | 38.15±0.51 | 41.73±0.541 | 44.75±0.72 1 | <0.0001 | 60.10±0.28 | 60.20±0.25 | 58.87±0.361,2 | 0.003 | 7.99±0.12 | 9.06±0.23 1 | 9.77±0.21 1,2 | <0.0001 | ||
| M2 | 40.88±0.58 | 41.58±0.57 | 42.87±0.68 | 0.08 | 60.09±0.34 | 60.19±0.27 | 58.84±0.421,2 | 0.009 | 8.69±0.15 | 9.09±0.17 1 | 9.34±0.19 1 | 0.003 | ||
| M3 | 39.41±0.69 | 40.00±0.64 | 41.36±0.90 | 0.21 | 60.56±0.40 | 60.66±0.31 | 59.17±0.501,2 | 0.02 | 8.46±0.16 | 8.89±0.181 | 9.16±0.281 | 0.02 | ||
| LV mass (grams/m2) | Fractional Shortening (%) | E/e' Septal Ratio | ||||||||||||
| M1 | 78.11±0.87 | 82.67±1.24 1 | 87.72±1.38 1,2 | <0.0001 | 30.03±0.44 | 29.94±0.24 | 29.64±0.39 | 0.74 | 10.52±0.18 | 11.50±0.20 1 | 13.02±0.23 1,2 | <0.0001 | ||
| M2 | 82.38±1.25 | 83.21±1.12 | 86.25±1.38 | 0.11 | 29.84±0.44 | 30.08±0.27 | 29.92±0.39 | 0.84 | 11.22±0.19 | 11.49±0.17 | 12.57±0.21 1,2 | <0.0001 | ||
| M3 | 80.19±0.57 | 80.51±0.53 | 82.86±0.911,2 | 0.003 | 30.01±0.55 | 30.20±0.36 | 29.97±0.56 | 0.91 | 10.85±0.21 | 11.17±0.19 | 12.11±0.29 1,2 | 0.003 | ||
| Left Ventricular Posterior Wall(diastole) Thickness (cm) | Lateral Peak S Vel cm/sec | Left Atrial Volume Index | ||||||||||||
| M1 | 0.84±0.01 | 0.88±0.01 1 | 0.93±0.01 1,2 | <0.0001 | 8.41±0.12 | 8.31±0.13 | 8.17±0.14 | 0.44 | 23.54±0.34 | 22.93±0.32 | 22.61±0.44 | 0.16 | ||
| M2 | 0.86±0.01 | 0.87±0.01 | 0.91±0.01 1 | 0.03 | 8.49±0.14 | 8.49±0.15 | 8.39±0.15 | 0.81 | 24.86±0.39 | 23.88±0.34 | 23.27±0.44 1 | 0.02 | ||
| M3 | 0.84±0.02 | 0.86±0.01 | 0.89±0.02 | 0.21 | 8.51±0.15 | 8.63±0.20 | 8.33±0.18 | 0.49 | 24.47±0.24 | 23.39±0.21 1 | 21.75±0.44 1,2 | <0.0001 | ||
| Inter-ventricular Septum (diastole) Thickness (cm) | Stroke Volume (LVOT)ml | Lateral Peak e' Vel cm/sec | ||||||||||||
| M1 | 1.01±0.01 | 1.09±0.01 1 | 1.14±0.01 1,2 | <0.0001 | 69.51±1.13 | 71.48±0.94 | 69.56±1.06 | 0.26 | 10.34±0.18 | 9.01±0.18 1 | 8.35±0.16 1,2 | <0.0001 | ||
| M2 | 1.06±0.01 | 1.09±0.01 | 1.11±0.01 1 | 0.02 | 75.16±1.24 | 73.63±1.12 | 69.98±1.14 1,2 | 0.005 | 9.69±0.15 | 9.21±0.13 1 | 8.92±0.14 1 | 0.0004 | ||
| M3 | 1.04±0.02 | 1.05±0.01 | 1.07±0.02 | 0.54 | 74.13±1.48 | 72.33±1.23 | 68.50±1.49 1,2 | 0.02 | 9.77±0.17 | 9.28±0.15 1 | 8.89±0.20 1 | 0.003 | ||
| Relative Wall Thickness | End Diastolic Volume(MOD-biplane) ml | Medial Peak e' Vel cm/sec | ||||||||||||
| M1 | 0.38±0.004 | 0.40±0.01 1 | 0.42±0.01 1,2 | <0.0001 | 84.11±1.46 | 84.23±0.96 | 81.92±1.40 | 0.40 | 7.73±0.11 | 6.89±0.10 1 | 6.12±0.11 1,2 | <0.0001 | ||
| M2 | 0.38±0.01 | 0.39±0.01 | 0.41±0.01 1 | 0.002 | 89.86±1.45 | 86.68±0.94 | 83.31±1.52 1 | 0.009 | 7.30±0.11 | 7.02±0.08 | 6.48±0.10 1,2 | <0.0001 | ||
| M3 | 0.37±0.01 | 0.38±0.01 | 0.40±0.01 1 | 0.08 | 88.91±1.66 | 84.68±1.21 1 | 81.15±1.82 1 | 0.01 | 7.44±0.14 | 7.15±0.09 1 | 6.61±0.12 1,2 | <0.001 | ||
|
LV Geometry
(Odds Ratios for abnormal vs. normal) |
End Systolic Volume(MOD-biplane) ml |
Diastolic Dysfunction
(Odds Ratios for grade I-III vs. normal) |
||||||||||||
| M1 | 1.00 | 1.93 (1.4-2.7) | 2.79 (2.0-3.9) | <0.0001 | 33.74±0.70 | 33.75±0.43 | 33.96±0.81 | 0.97 | 1.00 | 2.34 (1.7-3.3) | 4.35 (3.1-6.2) | <0.0001 | ||
| M2 | 1.00 | 1.49 (1.1-2.1) | 1.81 (1.2-2.8) | 0.01 | 36.15±0.72 | 34.82±0.45 | 34.64±0.94 | 0.17 | 1.00 | 1.36 (0.96-1.9) | 1.90 (1.3-2.8) | 0.006 | ||
| M3 | 1.00 | 1.53 (1.0-2.4) | 1.79 (1.0-3.1) | 0.06 | 35.35±0.82 | 33.62±0.52 | 33.28±0.91 | 0.12 | 1.00 | 1.48 (1.0-2.2) | 2.13 (1.3-3.5) | 0.01 | ||
Model 1: crude
Model 2: adjusted for age, sex, site, smoking status, alcohol use, physical activity level, body mass index, hypertension and chronic kidney disease
Model 3: sensitivity analyses excluding participants with cardiovascular disease and kidney disease adjusted for age, sex, site, smoking status, alcohol use, physical activity level, body mass index and hypertension
: p<0.017 for comparison with diabetes-free
: p<0.017 for comparison between diabetes and prediabetes
Relationship between diabetes control and cardiac structure and function
LVM was significantly higher among those with uncontrolled vs. controlled diabetes. LVPWd, IVSd and RWT were all higher in uncontrolled vs. controlled diabetes (Table 3). Ejection fraction was modestly but significantly decreased in uncontrolled vs. controlled diabetes (p=0.002, Table 3). Several measures of diastolic function demonstrated consistent and significant differences between uncontrolled and controlled diabetes. E/e' lateral and septal ratios were both elevated among individuals with uncontrolled diabetes (both p-values<0.0001, Table 3), whereas e' lateral and septal velocities were decreased in uncontrolled vs. controlled diabetes (p<0.0001, Table 3). Diastolic dysfunction was significantly less likely among those with controlled vs. uncontrolled diabetes (OR[95%CI]=0.48[0.3, 0.9]). EDV20 values were elevated in controlled vs. uncontrolled diabetes (86.5±1.1 vs. 83.1±1.3, p=0.04).
Table 3.
Measures of cardiac structure and function according to diabetes control. Results from echocardiographic ancillary study of The Hispanic Community Health Study/Study of Latinos (ECHO-SOL).
| Cardiac Structure | Systolic Function | Diastolic Function | |||||||||
|---|---|---|---|---|---|---|---|---|---|---|---|
| Uncontrolled*
n=244 (47%) |
Controlled n=279 (53%) |
P-Value | Uncontrolled*
n=244 (47%) |
Controlled n=279 (53%) |
P-Value | Uncontrolled*
n=244 (47%) |
Controlled n=279 (53%) |
P-Value | |||
| LV Mass Index 2.7 | End Diastolic Volume, MOD-biplane(ml) | E/e' Lateral Ratio | |||||||||
| M1 | 45.09±0.56 | 44.53±0.26 | 0.37 | 81.03±1.07 | 82.49±0.47 | 0.21 | 10.06±0.11 | 9.53±0.09 | 0.0002 | ||
| M2 | 44.02±0.55 | 43.48±0.38 | 0.35 | 81.48±1.30 | 84.44±1.03 | 0.07 | 9.89±0.12 | 9.16±0.17 | <0.0001 | ||
| M3 | 43.34±1.05 | 40.54±0.59 | <0.0001 | 77.89±1.83 | 78.93±0.96 | 0.56 | 9.74±0.32 | 9.34±0.27 | 0.16 | ||
| LV mass (grams/m2) | End Systolic Volume, (MOD-biplane±ml) | E/e' Septal Ratio | |||||||||
| M1 | 88.95±1.01 | 86.88±0.52 | 0.07 | 34.43±0.64 | 33.55±0.21 | 0.19 | 13.51±0.14 | 12.67±0.08 | <0.0001 | ||
| M2 | 87.54±1.13 | 84.95±0.76 | 0.03 | 34.54±0.72 | 34.52±0.55 | 0.99 | 13.67±0.14 | 12.71±0.18 | <0.0001 | ||
| M3 | 85.62±1.82 | 79.17±1.09 | <0.0001 | 31.74±0.97 | 31.23±0.48 | 0.60 | 12.53±0.34 | 12.17±0.25 | 0.20 | ||
| LV Posterior Wall at diastole (cm) | Ejection Fraction (MOD-biplane)% | LA Volume Index | |||||||||
| M1 | 0.94±0.01 | 0.92±0.004 | 0.05 | 58.21±0.25 | 59.36±0.12 | <0.0001 | 22.60±0.35 | 22.64±0.14 | 0.90 | ||
| M2 | 0.92±0.01 | 0.88±0.01 | 0.002 | 58.54±0.27 | 59.39±0.21 | 0.002 | 22.91±0.33 | 23.13±0.31 | <0.0001 | ||
| M3 | 0.89±0.02 | 0.84±0.01 | <0.0001 | 59.42±0.46 | 60.04±0.27 | 0.13 | 21.16±0.80 | 20.82±0.46 | 0.57 | ||
| Inter-ventricular Septal Diameter (cm) | Fractional Shortening (%) | Lateral Peak e' Velocity (cm/s) | |||||||||
| M1 | 1.17±0.01 | 1.11±0.01 | <0.0001 | 29.55±0.24 | 29.70±0.13 | 0.62 | 8.04±0.12 | 8.60±0.07 | <0.0001 | ||
| M2 | 1.16±0.01 | 1.10±0.01 | <0.0001 | 29.32±0.31 | 29.47±0.21 | 0.62 | 8.22±0.12 | 9.12±0.12 | <0.0001 | ||
| M3 | 1.13±0.01 | 1.03±0.01 | <0.0001 | 30.14±0.43 | 29.35±0.36 | 0.02 | 8.01±0.15 | 8.84±0.12 | <0.0001 | ||
| Relative Wall Thickness | Lateral Peak S Velocity (cm/s) | Medial Peak e' Velocity (cm/s) | |||||||||
| M1 | 0.43±0.004 | 0.41±0.002 | 0.002 | 8.25±0.09) | 8.12±0.05 | 0.14 | 5.85±0.06 | 6.32±0.04 | <0.0001 | ||
| M2 | 0.42±0.003 | 0.39±0.004 | <0.0001 | 8.50±0.10) | 8.50±0.10 | 0.96 | 5.82±0.06 | 6.39±0.06 | <0.0001 | ||
| M3 | 0.40±0.01 | 0.37±0.004 | 0.0001 | 8.41±0.15) | 8.34±0.11 | 0.65 | 5.96±0.09 | 6.63±0.06 | <0.0001 | ||
|
LV Geometry
(Odds Ratios for abnormal vs. normal) |
Stroke Volume (LVOT) ml |
Diastolic Dysfunction
(Odds Ratios for grade I-III vs. normal) |
|||||||||
| M1 | 1.00 | 0.82(0.5-1.4) | 0.44 | 69.04±0.68) | 69.95±0.46 | 0.25 | 1.00 | 0.64(0.4-1.1) | 0.08 | ||
| M2 | 1.00 | 0.77(0.5-1.3) | 0.35 | 71.21±0.84) | 72.35±0.68 | 0.20 | 1.00 | 0.48(0.3-0.9) | 0.02 | ||
| M3 | 1.00 | 0.67(0.3-1.6) | 0.36 | 72.09±1.29) | 69.34±0.90 | 0.002 | 1.00 | 0.96(0.4-2.2) | 0.93 | ||
Model 1: crude
Model 2: age, sex, site, smoking status, alcohol use, physical activity level, body mass index, hypertension and chronic kidney disease
Model 3: sensitivity analyses excluding participants with cardiovascular disease and kidney disease adjusted for age, sex, site, smoking status, alcohol use, physical activity level, body mass index and hypertension
Uncontrolled diabetes defined as HbA1c≥7.
Linear relationships between A1c are presented in supplemental table 4 and are consistent with the aforementioned results.
Relationship between insulin resistance and cardiac structure and function
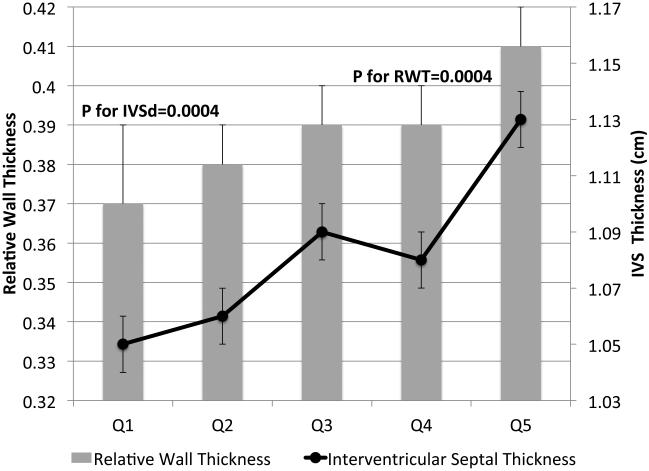
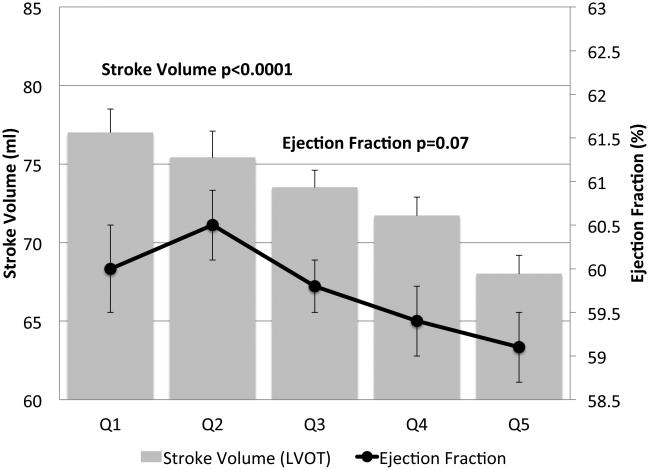
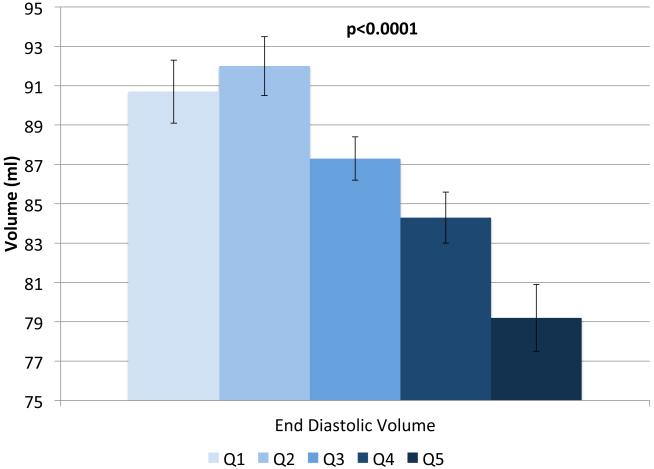
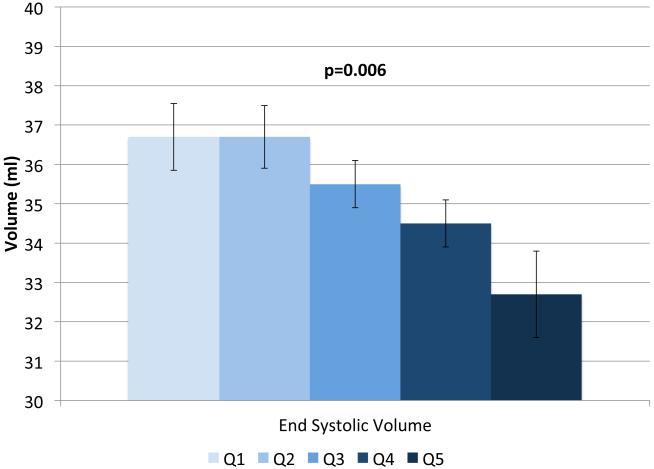
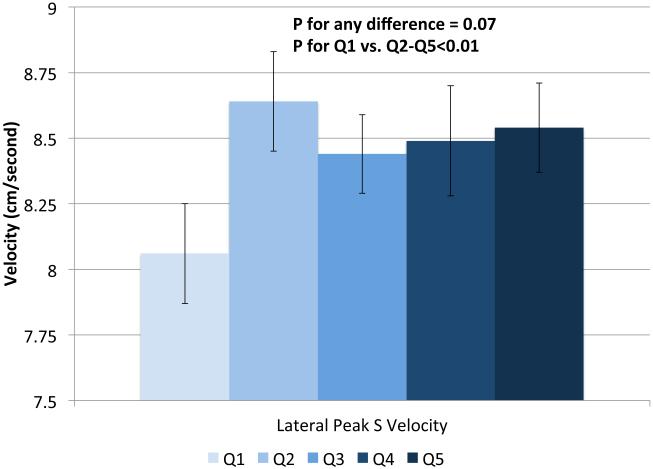
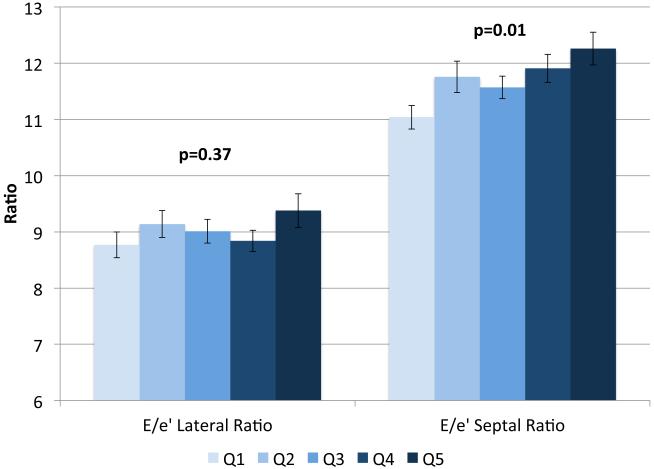
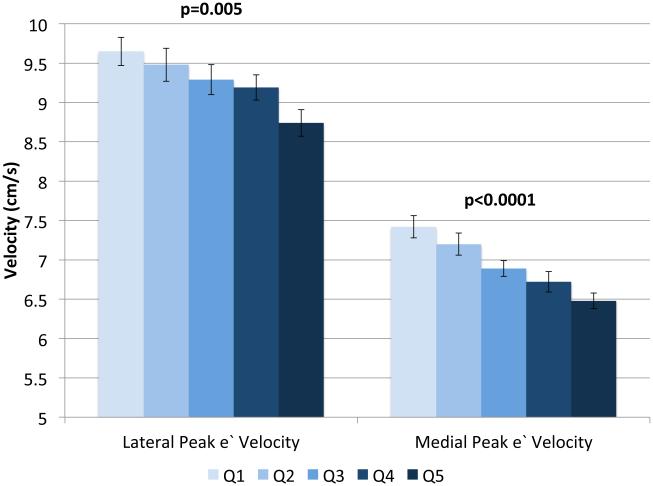
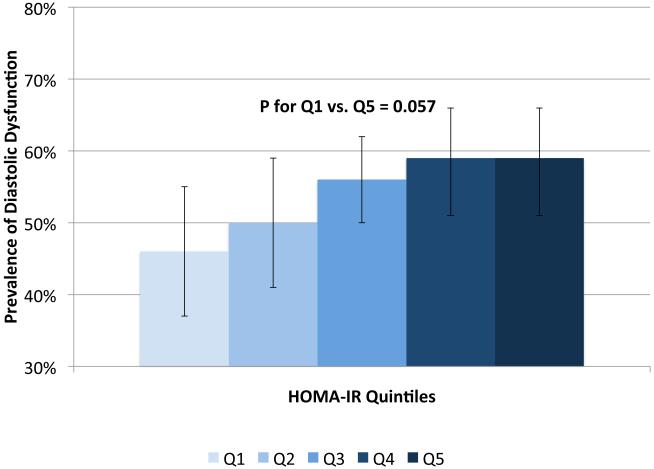
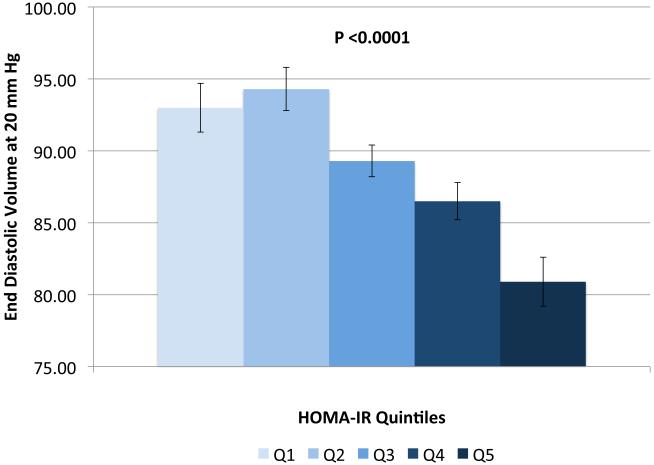
IVSd and relative wall thickness values all increased across quintiles of HOMA-IR (p<0.001, Figure 1). Trends were similar for LVPWd and adjusted mean±SE values were 0.87±0.02, 0.86±0.01, 0.88±0.02, 0.88±0.01 and 0.91±0.01, respectively. LV mass did not differ by HOMA-IR quintile (adjusted mean±SE values; 42±0.8, 41.3±0.7, 41.8±0.8, 41.7±0.7 AN 42.3±1.1, p=0.90). LV stroke volume decreased in a linear fashion across quintiles of HOMA-IR (Figure 2a) while there tended to be a nonlinear decreasing trend for ejection fraction (p for any difference=0.07, Figure 2a) with the highest EF observed in quintile 2; only the EFs in quintiles 4 and 5 were statistically significantly different than quintile 2 (p<0.04 and p<0.005, respectively). End diastolic volume and systolic volume decreased by ~13% and ~10%, respectively, when comparing 5th vs. 1st quintiles of HOMA-IR (p<0.05, Figures 2b & 2c). Increased levels of HOMA-IR were not associated with E/e' lateral ratios but were associated with a modest increase in E/e' septal ratio (Figure 3a). In contrast, both lateral and medial peak e' wave velocities decreased with increasing insulin resistance (both p-values<0.01, Figure 3b). The odds of LVDD among individuals in Q2 or Q3 of HOMA-IR (vs. Q1) were ~1.0 while Q4 and Q5 ORs were both 1.34 (p for any difference = 0.24). Figure 3c shows the prevalence of diastolic dysfunction across HOMA-IR quintiles, which increased by 13% between the first and fifth quintiles (p=0.057). EDV20 was reduced by 14% when comparing 5th vs. 1st quintiles of HOMA-IR (p<0.0001, Figure 3d). Additional tabular results for HOMA-IR are presented in Supplemental Table 5.
FIGURE 1.
Relationship between quintiles of Homeostatic Model Assessment for Insulin Resistance (HOMA-IR) and measures of cardiac structure. Adjusted for age, sex, site, smoking status, alcohol use, physical activity, BMI, hypertension and chronic kidney disease. The scaling is based on clinically meaningful ranges. Zero was not included in the scale, as a value of zero is not biologically plausible.
FIGURE 2.
Relationship between quintiles of Homeostatic Model Assessment for Insulin Resistance (HOMA-IR) and measures of systolic function including: ejection fraction and stroke volume (a), end diastolic volume (b), end systolic volume (c) and lateral peak S velocity (d). Adjusted for age, sex, site, smoking status, alcohol use, physical activity, BMI, hypertension and chronic kidney disease. The scaling is based on clinically meaningful ranges. Zero was not included in the scale, as a value of zero is not biologically plausible.
FIGURE 3.
Relationship between quintiles of Homeostatic Model Assessment for Insulin Resistance (HOMA-IR) and measures of diastolic function including: E/e' lateral and E/e' septal ratios (a), lateral peak E' and medial peak E' velocities (b), prevalent diastolic dysfunction (c), and (d) predicted end diastolic volume at an ED pressure of 20 mmHg. Adjusted for age, sex, site, smoking status, alcohol use, physical activity, BMI, hypertension and chronic kidney disease. The scaling is based on clinically meaningful ranges. Zero was not included in the scale, as a value of zero is not biologically plausible.
Analyses for the HOMA-IR exposure were conducted in subgroups of individuals with and without diabetes and the overall trends were not meaningfully changed (data not shown).
DISCUSSION
In a large diverse sample of Hispanic/Latino men and women living in the U.S., we investigated the association between both impaired glucose regulation and insulin resistance, and comprehensive measures of cardiac structure as well as systolic and diastolic function. Both insulin resistance and dysglycemia (across the spectrum from prediabetes to uncontrolled diabetes) were associated with several outcome but most consistently with E/e' lateral and septal ratios, and lateral and medial peak e' velocities. These findings advance the robust literature on the cardiac abnormalities in diabetes (a.k.a., diabetic cardiomyopathy)4, 6, 20-23 in valuable ways. First, we perform a robust characterization of cardiac structure and function beyond just LVM and LVEF, including several measures of diastolic function. Second, we include diabetes-free individuals and investigate elevated but clinically normal glucose levels as well as insulin resistance (two prominent metabolic abnormalities in diabetogenesis). This feature expands the concept of diabetic cardiomyopathy by demonstrating that the relationships emerge prior to the development of clinical diabetes and suggesting a continuum of risk vs. a dichotomy. Third, our sample of Hispanic/Latino adults is inclusive of Hispanic/Latino background subgroups not previously studied, thereby enhancing generalizability to U.S. Hispanics.
The current findings in ECHO-SOL provide the first assessment of diastolic dysfunction among Hispanics/Latinos with diabetes and reveal several noteworthy abnormalities. Measures of E/e' lateral and septal ratios, and lateral and septal peak e' velocities were all worse in prediabetes and diabetes. Accordingly, the odds of diastolic dysfunction were increased in prediabetes and diabetes. Similarly, individuals with uncontrolled diabetes (vs. controlled diabetes) had less favorable values for several LVDD measures, including an ~2-fold higher odds of LVDD and a decreasing end diastolic pressure-volume relation denoting increasing LV stiffness. These data support the notion that worsened measures of cardiac structure (greater LVM) with normal systolic function (ESV) previously observed among Hispanics6 might be due to a diabetic cardiomyopathy that is more predominantly defined by greater ventricular stiffness and diastolic dysfunction.
Consistent with several previous reports from both the U.S. and Europe4, 6, 20-24, we also found that relative to diabetes-free individuals, those with diabetes or prediabetes had worse measures of cardiac structure including increased inter-ventricular septum and LVPWd thickness despite modest increases in LVM. This latter finding for LVM is consistent with results from previous studies that have found LVM to be higher among groups with glucose intolerance4, 6, 22, 23, reinforcing the notion that alterations in cardiac structure and function begin even in prediabetes before overt clinical dysglycemia.
Our study is one of the first to assess the impact of diabetes on cardiac geometry. We found that those with diabetes or prediabetes had greater RWT and an increased odds of abnormal LV geometry. Our findings that stroke volume was decreased in diabetes and end diastolic volume was lower in prediabetes and diabetes, contrast with results from MESA. In MESA, no association was reported between diabetes status and either end diastolic volume or stroke volume (although subgroup analyses showed findings in men to be consistent with our results)6. Neither diabetes nor prediabetes were associated with fractional shortening in ECHO-SOL which is consistent with Cardiovascular Health Study results20 but conflicts with Strong Heart Study results, in which modestly reduced fractional shortening was observed in diabetes4. However, the generally weak relationships between diabetes status and measures of systolic function are consistent with the notion that diabetic cardiomyopathy among Hispanics/Latinos is predominantly driven by diastolic dysfunction.
The fact that several outcomes were less favorable among prediabetics, although to a lesser degree, is consistent with results from at least three other samples6, 20, 23, 24 and further demonstrates that subtle cardiac abnormalities likely begin early in the natural history of diabetogenesis and prior to the manifestation of clinically abnormal glucose values. This is also supported by longitudinal results from the MONICA/KORA study, which demonstrate worsened cardiac structural and functional longitudinal changes among initially diabetes-free individuals who develop diabetes longitudinally24. From a clinical perspective, this finding may indicate value in risk stratification algorithms to incorporate early indicators of glucose intolerance.
Few previous studies have compared echocardiographic parameters between controlled and uncontrolled diabetes. We observed that several echocardiographic parameters were worse among those with uncontrolled diabetes. Whether aggressive glucose lowering therapy can prevent these cardiac alterations remains unknown but it supports the notion that HbA1c<7% may be important for cardiac health.
To our knowledge, this is the first report to investigate the association between insulin resistance and cardiac structure and function among Hispanic/Latinos. As with results for prediabetes, the observation that insulin resistance is associated with echocardiographic parameters suggests that the pathophysiology linking diabetes to heart failure risk might begins early in the natural history of diabetogenesis. Patterns observed for insulin resistance were generally unchanged even when restricted to individuals with or without diabetes suggesting mechanisms independent of hyperglycemia.
The observation that measures of diastolic function were consistently worsened among groups with prediabetes, uncontrolled diabetes, or insulin resistance is consistent with results from prior studies of diastolic heart failure in the context of diabetic cardiomyopathy25, 26. In particular, our EDV20 findings indicate that LV compliance during diastole is reduced among individuals with prediabetes/diabetes as well as among uncontrolled diabetes and along a gradient of increasing insulin resistance. These results hint that this relationship potentially exists across a broad spectrum of glucose intolerance extending into ‘clinically normal’ glucose ranges. Moreover, we also observed increased prevalence of diastolic dysfunction in the presence of diabetes and/or elevated insulin resistance. These findings are of particular relevance given the contemporary challenge posed by heart failure with preserved ejection fraction (HFpEF). Although HFpEF now accounts for 50% of heart failure cases and has similarly poor outcomes compared to heart failure with reduced ejection fraction, there is limited knowledge about the pathophysiology of HFpEF and effective treatments for HFpEF remain elusive27. However, our findings of lower LAVI values are unexpected and seemingly contradictory to our other findings. One explanation is that our findings of structural and functional abnormalities are early in their time-course in this relatively young cohort. Since LAVI serves as a barometer of cumulative exposure to these structural and functional abnormalities it is possible that over time LAVI will increase on future sequential echocardiographic exams. Further, others recently have noted reduced left atrial volume indexed to BSA in diabetes28, which may reflect “overcorrection” by indexing to BSA in obese patients. Future studies, including ongoing longitudinal echocardiographic reassessments in ECHO-SOL 2, will help inform the natural progression of left atrial parameters vis-à-vis glucose homeostasis specifically, and to evaluate whether diabetic cardiomyopathy has a unique underlying pathophysiology among Hispanics/Latinos that might predispose to HFpEF.
The magnitudes of our observed associations are modest, limiting the short-term clinical relevance of these findings. However, the long-term public health importance is likely high given the potential for accumulation of cardiac damage over the life-course. This possibility is particularly salient given the high diabetes prevalence among Hispanics/Latinos11, 29, 30 coupled with the fact that cardiac dysfunction is an independent risk factor for future development of clinical HF5, 31-35.
Some limitations should be noted. These data are cross-sectional in nature, limiting temporal inference, although it is unlikely that the generally modest levels of cardiac structural and functional abnormalities contributed meaningfully to the diabetic or prediabetic state, thus modestly strengthening temporal inference. We did not distinguish between T1 and T2 diabetes and it is possible that different diabetes etiologies are differentially related to cardiomyopathy. Given the extremely low prevalence of T1 diabetes (<1% among Hispanics), it is likely that the present findings largely reflect T2DM. Diabetes status was confirmed based on one encounter and without repeated testing, possibly causing some misclassification; however, this measurement error would have likely biased results towards the null. Finally, although the prevalence of systolic dysfunction was low, possibly limiting our power to detect associations, we used the most recent recommended volumetric methodology for assessing LVEF; however, LVEF may not be as sensitive a measure and possibly utilizing speckle tracking echocardiography in future studies will provide further insight.
The aforementioned weaknesses are counterbalanced by notable strengths. Our ECHO-SOL sample provides the largest dataset of echocardiographic parameters to date focused solely on US Hispanics/Latinos and is inclusive of previously underrepresented Hispanic/Latino background groups; ECHO-SOL represents both the overall HCHS/SOL sample as well as the Hispanic/Latino background group distribution found in each HCHS/SOL field center, thus heightening generalizability. Our inclusion of robust diastolic function assessments informs the evolving understanding of diabetic cardiomyopathy and justifies future mechanistic and interventional investigations relevant to diastolic function. Finally, we have considered whether insulin resistance, a key pathology in the early natural history of diabetogenesis, is related to cardiac structure and function among diabetes-free Hispanics.
We have found prediabetes, controlled diabetes, uncontrolled diabetes and insulin resistance to be associated with modest differences in several measures of cardiac structure and function in a population-based sample of Hispanic/Latino men and women. Findings were generally stronger for measures of diastolic function but were nevertheless present for measures of cardiac structure and largely consistent with results from non-Hispanic study samples. However, the generally weak relationships between diabetes status and measures of systolic function are consistent with the notion that diabetic cardiomyopathy among Hispanics/Latinos may predominantly manifest as diastolic dysfunction. The observed associations were consistent after multivariable adjustment for confounders, including measures of adiposity, hypertension and health behaviors. Longitudinal follow-up of the ECHO-SOL cohort is necessary to determine whether these modest associations translate in better prediction of clinically relevant outcomes including incident heart failure and mortality. If so, these results would have high public health importance given the fact that Hispanics have high rates of T2DM (diagnosed and undiagnosed)29, 30, coupled with the fact that Hispanics are expected to account for 25% of the U.S. population by 2050 and little is known about the interplay between glucose homeostasis, insulin resistance and cardiac abnormalities.
Supplementary Material
Clinical Perspective.
We investigated the relationship between glucose homeostasis and comprehensive measures of cardiac structure and function among a representative sample of U.S. Hispanics enrolled in ECHO-SOL, an echocardiographic ancillary study of The Hispanic Community Health Study/Study of Latinos (HCHS/SOL). We found several measures of worsened cardiac structure and function among individuals with either diabetes or prediabetes (relative to healthy individuals) as well as among individuals with increased levels of insulin resistance and findings were particularly strong for measures of diastolic dysfunction. Our findings inform and extend the clinical concept of “diabetic cardiomyopathy” (i.e., adverse changes in cardiac structure and function commonly observed among patients with diabetes) in two ways. First they confirm that diabetes (both controlled and uncontrolled) is related to worse measures of cardiac structure and function. Second, they demonstrate these relationships emerge early in the natural history of diabetogenesis, prior to the development of frank diabetes. Consequently, these findings raise the possibility that primary prevention efforts targeting insulin resistance and glucose homeostasis might also be beneficial for optimal cardiac health and heart failure prevention although future studies are necessary to inform this potential.
ACKNOWLEDGMENTS
The authors acknowledge the investigators, the staff, and the participants of HCHS-SOL and ECHO-SOL for their dedication and commitment to the success of this study. Investigators website - http://www.cscc.unc.edu/hchs/
SOURCES OF FUNDING
The Hispanic Community Health Study/Study of Latinos was carried out as a collaborative study supported by contracts from the National Heart, Lung, and Blood Institute (NHLBI) to the University of North Carolina (N01- HC65233), University of Miami (N01-HC65234), Albert Einstein College of Medicine (N01-HC65235), Northwestern University (N01-HC65236), and San Diego State University (N01-HC65237). The following Institutes/Centers/Offices contribute to the HCHS/SOL through a transfer of funds to the NHLBI: National Institute on Minority Health and Health Disparities, National Institute on Deafness and Other Communication Disorders, National Institute of Dental and Craniofacial Research, National Institute of Diabetes and Digestive and Kidney Diseases, National Institute of Neurological Disorders and Stroke, NIH Institution-Office of Dietary Supplements.
ECHO-SOL was supported by R01 HL104199 (to Dr. Rodriguez). R01 DK102932 (to Dr. Demmer) also provided partial support for this manuscript.
Abbreviations
- T2DM
Type 2 Diabetes Mellitus
- HCHS/SOL
Hispanic Community Health Study/Study of Latinos
- ECHO-SOL
echocardiographic ancillary study to the Hispanic Community Health Study/Study of Latinos
Footnotes
DISCLOSURES
None.
REFERENCES
- 1.Mozaffarian D, Benjamin EJ, Go AS, Arnett DK, Blaha MJ, Cushman M, de Ferranti S, Despres JP, Fullerton HJ, Howard VJ, Huffman MD, Judd SE, Kissela BM, Lackland DT, Lichtman JH, Lisabeth LD, Liu S, Mackey RH, Matchar DB, McGuire DK, Mohler ER, 3rd, Moy CS, Muntner P, Mussolino ME, Nasir K, Neumar RW, Nichol G, Palaniappan L, Pandey DK, Reeves MJ, Rodriguez CJ, Sorlie PD, Stein J, Towfighi A, Turan TN, Virani SS, Willey JZ, Woo D, Yeh RW, Turner MB, American Heart Association Statistics C and Stroke Statistics S Heart disease and stroke statistics--2015 update: a report from the American Heart Association. Circulation. 2015;131:e29–322. doi: 10.1161/CIR.0000000000000152. [DOI] [PubMed] [Google Scholar]
- 2.Gerber Y, Weston SA, Redfield MM, Chamberlain AM, Manemann SM, Jiang R, Killian JM, Roger VL. A contemporary appraisal of the heart failure epidemic in Olmsted County, Minnesota, 2000 to 2010. JAMA Intern Med. 2015;175:996–1004. doi: 10.1001/jamainternmed.2015.0924. [DOI] [PMC free article] [PubMed] [Google Scholar]
- 3.Lloyd-Jones D, Adams R, Carnethon M, De Simone G, Ferguson TB, Flegal K, Ford E, Furie K, Go A, Greenlund K, Haase N, Hailpern S, Ho M, Howard V, Kissela B, Kittner S, Lackland D, Lisabeth L, Marelli A, McDermott M, Meigs J, Mozaffarian D, Nichol G, O'Donnell C, Roger V, Rosamond W, Sacco R, Sorlie P, Stafford R, Steinberger J, Thom T, Wasserthiel-Smoller S, Wong N, Wylie-Rosett J, Hong Y. Heart disease and stroke statistics--2009 update: a report from the American Heart Association Statistics Committee and Stroke Statistics Subcommittee. Circulation. 2009;119:480–6. doi: 10.1161/CIRCULATIONAHA.108.191259. [DOI] [PubMed] [Google Scholar]
- 4.Devereux RB, Roman MJ, Paranicas M, O'Grady MJ, Lee ET, Welty TK, Fabsitz RR, Robbins D, Rhoades ER, Howard BV. Impact of diabetes on cardiac structure and function: the strong heart study. Circulation. 2000;101:2271–6. doi: 10.1161/01.cir.101.19.2271. [DOI] [PubMed] [Google Scholar]
- 5.From AM, Scott CG, Chen HH. The development of heart failure in patients with diabetes mellitus and pre-clinical diastolic dysfunction a population-based study. J Am Coll Cardiol. 2010;55:300–5. doi: 10.1016/j.jacc.2009.12.003. [DOI] [PMC free article] [PubMed] [Google Scholar]
- 6.Bertoni AG, Goff DC, Jr., D'Agostino RB, Jr., Liu K, Hundley WG, Lima JA, Polak JF, Saad MF, Szklo M, Tracy RP, Siscovick DS. Diabetic cardiomyopathy and subclinical cardiovascular disease: the Multi-Ethnic Study of Atherosclerosis (MESA) Diabetes Care. 2006;29:588–94. doi: 10.2337/diacare.29.03.06.dc05-1501. [DOI] [PubMed] [Google Scholar]
- 7.Sorlie PD, Aviles-Santa LM, Wassertheil-Smoller S, Kaplan RC, Daviglus ML, Giachello AL, Schneiderman N, Raij L, Talavera G, Allison M, Lavange L, Chambless LE, Heiss G. Design and implementation of the Hispanic Community Health Study/Study of Latinos. Ann Epidemiol. 2010;20:629–41. doi: 10.1016/j.annepidem.2010.03.015. [DOI] [PMC free article] [PubMed] [Google Scholar]
- 8.Lavange LM, Kalsbeek WD, Sorlie PD, Aviles-Santa LM, Kaplan RC, Barnhart J, Liu K, Giachello A, Lee DJ, Ryan J, Criqui MH, Elder JP. Sample design and cohort selection in the Hispanic Community Health Study/Study of Latinos. Ann Epidemiol. 2010;20:642–9. doi: 10.1016/j.annepidem.2010.05.006. [DOI] [PMC free article] [PubMed] [Google Scholar]
- 9.Rodriguez CJ, Dharod A, Allison MA, Shah SJ, Hurwitz B, Bangdiwala SI, Gonzalez F, Kitzman D, Gillam L, Spevack D, Dadhania R, Langdon S, Kaplan R. Rationale and Design of the Echocardiographic Study of Hispanics/Latinos (ECHO-SOL) Ethnicity & disease. 2015;25:180–6. [PMC free article] [PubMed] [Google Scholar]
- 10.Daviglus ML, Talavera GA, Aviles-Santa ML, Allison M, Cai J, Criqui MH, Gellman M, Giachello AL, Gouskova N, Kaplan RC, LaVange L, Penedo F, Perreira K, Pirzada A, Schneiderman N, Wassertheil-Smoller S, Sorlie PD, Stamler J. Prevalence of major cardiovascular risk factors and cardiovascular diseases among Hispanic/Latino individuals of diverse backgrounds in the United States. JAMA. 2012;308:1775–84. doi: 10.1001/jama.2012.14517. [DOI] [PMC free article] [PubMed] [Google Scholar]
- 11.Schneiderman N, Llabre M, Cowie CC, Barnhart J, Carnethon M, Gallo LC, Giachello AL, Heiss G, Kaplan RC, LaVange LM, Teng Y, Villa-Caballero L, Aviles-Santa ML. Prevalence of diabetes among Hispanics/Latinos from diverse backgrounds: the Hispanic Community Health Study/Study of Latinos (HCHS/SOL) Diabetes Care. 2014;37:2233–9. doi: 10.2337/dc13-2939. [DOI] [PMC free article] [PubMed] [Google Scholar]
- 12.Nagueh SF, Appleton CP, Gillebert TC, Marino PN, Oh JK, Smiseth OA, Waggoner AD, Flachskampf FA, Pellikka PA, Evangelisa A. Recommendations for the evaluation of left ventricular diastolic function by echocardiography. Eur J Echocardiogr. 2009;10:165–93. doi: 10.1093/ejechocard/jep007. [DOI] [PubMed] [Google Scholar]
- 13.Lang RM, Badano LP, Mor-Avi V, Afilalo J, Armstrong A, Ernande L, Flachskampf FA, Foster E, Goldstein SA, Kuznetsova T, Lancellotti P, Muraru D, Picard MH, Rietzschel ER, Rudski L, Spencer KT, Tsang W, Voigt JU. Recommendations for cardiac chamber quantification by echocardiography in adults: an update from the American Society of Echocardiography and the European Association of Cardiovascular Imaging. J Am Soc Echocardiogr. 2015;28:1–39. doi: 10.1016/j.echo.2014.10.003. e14. [DOI] [PubMed] [Google Scholar]
- 14.Mehta H, Armstrong A, Swett K, Shah SJ, Allison MA, Hurwitz B, Bangdiwala S, Dadhania R, Kitzman DW, Arguelles W, Lima J, Youngblood M, Schneiderman N, Daviglus ML, Spevack D, Talavera GA, Raisinghani A, Kaplan R, Rodriguez CJ. Burden of Systolic and Diastolic Left Ventricular Dysfunction Among Hispanics in the United States: Insights From the Echocardiographic Study of Latinos. Circ Heart Fail. 2016:9. doi: 10.1161/CIRCHEARTFAILURE.115.002733. [DOI] [PMC free article] [PubMed] [Google Scholar]
- 15.Ommen SR, Nishimura RA, Appleton CP, Miller FA, Oh JK, Redfield MM, Tajik AJ. Clinical utility of Doppler echocardiography and tissue Doppler imaging in the estimation of left ventricular filling pressures - A comparative simultaneous Doppler-Catheterization study. Circulation. 2000;102:1788–1794. doi: 10.1161/01.cir.102.15.1788. [DOI] [PubMed] [Google Scholar]
- 16.Klotz S, Dickstein ML, Burkhoff D. A computational method of prediction of the end-diastolic pressure-volume relationship by single beat. Nat Protoc. 2007;2:2152–8. doi: 10.1038/nprot.2007.270. [DOI] [PubMed] [Google Scholar]
- 17.Lang RM, Bierig M, Devereux RB, Flachskampf FA, Foster E, Pellikka PA, Picard MH, Roman MJ, Seward J, Shanewise JS, Solomon SD, Spencer KT, Sutton MS, Stewart WJ. Recommendations for chamber quantification: a report from the American Society of Echocardiography's Guidelines and Standards Committee and the Chamber Quantification Writing Group, developed in conjunction with the European Association of Echocardiography, a branch of the European Society of Cardiology. J Am Soc Echocardiogr. 2005;18:1440–63. doi: 10.1016/j.echo.2005.10.005. [DOI] [PubMed] [Google Scholar]
- 18.Matthews DR, Hosker JP, Rudenski AS, Naylor BA, Treacher DF, Turner RC. Homeostasis model assessment: insulin resistance and beta-cell function from fasting plasma glucose and insulin concentrations in man. Diabetologia. 1985;28:412–9. doi: 10.1007/BF00280883. [DOI] [PubMed] [Google Scholar]
- 19.Rodriguez CJ, Cai J, Swett K, Gonzalez HM, Talavera GA, Wruck LM, Wassertheil-Smoller S, Lloyd-Jones D, Kaplan R, Daviglus ML. High Cholesterol Awareness, Treatment, and Control Among Hispanic/Latinos: Results From the Hispanic Community Health Study/Study of Latinos. J Am Heart Assoc. 2015;4:e001867. doi: 10.1161/JAHA.115.001867. [DOI] [PMC free article] [PubMed] [Google Scholar]
- 20.Lee M, Gardin JM, Lynch JC, Smith VE, Tracy RP, Savage PJ, Szklo M, Ward BJ. Diabetes mellitus and echocardiographic left ventricular function in free-living elderly men and women: The Cardiovascular Health Study. Am Heart J. 1997;133:36–43. doi: 10.1016/s0002-8703(97)70245-x. [DOI] [PubMed] [Google Scholar]
- 21.Galderisi M, Anderson KM, Wilson PW, Levy D. Echocardiographic evidence for the existence of a distinct diabetic cardiomyopathy (the Framingham Heart Study) Am J Cardiol. 1991;68:85–9. doi: 10.1016/0002-9149(91)90716-x. [DOI] [PubMed] [Google Scholar]
- 22.Rutter MK, Parise H, Benjamin EJ, Levy D, Larson MG, Meigs JB, Nesto RW, Wilson PW, Vasan RS. Impact of glucose intolerance and insulin resistance on cardiac structure and function: sex-related differences in the Framingham Heart Study. Circulation. 2003;107:448–54. doi: 10.1161/01.cir.0000045671.62860.98. [DOI] [PubMed] [Google Scholar]
- 23.Skali H, Shah A, Gupta DK, Cheng S, Claggett B, Liu J, Bello N, Aguilar D, Vardeny O, Matsushita K, Selvin E, Solomon S. Cardiac structure and function across the glycemic spectrum in elderly men and women free of prevalent heart disease: the Atherosclerosis Risk In the Community study. Circ Heart Fail. 2015;8:448–54. doi: 10.1161/CIRCHEARTFAILURE.114.001990. [DOI] [PMC free article] [PubMed] [Google Scholar]
- 24.Markus MR, Stritzke J, Wellmann J, Duderstadt S, Siewert U, Lieb W, Luchner A, Doring A, Keil U, Schunkert H, Hense HW. Implications of prevalent and incident diabetes mellitus on left ventricular geometry and function in the ageing heart: the MONICA/KORA Augsburg cohort study. Nutr Metab Cardiovasc Dis. 2011;21:189–96. doi: 10.1016/j.numecd.2009.09.005. [DOI] [PubMed] [Google Scholar]
- 25.Piccini JP, Klein L, Gheorghiade M, Bonow RO. New insights into diastolic heart failure: role of diabetes mellitus. Am J Med. 2004;116(Suppl 5A):64S–75S. doi: 10.1016/j.amjmed.2003.10.021. [DOI] [PubMed] [Google Scholar]
- 26.Bell DS. Heart failure: the frequent, forgotten, and often fatal complication of diabetes. Diabetes Care. 2003;26:2433–41. doi: 10.2337/diacare.26.8.2433. [DOI] [PubMed] [Google Scholar]
- 27.Borlaug BA. The pathophysiology of heart failure with preserved ejection fraction. Nature reviews Cardiology. 2014;11:507–15. doi: 10.1038/nrcardio.2014.83. [DOI] [PubMed] [Google Scholar]
- 28.Lindman BR, Davila-Roman VG, Mann DL, McNulty S, Semigran MJ, Lewis GD, de las Fuentes L, Joseph SM, Vader J, Hernandez AF, Redfield MM. Cardiovascular phenotype in HFpEF patients with or without diabetes: a RELAX trial ancillary study. J Am Coll Cardiol. 2014;64:541–9. doi: 10.1016/j.jacc.2014.05.030. [DOI] [PMC free article] [PubMed] [Google Scholar]
- 29.Narayan KM, Boyle JP, Thompson TJ, Sorensen SW, Williamson DF. Lifetime risk for diabetes mellitus in the United States. JAMA : the journal of the American Medical Association. 2003;290:1884–90. doi: 10.1001/jama.290.14.1884. [DOI] [PubMed] [Google Scholar]
- 30.Harris M, Flegal K, Cowie C, Eberhardt M, Goldstein D, Little R, Wiedmeyer H, Byrd-Holt D. Prevalence of diabetes, impaired fasting glucose, and impaired glucose tolerance in U.S. adults. The Third National Health and Nutrition Examination Survey, 1988-1994. Diabetes Care. 1998;21:518–524. doi: 10.2337/diacare.21.4.518. [DOI] [PubMed] [Google Scholar]
- 31.Bella JN, Palmieri V, Roman MJ, Liu JE, Welty TK, Lee ET, Fabsitz RR, Howard BV, Devereux RB. Mitral ratio of peak early to late diastolic filling velocity as a predictor of mortality in middle-aged and elderly adults: the Strong Heart Study. Circulation. 2002;105:1928–33. doi: 10.1161/01.cir.0000015076.37047.d9. [DOI] [PubMed] [Google Scholar]
- 32.Kane GC, Karon BL, Mahoney DW, Redfield MM, Roger VL, Burnett JC, Jr., Jacobsen SJ, Rodeheffer RJ. Progression of left ventricular diastolic dysfunction and risk of heart failure. JAMA. 2011;306:856–63. doi: 10.1001/jama.2011.1201. [DOI] [PMC free article] [PubMed] [Google Scholar]
- 33.Lam CS, Donal E, Kraigher-Krainer E, Vasan RS. Epidemiology and clinical course of heart failure with preserved ejection fraction. Eur J Heart Fail. 2011;13:18–28. doi: 10.1093/eurjhf/hfq121. [DOI] [PMC free article] [PubMed] [Google Scholar]
- 34.Aurigemma GP, Gottdiener JS, Shemanski L, Gardin J, Kitzman D. Predictive value of systolic and diastolic function for incident congestive heart failure in the elderly: the cardiovascular health study. J Am Coll Cardiol. 2001;37:1042–8. doi: 10.1016/s0735-1097(01)01110-x. [DOI] [PubMed] [Google Scholar]
- 35.Frigerio M, Oliva F, Turazza FM, Bonow RO. Prevention and management of chronic heart failure in management of asymptomatic patients. Am J Cardiol. 2003;91:4F–9F. doi: 10.1016/s0002-9149(02)03335-0. [DOI] [PubMed] [Google Scholar]
Associated Data
This section collects any data citations, data availability statements, or supplementary materials included in this article.


