Abstract
The mechanical properties of arteries are implicated in a wide variety of cardiovascular diseases, many of which are expected to involve a strong spatial variation in properties that can be depicted by diagnostic imaging. A pulse wave inverse problem (PWIP) is presented, which can produce spatially resolved estimates of vessel compliance from ultrasound measurements of the vessel wall displacements. The 1D equations governing pulse wave propagation in a flexible tube are parameterized by the spatially varying properties, discrete cosine transform components of the inlet pressure boundary conditions, viscous loss constant and a resistance outlet boundary condition. Gradient descent optimization is used to fit displacements from the model to the measured data by updating the model parameters. Inversion of simulated data showed that the PWIP can accurately recover the correct compliance distribution and inlet pressure under realistic conditions, even with severe simulated measurement noise. Silicone phantoms with known compliance contrast were imaged with a clinical ultrasound system .The PWIP produced spatially and quantitatively accurate maps of the phantom compliance compared to independent static property estimates, and the known locations of stiff inclusions (which were as small as 7mm). The PWIP is necessary for these phantom experiments as the spatiotemporal resolution, measurement noise and compliance contrast does not allow accurate tracking of the pulse wave velocity using traditional approaches (e.g. 50% upstroke markers). Results from simulated data suggest reflections generated from material interfaces may negatively affect wave velocity estimates, whereas these reflections are accounted for in the PWIP and do not cause problems.
Introduction
The stiffness of arteries determines the load on the left ventricle during systolic ejection, and has been implicated in a wide range of cardiovascular complications (Messas et al 2013), including hypertension (Safar et al 2003), aging (Mitchell et al 2004, Lee and Oh 2010), arteriosclerosis (De Korte et al 2011) and scleroderma (Cheng et al 2003, Soltész et al 2009). Arterial stiffness changes may be a contributing factor to the progression, morbidity and mortality of many of these conditions (Zieman et al 2005, Sutton-Tyrrell et al 2005, Hansen et al 2006), therefore, accurate assessment can help to guide treatment and enable early intervention.
Independent mechanical testing of arteries is only possible ex-vivo, and is subject to biases introduced by sample preparation and loading conditions. For example, microindentation measurements have been shown to vary significantly depending on the loading parameters and sample preparation (values ranging from 6.5 – 21,000kPa have been reported). Difficulties have also been reported determining the point of contact with the tissue (McKee et al 2011). Tensile testing can be more representative of in vivo loading and generally produces higher values than indentation; however, sample preparation can still cause variability in results (Shahmirzadi et al 2013). Static pressure testing of ex-vivo arteries represents in vivo conditions more closely, and has been used in mouse aortas to demonstrate adaptive remodeling due to reduced elastic content (Wagenseil et al 2005).
An alternative evaluation of arterial stiffness in vivo can be achieved by measuring the arterial pulse wave velocity (PWV) (Asmar et al 1995, Blacher et al 1999, Hansen et al 2006, Vappou et al 2010). The heart pushes incompressible blood through flexible arteries, causing a travelling expansion wave through the fluid in the artery, where the propagation speed, cmk, is related to the vessel properties through the Moens-Korteweg (MK) equation
| (1) |
where r, h, v and E are the radius, thickness, Poisson ratio and circumferential elastic modulus of the blood vessel, respectively, and ρ is the density of blood. Applanation tonometry takes temporally synchronized measurements of the pulse pressure at two locations (commonly the femoral and carotid arteries), then uses the delay in the pulse and distance between the sites to estimate the average PWV (McDonald 1968, Tomiyama et al 2003). Empirically derived transfer functions are used to compare pressure waveforms measured at different sites (Chen et al 1997). These global estimates of the pulse wave velocity have become an established indicator of arterial stiffness and are used clinically in a variety of applications.
Many common vascular pathologies such as atherosclerotic plaques and abdominal aortic aneurysms (AAA’s) cause focal changes in vessel properties, so a more localized vessel property estimate is required to accurately characterize the disease. Plaques often remain asymptomatic unless rupture occurs, leading to serious complications including myocardial infarction, stenosis and strokes. AAA’s can rupture which leads rapidly to death via exsanguination. Estimation of spatially varying arterial properties may allow the risk of plaque and aneurysm rupture to be predicted more precisely, thus reducing the number of unnecessary surgeries on stable cases and ensuring that vulnerable cases can be surgically repaired before rupture.
Ultrasound pulse wave imaging (PWI) uses motion tracking to image the vessel wall displacement resulting from the passage of the arterial pressure wave at framerates of 500–8000Hz. A trace along the vessel wall gives the temporal wall displacement waveform at each scan line(Vappou et al 2010). Tissue Doppler methods may also be used to produce similar data (Messas et al 2013). The wave arrival time at each spatial location is determined by tracking a feature on the waveform, which allows the PWV to be estimated by fitting a straight line to the arrival times across the width of the US probe (~35mm). Piecewise fitting has been proposed to estimate PWV at scales smaller than the US probe dimensions to detect changes in stiffness (Apostolakis et al 2015). In these approaches, data from only one frame per scan line is actually used to estimate the PWV, where every frame carries information about the vessel properties which could be utilized. High spatiotemporal data resolution is also required to capture small-scale structures and higher wavespeeds, which is not achievable on the majority of conventional clinical ultrasound scanners. Additionally, if there is a change in vessel properties within the imaged region, reflections can be generated which change the pulse wave profile and make it difficult to identify the correct feature on the wave across scan lines. In this paper, we address these issues through a model-based inverse problem which fits unknown parameters from a computational model of pulse wave propagation (mechanical properties and unknown boundary conditions) to the full set of measured PWI data (spatiotemporal wall displalcements along the vessel wall).
Numerical simulation of pulse waves in 3D is computationally challenging, requiring a 3D fluid-structure interaction (FSI) model such as the coupled Eulerian-Lagrangian method (Shahmirzadi et al 2012). A single solution from these 3D FSI models takes many hours, which is infeasible for an inverse approach. This work uses a much simpler 1D model which can be rapidly solved, and still captures the important reflection and waveform changes due to heterogeneities.
Methods
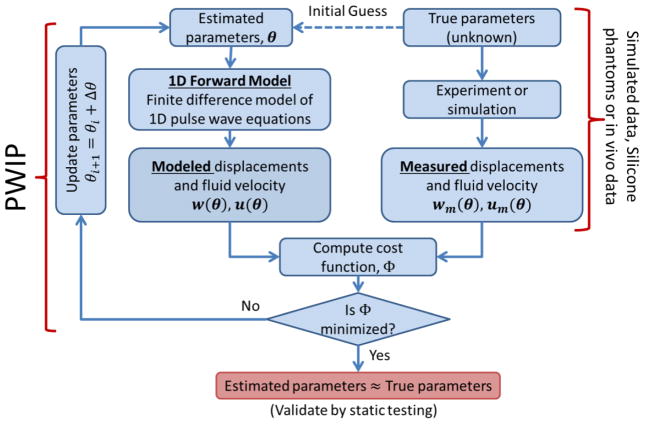
Ultrasound imaging can provide measurements of the incremental vessel wall displacement along a ~30mm field of view. Plane wave ultrasound imaging with beamforming allows a framerate of up to 8000 Hz to be achieved with 128 scan lines, which corresponds to 1,024,000 wall displacement measurements per second, making it an ideal application for a model-fitting inverse problem. A schematic of the process for pulse wave imaging is given in figure 1. In an experiment, wall displacements and/or fluid velocities resulting from the pulsatile flow are recorded, which carry information about the unknown parameters of interest (in this case, the vessel stiffness). An estimate of these unknown parameters is then used in a parameterized computational model to produce displacements and velocities analogous to the measured data, and a cost function is evaluated to determine the mismatch between the model and measurements. The parameters are then iteratively updated until the cost function is minimized. Assuming the model is a reasonably good match to the experimental system, the final model parameters should be a good estimate of the true parameters. Simulated data sampled at a typical measurement resolution can be used in place of experimental data to verify that the algorithm works under ideal conditions, and investigate the sensitivity of the algorithm to conditions such as noise or changes in resolution.
Figure 1.
Schematic of the pulse wave inverse problem (PWIP) process, where a discretized set of unknown properties, θ, is fitted to spatiotemporal vessel wall displacement and/or blood velocity data. These data can be generated through simulation to investigate performance under ideal conditions, from phantom experiments to validate accuracy in a controllable system, or from in-vivo examinations of living subjects.
1D Forward Model
The equations governing wave propagation in a 1D flexible tube are (Fung 2013, van de Vosse and Stergiopulos 2011):
| (2a) |
| (2b) |
Here, A is the cross-sectional area of the tube, u is the fluid velocity, P is the fluid pressure, ρ is the fluid density and KR is the viscous resistance per unit length of the tube. Assumptions in this model include negligible radial velocity and a flat velocity profile, which is reasonable for arterial flow in many cases (Sherwin et al 2003). Assuming u is much smaller than the pulse wave velocity gives a linearized model,
| (3a) |
| (3b) |
Equation 2 can be solved without the small u assumption (Matthys et al 2007, Sherwin et al 2003), which would be advantageous if temporally registered blood velocity and wall displacements are available, for example through simultaneous pulse doppler and PWI wall displacement measurements. Currently, we only have incremental wall displacement measurements so we use the linearized system in equation 3 for simplicity. We then assume that the inertial and viscous forces in the vessel wall are small (which is reasonable for larger vessels (Nichols and O’Rourke 2005)), so that the vessel area depends linearly on the pressure alone,
| (4) |
where Ao is the vessel area at a reference pressure, and kp is known as the vessel compliance. Assuming small changes in area (Ao ≫ kpP) and substituting equation 4 into equation 3 gives the final set of equations
| (5a) |
| (5b) |
The spatial coordinate along the vessel axis, x, and temporal dimension, t, are discretized to solve for u(x, t) and P(x, t) using an implicit 4-point primitive finite difference method which maintains second order accuracy in both x and t (Lynch 2005). Initial conditions are u(x, 0) = 0 and P(x, 0) = 0, which requires an appropriate start point in the cardiac cycle where no pulse waves are travelling through the region of interest (ROI) to be selected. The inlet boundary condition (BC) is a fixed pressure as a function of time, P(0, t) = fp(t). The outlet BC can be a prescribed pressure P(L, t) = PL(t), a resistance to flow, u(L,t) = RP(L,t), or some other form of BC such as a generalized Windkessel BC (Vignon and Taylor 2004). The compliance, kp, is a function of the vessel cross-section and elastic modulus, and is allowed to vary spatially along the artery as N linear piecewise segments in a region of interest between two points xo and xN.
| (6) |
Note that the number of unknown property values is independent of the measurement and finite difference resolution to allow control over the ratio of measurements to unknowns (McGarry et al 2012). Because 2D ultrasound imaging only allows wall displacement estimates of the top and bottom wall, simplifying assumptions must be made to relate the wall displacement increment, Δ w, from kp and change in pressure Δ P. The general relationship is
| (7) |
where Gf is a constant for each vessel cross-section and is a function of the geometry and the relative stiffness distribution over the cross-section. In the absence of 3D data, we must assume a homogeneous circular vessel cross-section with radius, r, and constant Young’s modulus and thickness, such that a small vessel wall displacement increment, Δ w , gives a change in area, ΔA = kp Δ P ≈ 2πrΔw, therefore,
| (8) |
The model w is then sampled at the measurement timepoints and spatial locations to generate incremental wall displacements consistent with the experimental parameters for use in the inverse problem.
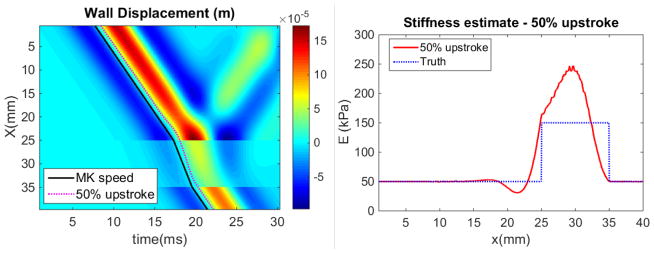
Wave reflection in the 1D forward model was demonstrated using a Ricker wavelet inlet BC and zero pressure outlet BC to produce a simulated pulse wave passing through a 10mm, 300% contrast increased stiffness inclusion. The result of PWV estimation using wavefront tracking in the presence of reflections was demonstrated by computing the ‘50% upstroke’ at each spatial position, which is where the displacement reaches halfway between the lowest and highest values. cmk was then estimated based on the local slope of the 50% upstroke markers and used to estimate the local Young’s modulus using equation 1, which was compared to the prescribed values from the simulation.
Pulse Wave Inverse Problem (PWIP)
The unknown quantities in the forward model are the N + 1 unknown compliance values, , the inlet pressure BC, fp(t), the outlet resistance, R, and the viscous resistance, KR. These are parameterized into a vector
| (9) |
where Pbc0(j) is the jth of No total discrete cosine transform (DCT-II) components of fp, and PbcL(j) is the jth of NL total outlet BC parameters. We chose the DCT-II because the implied symmetry conditions provide an efficient parameterization of a pressure BC function with non-zero start and end points, and it uses real-valued parameters to maintain simplicity. We keep a manageable number of unknowns by using the minimum number of DCT components, NL, which is necessary to adequately represent the inlet pulse. NL depends on the smoothness and length of the inlet pulse. In this work we use a resistance outlet BC, so NL = 1 and PbcL(1) = R. Given a value of θ , the model wall displacements and fluid velocities after solution of the forward problem are denoted by w(θ) and u(θ), respectively. The inverse problem involves fitting the model to the measured wall displacements, wm, and blood velocities, um, using the conjugate gradient method to minimize the objective function,
| (10) |
by iteratively updating θ. . In the above eqaution, αu and αTK are empirical weighting factors to balance the relative importance of each term. In our initial experiments, we do not have temporally registered measurements of u, so αu = 0. The final term in equation (10) implements Tikhonov regularization (i is the current iteration), and ensures that step sizes are not too large. Currently, the required terms of for the conjugate gradient method are computed by finite difference. More efficient strategies are available which require fewer forward solutions of the model and have the potential to significantly speed up the inverse problem (Lynch 2005). Once the search direction is determined, an Armijo linesearch (Zhang et al 2006) is used to efficiently and reliably select an appropriate step size. Maximum and minimum bounds are enforced on kp, KR and R after every θ update to ensure they remain positive and in a realistic range (less than 10x the initial estimate). To speed up convergence in practice, an extra redundant degree of freedom, C0, is included in θ to provide an efficient path for the global average pulse wave velocity to change without affecting the average displacement amplitude, i.e. C0 scales all kp and Pbc0 values.
Initial guesses for kp, KR and R are assigned as the best available estimate from the literature or through experience, and the initial guess for the inlet pressure BC is computed from wm(0,t) by numerically integrating equation 8 and taking the minimum number of DCT modes required to adequately represent the data (16 is usually sufficient). The number of kp values is chosen based on the data resolution and quality, and the expected scale of spatial variation. Iterative property updates continued until θ updates reached less than 0.01% for 3 consecutive iterations. Typical solution time for 100 iterations of the inverse problem is on the order of 8 minutes on a single 2.4GHz processor.
Inversions of simulated data
The performance of the PWIP algorithm was first tested through simulated data with added noise. The simulations were designed to replicate conditions encountered in the phantoms. First, a high resolution simulation using the 1D forward model was run representing a circular tube of length 170mm, radius 4mm, thickness 2.2mm and KR = 10s−1. The Young’s modulus profile of the tube was specified to control kp; sinusoidal variation with a 10mm region of 3x ‘normal’ stiffness was used, with some added random variation, as illustrated in figure 2. A fixed pressure boundary condition taken from a mouse cardiac pressure reading was applied to the inlet, along with a resistance outlet boundary condition with R = 5 × 10⁻⁴ms−1Pa−1. One full cardiac cycle was allowed before sampling the model wall displacements across a typical ultrasound field of view (37mm) according to a typical PWI lateral sampling using a commercial 5 MHz linear array (ATL L7-4, ATL Ultrasound, Bothell, WA) (Δ x = 0.3mm) and at a temporal sampling rate easily achievable using plane wave acquisitions (Δ t = 1ms). Figure 2 shows the Young’s modulus profile, and sampling of the full simulation to generate synthetic PWI data. The stability of the inversion was tested by adding a severe amount of simulated additive Gaussian noise to the simulated data (200% of mean value, correlated at a scale of 20 temporal measurements). The simulated data was processed with the PWIP algorithm in the same way as experimental data: The initial homogeneous guess of kp was chosen somewhere in the range of kp used to generate the simulated data, and the initial guess of the inlet pressure BC was computed by integrating equation (8) with the initial kp guess and the first line of sampled data, w(0, t).Because the sampling region is in the middle of the simulated geometry, the true inlet geometry and boundary conditions are not known, as will be the case for in vivo data. We allowed the inverse model to extend to the end of the tube, representing the nearest source of significant reflection (which would be a bifurcation in vivo, or the outlet fitting in a phantom system). The theoretical wavespeed is given in terms of the compliance by the Bramwell-Hill equation (Westenberg et al 2012),
Figure 2.
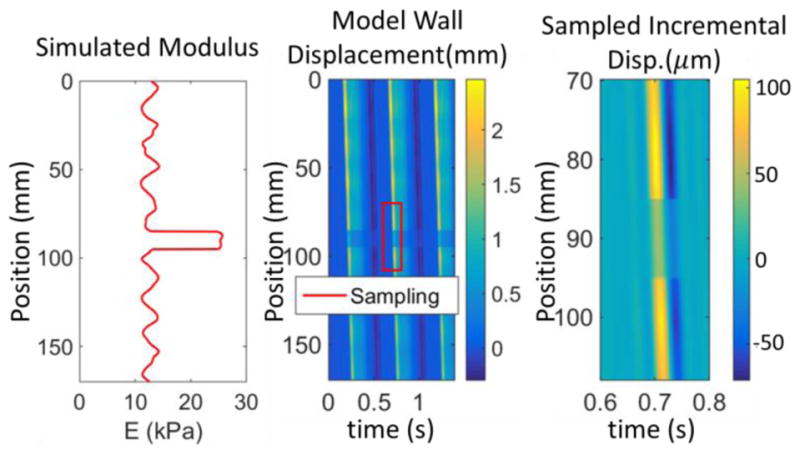
Sampling of synthetic PWI data to mimic experimental measurements. The colormaps represent the simulated wall displacements, where the center image is the full 170mm simulation with bounds representing the simulated ultrasound measurements indicated, and the right panel shows the sampled incremental displacement data.
| (11) |
The well-known Moens-Korteweg wavespeed (equation 1) is a special case of Bramwell-Hill for homogeneous cylindrical cross-sections.
Silicone phantom construction
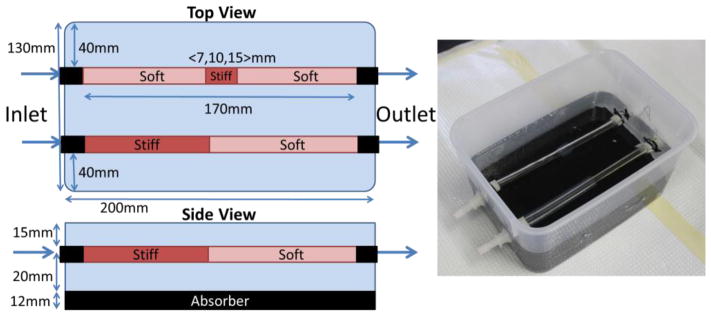
Room-temperature vulcanizing silicone gels were used to construct long-lasting vessel phantoms with spatially varying mechanical properties (Kashif et al 2013). A 240 mm concentric cylindrical mold comprised of a 12.5mm internal diameter acrylic tube and an 8 mm outside diameter acrylic rod was lightly coated with petroleum jelly to allow the phantoms to be extracted. The ‘soft’ material was 100% A341 silicone soft gel (Factor II, Lakeside AZ), and the ‘stiff’ mixture was 70% A341 and 30% LSR-05 silicone elastomer (Factor II, Lakeside AZ). 2% by weight silica powder was included as an ultrasound contrast agent. After mixing, 5 minutes of vacuum degassing prevented formation of air bubbles. The mold was held vertically and layers of soft or stiff material were introduced using a syringe and tube to avoid coating the portion of the mold used for subsequent layers with thin layers of silicone. Subsequent layers are ready to be poured after about an hour of curing time, and the layers naturally adhere strongly to each other. The phantoms were carefully extracted from the mold using extra petroleum jelly, and then mounted on fittings in a plastic container as illustrated in figure 3. The minimum amount of pretension required to keep the vessel phantoms straight in the finished phantom was applied. A very soft silicone background was constructed from 40% A341 gel and 60% Xiameter PMX-200 100CS silicone fluid (Dow Corning, Midland MI). No silica powder was included in the background because ultrasound speckle is not required outside of the vessel phantom. The vessel phantoms were first filled with water to maintain a circular profile and avoid floating while the background material was filled to approximately 15mm above the top surface of the vessel phantoms. Pulsatile flow of water through the phantoms was introduced using a peristaltic pump at approximately 4 Hz. A static circumferential pre-strain was produced by raising the height of the pump outlet reservoir to 50mm above the phantom.
Figure 3.
Dimensions and size of silicone vessel phantoms, and a photograph of the finished phantom. Two vessel phantoms were in each box, with four vessel phantoms used in total. Phantom 1 was half stiff and half soft, whereas phantoms 2, 3 and 4 had discrete stiff inclusions of size 15, 10 and 7mm, respectively.
Static testing as independent stiffness validation
The pressure-area relationship of the phantoms (represented by in equation 4) is a function of the vessel properties, pretension and the surrounding medium. Traditional tensile testing of small samples of each material fails to capture these effects, therefore, this study uses static inflation from a column of water, and vessel area measured with ultrasound to obtain independent measurements of kp under the same conditions as the PWIP experiments. The diameter of the phantom for water heights of 0–150mm in steps of 10 mm was measured with semi-automated segmentation software. Within this pressure range, the relationship between the radius, r, and static pressure, P, is approximately linear,
| (12) |
kpr was estimated by a linear fit, allowing kp to be computed as a simple function of phantom cross-sectional area
| (13) |
The estimated PWV, cstatic, , can be computed from kp though the Bramwell-Hill equation (11), and the effective elastic modulus of an unconstrained circular tube of thickness h is given by
| (14) |
Eeff is affected by the phantom properties, the properties of the surrounding medium and the boundary constraints, so comparison with compression testing of small samples (Kashif et al 2013) is not appropriate.
Ultrasound pulse wave imaging
Ultrasound RF signals were acquired across each inclusion using a Sonix RP system (Ultrasonix Medical Corporation, Burnaby, Canada) with a L14-5/38 linear array operating at 10 MHz (Luo et al 2012). The transducer was positioned so that the pulse wave propagated in the opposite direction to the beam sweeping, and the time delay of each line was compensated for during post processing (Li et al 2015). RF signals were collected in 1 s acquisitions and digitized at 20 MHz which covered 3–4 pulses of the peristaltic pump. The imaging depth was set at the minimum depth required to visualize both walls of the phantom, and the beam density was reduced to 31 elements to allow frame rates of 400–500 Hz, at which a pulse wave at 2.5m/s passes 5 elements per frame. Subsequently, the incremental axial displacements were estimated offline using a fast 1-D cross correlation method on the RF signals (Luo et al 2009). The anterior wall of the imaged phantoms was then manually segmented and the corresponding axial displacements were used to generate a spatio-temporal map of measured wall displacements depicting the anterior wall displacement waveform at each beam location in the imaged segment over time (Li et al 2013). Measurements were repeated 4 times for each phantom segment.
For the PWIP, the walls were manually segmented using B-mode images to determine the radius and thickness, and an estimated Young’s Modulus of 10kPa was used to provide an initial kp estimate. The initial estimate of R was 5 × 10⁻⁸ms−1Pa−1, and the initial estimate of KR was 120s−1. One PWIP was performed for each of the 4 sets of data with 3 of the primary pulse waves for each dataset used for the input wm data. The number of unknown kp values per dataset was 20, with each pulse represented by 16 DCT coefficients, giving 70 total unknown parameters. The resulting property estimates are displayed as the mean ± standard deviation of each spatial location across the 4 repeated acquisitions.
An initial PWIP experiment was also performed in the common carotid artery of a healthy 24 year old male. The same imaging system captured vessel wall displacements from two full cardiac cycles, and both the main pulse waves and dicrotic notches were supplied as measured data to the inverse problem, and 10 unknown kp v alues were estimated across the width of the transducer. A higher attenuation factor of τ = 20s−1 was assumed due to the higher viscosity of blood compared to the water used in the phantoms. The outlet of the finite difference model was 15mm past the end of the US transducer and a resistance BC with 3 × 10⁻⁴ms−1Pa−1 was applied as a rough approximation of the reflection from the carotid bifurcation. More sophisticated treatment of downstream reflection sites is possible and will likely improve accuracy; however, it is outside the scope of this study.
Results
A demonstration of the 1D forward model with a simple Ricker wavelet inlet BC and a 3x stiffness contrast inclusion between 25 and 35mm are shown in figure 4. The reflection from both ends of the inclusion is apparent in the wall displacement image, and the difference between the slopes of the black theoretical MK speed (equation 1) line and the magenta 50% upstroke is due to the change in wave profile from the reflection. The vessel stiffness estimated from the MK equation using a value of cmk computed from the local slope of the 50% upstroke makers is accurate in regions where the forward wave is separated from the reflection; however, errors occur where reflected and forward waves interact.
Figure 4.
Panel A: Forward model result for a Ricker wavelet inlet BC, where the colormap represents the wall displacement (m). Reflections are generated by the 3x increased stiffness inclusion between 25 and 35mm. Progress of a wave at the theoretical Moens-Korteweg (MK) speed is compared to the 50% upstroke markers commonly used to determine the PWV. Panel B: Stiffness estimated through equation (1) with cmk computed from piecewise fits to the 50% upstroke markers, compared to the true stiffness distribution used in the model.
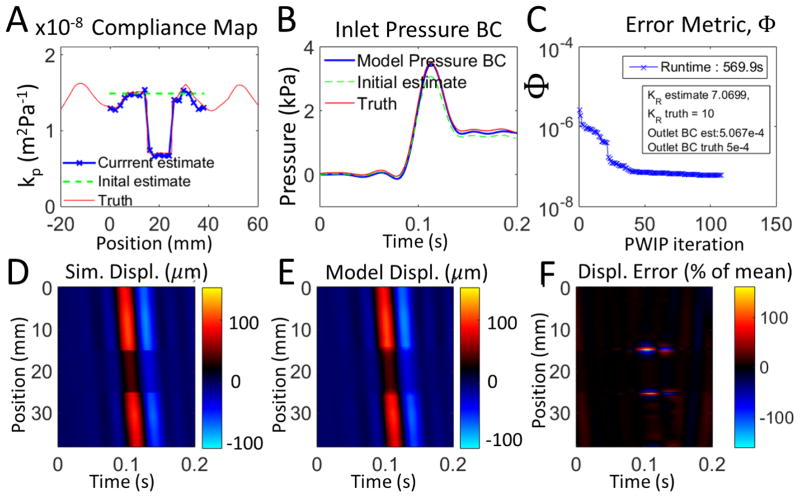
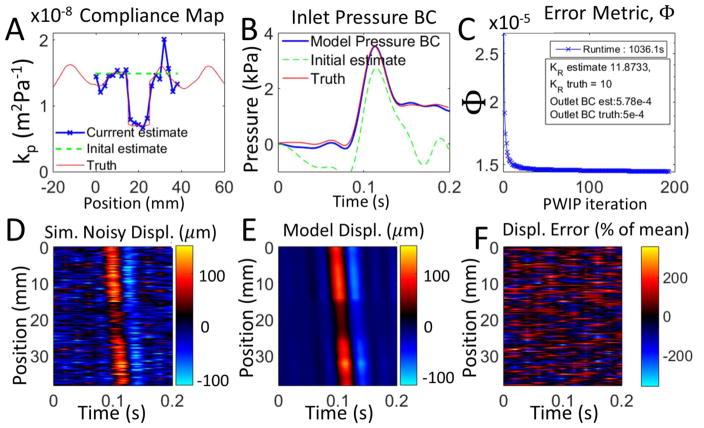
Inversions of simulated data are presented in figures 5 and 6. The PWIP algorithm was able to recover the correct compliance distribution, inlet and outlet BCs, and attenuation coefficient even under very high measurement noise, despite not knowing the true inlet location and BCs, or the properties of the tube outside of the limited imaging width. The pulse wave inverse problem handles the very high level of additive noise in Figure 6 and can still recover reasonably accurate estimates of kp and the inlet BCs.
Figure 5.
Inversion of synthetic PWI data with no added noise. Panel A shows that the PWIP recovered the compliance distribution specified in the simulation, and panel B shows that the correct inlet boundary condition was also recovered. Panel C shows the reduction in the error metric (Φ), as well as the recovered values of KR and the outlet BC, R. Panels D and E compare the simulated measured wall displacement data, um with the final model predictions from the PWIP, u(θ) (colormap in units of μm), and panel F shows the relative error between the spatiotemporal maps of panels D and E.
Figure 6.
Synthetic PWI data with a very high level of temporally correlated Gaussian noise (200% of mean, correlated at a scale of 20 temporal measurements). Panel A shows that the PWIP compliance distribution is reasonably close to what was specified in the simulation, and panel B shows that the correct inlet boundary condition was also recovered. Panel C shows the reduction in the error metric (Φ), as well as the recovered values of KR and the outlet BC, R. Panels D and E compare the simulated measured wall displacement data, um with the final model predictions from the PWIP, u(θ) (colormap in units ofμm), and panel F shows the relative error between the spatiotemporal maps of panels D and E.
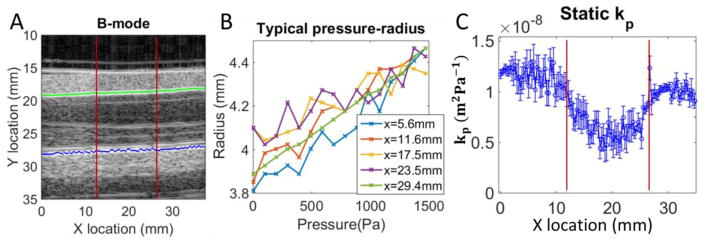
An example of the static phantom testing is shown in figure 7, with typical automatic wall segmentations and pressure diameter curves. Overall, the static testing procedure was successful, with errors occasionally occurring when the segmentation picked up an imaging artifact instead of the actual vessel wall. Sections of reliable data were averaged for each phantom material. The resulting compliance values are presented in Table 1, along with the resulting PWV and Eeff computed using equations 11 and 14.
Figure 7.
Example of static pressure testing for a phantom (15mm stiff inclusion centered at x=20mm). Panel A: B-mode image with typical result from automated segmentation algorithm (the green line is the identified top wall, and blue is the bottom wall). The inclusion boundaries are depicted with red lines. Panel B: Pressure radius relationship is approximately linear (a few representative locations are shown). Panel C: Compliance (kp) along the imaged portion, where the error bars are the 95% confidence interval on the linear fit to the pressure-radius curves.
Table 1.
Compliance, kp (m2Pa−1), static pulse wave velocity estimate, cstatic (ms−1), and the effective elastic modulus, Eeff(kPa), measured using static testing for each phantom. Values are given at a diameter of 8.7mm, which is approximately the diameter in the phantom PWI experiments. Eeff is the elastic modulus of a tube of the average phantom thickness (3.64mm) which gives the appropriate kp
| Material | kp ×108 | cstatic | Eeff |
|---|---|---|---|
| P1-Soft | 0.96±0.18 | 2.49 | 11.1 |
| P1-Stiff | 0.51±0.06 | 3.41 | 20.9 |
| P2-Soft | 1.04±0.15 | 2.39 | 10.2 |
| P2-Stiff | 0.64±0.11 | 3.06 | 16.7 |
| P3-Soft | 1.14±0.07 | 2.28 | 9.35 |
| P3-Stiff | 0.65±0.04 | 3.02 | 16.4 |
| P4-Soft | 1.23±0.07 | 2.20 | 8.69 |
| P4-Stiff | 0.79±0.09 | 2.74 | 13.4 |
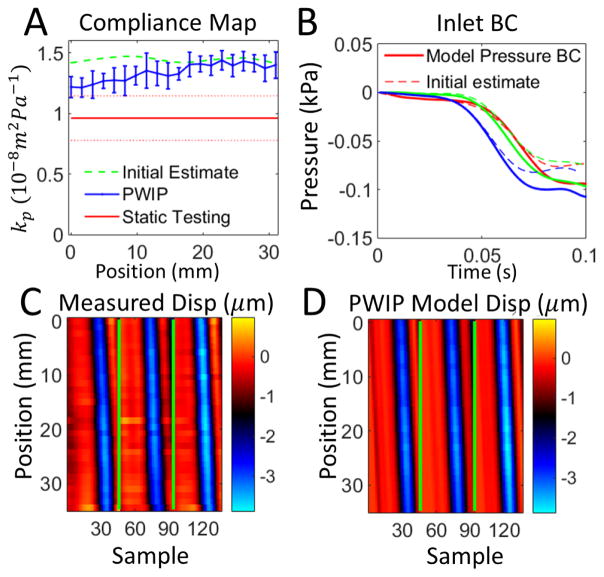
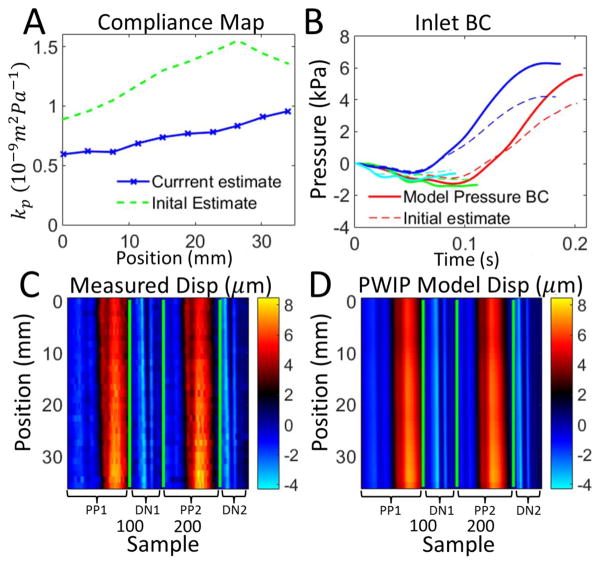
Figures 8–14 present the results of the PWI inverse problem in silicone phantoms imaged with the clinical Ultrasonix system. The PWIP performs reasonably well in all cases, panel A shows the correct position and size of the low compliance region is recovered in all cases. Quantitatively, PWIP kp values are in general slightly higher than static testing estimates. The inlet pressure boundary condition is not known a-priori without invasive measurements so it must be estimated from the data, and panel B shows that often significant adjustments are made to the best guess before the PWIP. Figure 15 presents an initial in vivo PWIP experiment in the common carotid artery of a healthy subject, and shows a slight increase of compliance in the downstream direction, from 0.59 × 10⁻⁹m2Pa−1 closest to the heart, to 0.96 × 10⁻⁹m2Pa−1 closest to the carotid bifurcation.
Figure 8.
PWIP results for a homogenous section of soft material from phantom 1. Panel A: The PWIP (blue) correctly identified constant compliance over this section, with an overestimation of around 40% compared to static testing. The error bars are the variation over 4 repeated measurements, and the dotted red lines indicate the uncertianty in the static kp estimate. Panel B: Estimate of inlet boundary conditions (solid) and the initial estimate (dotted) for the first dataset. Each of the three pulses is depicted by a different color. Panels C and D: Comparison of experimentally measured incremental wall dispalcement (C) and the final model wall dispalcements from the PWIP (D) for the first dataset (colormap in units of μm). The green lines separate each of the three pulses.
Figure 14.
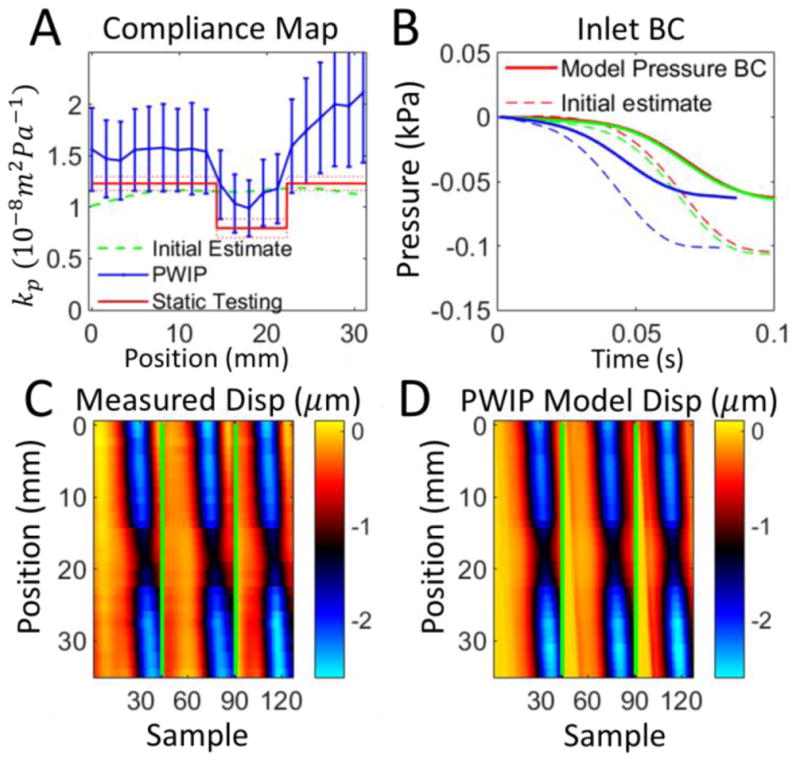
PWIP across the 7mm inclusion in Phantom 4. Panel A: Although the PWIP (blue) correctly identified the location, contrast and size of the smallest inclusion, the error bars in this case are much wider due to one of the 4 inversions producing a much higher compliance estimate than expected. Compliance is overrestimated by 30–80% compared to static testing. See the caption of figure 8 for an explanation of panels B–D.
Figure 15.
PWIP in the carotid artery of a healthy volunteer, using wall dispalcements from two primary pulses (PP1 and PP2) and two dicrotic notches (DN1 and DN2). Panel A: The PWIP (blue) indicates a gradual increase in compliance approaching the carotid bifurcation. Panel B: Inlet pressure BC estimate for each pulse. Panels C and D: Wall displacements for each primary pulse (PP1 and PP2), and dicrotic notch (DN1 and DN2). The final PWIP model dispalcements (D) were a good match to the measured displacements (C), despite the highly simplified reflection condition which was assumed at the carotid bifurcation.
Discussion
The pulse wave inverse problem introduced in this study was designed to recover accurate spatially varying vessel properties, utilizing as much of the ultrasound wall displacement data as possible to decrease framerate requirements and decrease sensitivity to measurement noise. The model-based strategy also accounts for internally generated reflections of the travelling pulse wave, which are difficult to filter out and can affect PWV estimation approaches. Reflections are generated where spatial variation of the pulse wave velocity is present, including clinically interesting pathologies such as plaques and aneurysms. Figure 4 provides a good illustration of the two types of reflections: the low → high stiffness interface produces a negative reflection from a positive forward wave (the red portion of the reflection can be traced to the upper material interface). The high → low stiffness interface produces a positive reflection from a positive forward (the blue portion of the reflection can be traced to the lower interface). This has the effect of shifting the wave to the right in the region above the inclusion, resulting in an apparent increase in PWV, and to the left in the lower portion of the inclusion, leading to an apparent decrease in PWV. The 1D inverse model used in the PWIP accounts for reflections because they are predicted by the governing PDEs – if a reflection due to a change in wave speed is present in the displacement data, the model fitting process will create compliance contrast in the appropriate position to recreate the reflection in the model.
Efforts were made to avoid the inverse crime (Kaipio and Somersalo 2007) for the inversions of simulated data in figures 5 and 6 by generating a high resolution simulation of the experimental setup, and only providing data to the PWIP that are attainable in practice. Results in figure 5 show that the method works as it should under ideal conditions, and figure 6 demonstrates that the PWIP can handle severe simulated measurement noise due to the large number of datapoints included in the objective function and the requirement of the model to be a valid solution of the pulse wave equations. The displacement error is very high in panel F because the large noise component does not resemble a valid solution of the 1D pulse wave equations, so is not able to be reproduced by the model. The model displacements in panel D closely resemble the noise-free displacements in panel D of figure 5, which demonstrates the favorable noise-filtering properties of model-based inverse problems.
The silicone phantom system developed for this work provided a stable platform to test the performance of PWIP. The material is inorganic and room temperature vulcanizing, so the properties do not change appreciably with time or cooling rate (unlike alternative materials such as PVA cryogel (Widman et al 2015)). Static inflation testing was successful in calculating in situ, independent estimates of the phantom properties which account for pre-tension and constraint of the surrounding material. The PWV is the most relevant parameter to consider when designing a vessel mimicking phantom system. Although the values of Eeff presented in table 1 are much lower than generally accepted values for arteries, the phantoms are substantially thicker than arteries to avoid breakage during manufacturing, which produced PWV values in the physiologic range.
The PWIP performed well in all phantom systems (figures 8–14), correctly identifying the cocontrast and location of all inclusions and stiffness interfaces. Quantitative accuracy was reasonably good; however, compliance was overestimated by around 40% in some cases. Reflections generated at stiffness interfaces do not cause problems because they are included in the model. The relatively low spatial and temporal resolution of data in this study was not a problem for the PWIP, as a large number of datapoints are included in the objective function. PWIP compliance estimates closer to the inlet are more accurate than those downstream because each compliance value has a strong effect on all downstream displacements in the model. One of the primary sources of error in the PWIP with the phantom system is selection of the start and end points of the data range. The phantom system does not dissipate energy very fast, and the fittings produce major reflections which bounce back and forth multiple times. In this work, a reasonably calm portion of data just before a major pulse was chosen as the start point for the model, however, there was still some violation of the zero initial velocity condition which can cause variability in the recovered properties. Using multiple pulses to generate a single set of properties helps to mitigate this error source. The slightly higher values of kp produced by the PWIP may be due to the flat velocity profile assumed to derive equation 1 (Sherwin et al 2003). In practice, the flow profile is dictated by the Womersly number (Loudon et al 2015) and results in a smaller effective area of fluid flow, which gives a slightly lower PWV and higher compliance (Stojadinovic et al 2015).
Adapting the PWIP to in vivo applications is relatively straightforward. There is a calm portion of the pulse cycle at the end of diastole which approximates the required zero velocity approximation to provide an appropriate starting point for the model. Some knowledge of downstream reflection sources may be required, or the data will need to be truncated before the major reflections re-enter the imaging volume. The initial result in figure 15 uses a highly simplified outlet boundary condition to represent the reflection originating at the carotid bifurcation, and the resulting compliance was within the range of 0.5 – 1.2 × 10⁻⁹m2Pa−1 given in the literature for healthy males (Reneman et al 1986). A more detailed investigation with independent compliance measurements is required to confirm if the increase in compliance approaching the carotid bifurcation predicted by the PWIP is correct, and will be the subject of a future study. The 1D model can be adapted to include a number of downstream branches (Sherwin et al 2003), where the approximate positions of bifurcations and vessel properties are taken from the literature. An additional benefit of the PWIP in vivo is that both kp and the inlet BC are estimated, providing simultaneous compliance mapping and pulse wave manometry (Vappou et al 2011).
Although this initial Matlab implementation takes approximately 8 minutes to run on a standard workstation, there are many improvements which could be made to achieve near real-time solution of the PWIP on an ultrasound scanner computer. Firstly, the spatial and temporal resolution of the forward problem can be optimized to balance fast runtime with accuracy. Decreasing spatial resolution by a factor of Rx will reduce the time to factorize the finite difference matrix by up to , and decreasing temporal resolution by a factor of Rt will reduce the finite difference timestepping in the forward problem by O(Rt). The limiting step in the current implementation is the finite difference evaluation of the gradient of the objective function, , which requires one forward solve per unknown parameter. Using a more efficient adjoint algorithm (Lynch 2005) or GPU accelerated finite difference approach will reduce the time to compute to that of a single forward problem, providing a further speedup factor of around 40. Finally, algorithmic improvements could reduce the number of iterative steps required to reach convergence. A combination of these improvements could easily reduce the runtime to less than 10 seconds on a scanner computer.
There are a number of future extensions to the PWIP which could prove useful. A more advanced pressure-area model, e.g. a numerical model of a 1D heterogeneous, viscoelastic thick-walled cylinder including inertia could replace equation 4 to reduce modeling errors from neglecting vessel wall inertia and viscosity. Additionally, if temporally registered blood velocity data is available, αu in equation 10 can be set to a non-zero value to further constrain the model to the correct range of velocity. A nonlinear solver for 1D pressure equations would be required to take full advantage of velocity data (Matthys et al 2007,Sherwin et al 2003).
One of the major limitations of the PWIP for practical applications is the cylindrical assumption required to relate the pressure to the wall displacement (equations 7 and 8). Evaluation of Gf for the general non-axisymmetric case will require the vessel cross section to be known, which can be achieved with 3D ultrasound systems. Also, since only a single vessel compliance is recovered at each axial location, additional information is required to detect circumferential and radial stiffness variation. Transverse strain images (Ribbers et al 2007, Brekken et al 2006) combined with PWIP compliance distributions are a promising avenue to produce quantitative, three-dimensional maps of vessel properties in non-axisymmetric vessels.
Conclusions
PWI is a good application for an inverse problem because a large amount of data can be collected in a system which has a reasonably simple parameterizable computational model to fit to the data. The PWIP demonstrated that it can recover accurate compliance distributions in phantom systems where there is known spatial variation.
Figure 9.
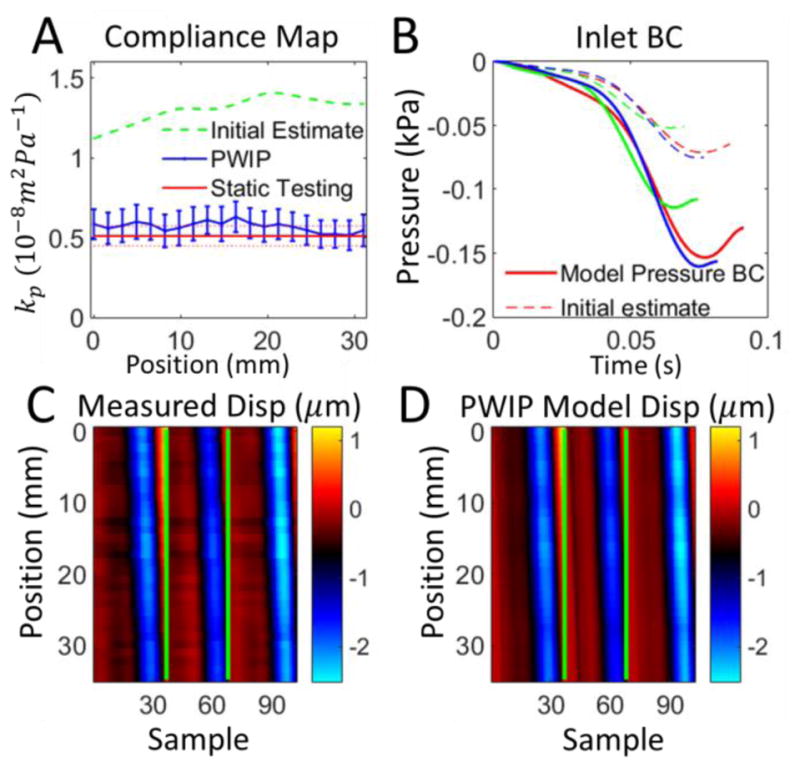
PWIP results for a homogenous section of stiff material from phantom 1. Panel A: The PWIP (blue) correctly identified constant compliance over this section, which was lower than the soft portion in Figure 8. See the caption of figure 8 for an explanation of panels B–D.
Figure 10.
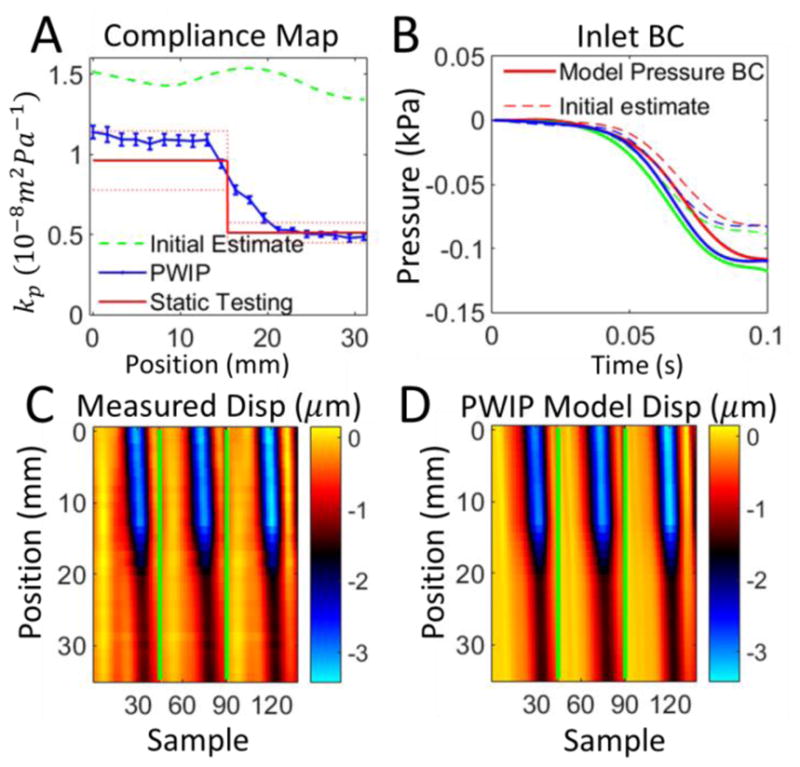
PWIP for phantom 1 with the pulse wave travelling from the soft to stiff side. Panel A: The PWIP (blue) correctly identified the location and contrast of the interface. See the caption of figure 8 for an explanation of panels B–D.
Figure 11.
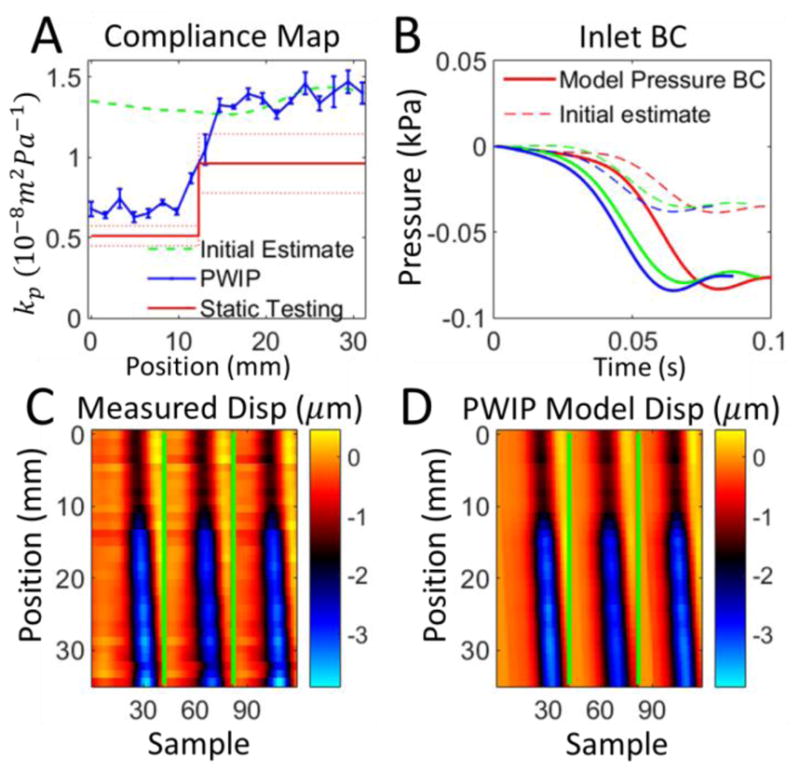
PWIP for phantom 1 with the pulse wave travelling from the stiff to soft side. Panel A: The PWIP (blue) correctly identified the location and contrast of the interface, with an overestimation of compliance of around 40%. See the caption of figure 8 for an explanation of panels B–D.
Figure 12.
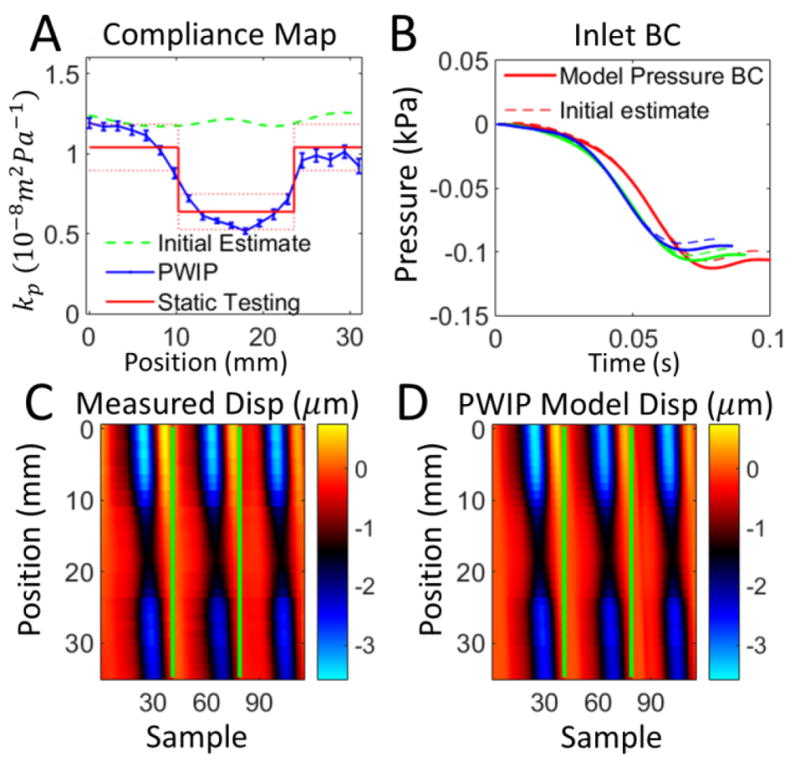
PWIP across the 15mm inclusion in Phantom 2. Panel A: The PWIP (blue) correctly identified the location and contrast of the stiff inclusion. See the caption of figure 8 for an explanation of panels B–D.
Figure 13.
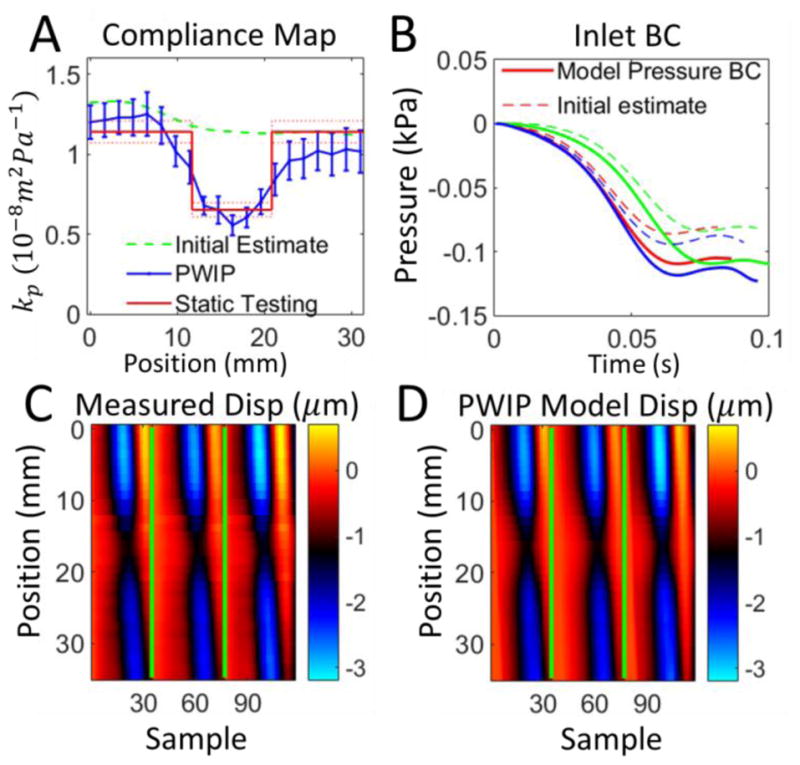
PWIP across the 10mm inclusion in Phantom 3. Panel A: The PWIP (blue) correctly identified the location and contrast of this smaller stiff inclusion. See the caption of figure 8 for an explanation of panels B–D.
References
- 1.Apostolakis I, Nandlall S, Konofagou E. Piecewise Pulse Wave Imaging (pPWI) for detection and monitoring of focal vascular disease in murine aortas and carotids in vivo. IEEE Transactions on Medical Imaging. 2015 doi: 10.1109/TMI.2015.2453194. [DOI] [PMC free article] [PubMed] [Google Scholar]
- 2.Asmar R, Benetos A, Topouchian J, Laurent P, Pannier B, Brisac A, … Levy B. Assessment of arterial distensibility by automatic pulse wave velocity measurement: validation and clinical application studies. Hypertension. 1995;26(3):485–490. doi: 10.1161/01.hyp.26.3.485. [DOI] [PubMed] [Google Scholar]
- 3.Blacher J, Asmar R, Djane S, London G, Safar M. Aortic pulse wave velocity as a marker of cardiovascular risk in hypertensive patients. Hypertension. 1999;33(5):1111–1117. doi: 10.1161/01.hyp.33.5.1111. [DOI] [PubMed] [Google Scholar]
- 4.Brekken R, Bang J, Ødegård A, Aasland J, Hernes T, Myhre H. Strain estimation in abdominal aortic aneurysms from 2-D ultrasound. Ultrasound in medicine & biology. 2006;32(1):33–42. doi: 10.1016/j.ultrasmedbio.2005.09.007. [DOI] [PubMed] [Google Scholar]
- 5.Chen C, Nevo E, Fetics B, Pak P, Yin F, Maughan W, Kass D. Estimation of central aortic pressure waveform by mathematical transformation of radial tonometry pressure validation of generalized transfer function. Circulation. 1997;95(7):1827–1836. doi: 10.1161/01.cir.95.7.1827. [DOI] [PubMed] [Google Scholar]
- 6.Cheng K, Tiwari A, Boutin A, Denton C, Black C, Morris R, … Seifalian A. Carotid and femoral arterial wall mechanics in scleroderma. Rheumatology. 2003;42(11):1299–1305. doi: 10.1093/rheumatology/keg371. [DOI] [PubMed] [Google Scholar]
- 7.McKee C, Last J, Russell P, Murphy C. Indentation versus tensile measurements of Young's modulus for soft biological tissues. Tissue Engineering Part B: Reviews. 2011;17(3):155–164. doi: 10.1089/ten.teb.2010.0520. [DOI] [PMC free article] [PubMed] [Google Scholar]
- 8.de Korte C, Hansen H, van der Steen A. Vascular ultrasound for atherosclerosis imaging. Interface Focus. 2011;1(4):565–575. doi: 10.1098/rsfs.2011.0024. [DOI] [PMC free article] [PubMed] [Google Scholar]
- 9.Fung Y. Biomechanics: circulation. Springer Science & Business Media; 2013. [Google Scholar]
- 10.Hansen T, Staessen J, Torp-Pedersen C, Rasmussen S, Thijs L, Ibsen H, Jeppesen J. Prognostic value of aortic pulse wave velocity as index of arterial stiffness in the general population. Circulation. 2006;113(5):664–670. doi: 10.1161/CIRCULATIONAHA.105.579342. [DOI] [PubMed] [Google Scholar]
- 11.Kaipio J, Somersalo E. Statistical inverse problems: Discretization, model reduction and inverse crimes. Journal of Computational and Applied Mathematics. 2007;198(2):493–504. [Google Scholar]
- 12.Kashif A, Lotz T, McGarry M, Pattison A, Chase J. Silicone breast phantoms for elastographic imaging evaluation. Medical physics. 2013;40(6):063503. doi: 10.1118/1.4805096. [DOI] [PubMed] [Google Scholar]
- 13.Lee H, Oh B. Aging and arterial stiffness. Circulation Journal. 2010;74(11):2257–2262. doi: 10.1253/circj.cj-10-0910. [DOI] [PubMed] [Google Scholar]
- 14.Li R, Luo J, Balaram S, Chaudhry F, Shahmirzadi D, Konofagou E. Pulse wave imaging in normal, hypertensive and aneurysmal human aortas in vivo: a feasibility study. Physics in medicine and biology. 2013;58(13):4549. doi: 10.1088/0031-9155/58/13/4549. [DOI] [PMC free article] [PubMed] [Google Scholar]
- 15.Li R, Qaqish W, Konofagou E. Performance assessment of pulse wave imaging using conventional ultrasound in canine aortas ex vivo and normal human arteries in vivo. Artery research. 2015;11:19–28. doi: 10.1016/j.artres.2015.06.001. [DOI] [PMC free article] [PubMed] [Google Scholar]
- 16.Loudon C, Tordesillas A. The use of the dimensionless Womersley number to characterize the unsteady nature of internal flow. Journal of theoretical biology. 1998;191(1):63–78. doi: 10.1006/jtbi.1997.0564. [DOI] [PubMed] [Google Scholar]
- 17.Luo J, Fujikura K, Tyrie L, Tilson M, Konofagou E. Pulse wave imaging of normal and aneurysmal abdominal aortas in vivo. Medical Imaging, IEEE Transactions on. 2009;28(4):477–486. doi: 10.1109/TMI.2008.928179. [DOI] [PubMed] [Google Scholar]
- 18.Luo J, Li R, Konofagou E. Pulse wave imaging of the human carotid artery: an in vivo feasibility study. Ultrasonics, Ferroelectrics, and Frequency Control, IEEE Transactions on. 2012;59(1):174–181. doi: 10.1109/TUFFC.2012.2170. [DOI] [PMC free article] [PubMed] [Google Scholar]
- 19.Lynch D. Numerical partial differential equations for environmental scientists and engineers: a first practical course. Springer Science & Business Media; 2005. [Google Scholar]
- 20.Matthys K, Alastruey J, Peiró J, Khir A, Segers P, Verdonck P, … Sherwin S. Pulse wave propagation in a model human arterial network: assessment of 1-D numerical simulations against in vitro measurements. Journal of biomechanics. 2007;40(15):3476–3486. doi: 10.1016/j.jbiomech.2007.05.027. [DOI] [PubMed] [Google Scholar]
- 21.McDonald D. Regional pulse-wave velocity in the arterial tree. Journal of applied physiology. 1968;24(1):73–78. doi: 10.1152/jappl.1968.24.1.73. [DOI] [PubMed] [Google Scholar]
- 22.McGarry M, Van Houten E, Johnson C, Georgiadis J, Sutton B, Weaver J, Paulsen K. Multiresolution MR elastography using nonlinear inversion. Medical physics. 2012;39(10):6388–6396. doi: 10.1118/1.4754649. [DOI] [PMC free article] [PubMed] [Google Scholar]
- 23.Messas E, Pernot M, Couade M. Arterial wall elasticity: state of the art and future prospects. Diagnostic and interventional imaging. 2013;94(5):561–569. doi: 10.1016/j.diii.2013.01.025. [DOI] [PubMed] [Google Scholar]
- 24.Mitchell G, Parise H, Benjamin E, Larson M, Keyes M, Vita J, … Levy D. Changes in arterial stiffness and wave reflection with advancing age in healthy men and women the Framingham Heart Study. Hypertension. 2004;43(6):1239–1245. doi: 10.1161/01.HYP.0000128420.01881.aa. [DOI] [PubMed] [Google Scholar]
- 25.Nichols Wilmer, O'Rourke Michael. McDonald's blood flow in arteries: theoretical, experimental and clinical principles. Oxford University Press; 2005. [Google Scholar]
- 26.Reneman R, van Merode T, Brands P, Hoeks A. Inhomogeneities in arterial wall properties under normal and pathological conditions. Journal of Hypertension. 1992;10:S35–S40. [PubMed] [Google Scholar]
- 27.Reneman R, Van Merode T, Hick P, Muytjens A, Hoeks A. Age-related changes in carotid artery wall properties in men. Ultrasound in medicine & biology. 1986;12(6):465–471. doi: 10.1016/0301-5629(86)90218-8. [DOI] [PubMed] [Google Scholar]
- 28.Ribbers H, Lopata R, Holewijn S, Pasterkamp G, Blankensteijn J, De Korte C. Noninvasive two-dimensional strain imaging of arteries: validation in phantoms and preliminary experience in carotid arteries in vivo. Ultrasound in medicine & biology. 2007;33(4):530–540. doi: 10.1016/j.ultrasmedbio.2006.09.009. [DOI] [PubMed] [Google Scholar]
- 29.Safar M, Levy B, Struijker-Boudier H. Current perspectives on arterial stiffness and pulse pressure in hypertension and cardiovascular diseases. Circulation. 2003;107(22):2864–2869. doi: 10.1161/01.CIR.0000069826.36125.B4. [DOI] [PubMed] [Google Scholar]
- 30.Shahmirzadi D, Konofagou E. Detection of aortic wall inclusions using regional pulse wave propagation and velocity in silico. Artery research. 2012;6(3):114–123. doi: 10.1016/j.artres.2012.05.004. [DOI] [PMC free article] [PubMed] [Google Scholar]
- 31.Shahmirzadi D, Narayanan P, Li R, Qaqish W, Konofagou E. Mapping the longitudinal wall stiffness heterogeneities within intact canine aortas using Pulse Wave Imaging (PWI) ex vivo. Journal of biomechanics. 2013;46(11):1866–1874. doi: 10.1016/j.jbiomech.2013.04.019. [DOI] [PMC free article] [PubMed] [Google Scholar]
- 32.Sherwin S, Formaggia L, Peiro J, Franke V. Computational modelling of 1D blood flow with variable mechanical properties and its application to the simulation of wave propagation in the human arterial system. International Journal for Numerical Methods in Fluids. 2003;43(6–7):673–700. [Google Scholar]
- 33.Soltész P, Dér H, Kerekes G, Szodoray P, Szücs G, Dankó K, … Szekanecz Z. A comparative study of arterial stiffness, flow-mediated vasodilation of the brachial artery, and the thickness of the carotid artery intima media in patients with systemic autoimmune diseases. Clinical rheumatology. 2009;28(6):655–662. doi: 10.1007/s10067-009-1118-y. [DOI] [PubMed] [Google Scholar]
- 34.Stojadinović B, Tenne T, Zikich D, Rajković N, Milošević N, Lazović B, Žikić D. Effect of viscosity on the wave propagation: Experimental determination of compression and expansion pulse wave velocity in fluid-fill elastic tube. Journal of biomechanics. 2015;48(15):3969–3974. doi: 10.1016/j.jbiomech.2015.09.016. [DOI] [PubMed] [Google Scholar]
- 35.Sutton-Tyrrell K, Najjar S, Boudreau R, Venkitachalam L, Kupelian V, Simonsick E, … Newman A. Elevated aortic pulse wave velocity, a marker of arterial stiffness, predicts cardiovascular events in well-functioning older adults. Circulation. 2005;111(25):3384–3390. doi: 10.1161/CIRCULATIONAHA.104.483628. [DOI] [PubMed] [Google Scholar]
- 36.Tomiyama H, Yamashina A, Arai T, Hirose K, Koji Y, Chikamori T, … Hinohara S. Influences of age and gender on results of noninvasive brachial ankle pulse wave velocity measurement—a survey of 12 517 subjects. Atherosclerosis. 2003;166(2):303–309. doi: 10.1016/s0021-9150(02)00332-5. [DOI] [PubMed] [Google Scholar]
- 37.van de Vosse F, Stergiopulos N. Pulse wave propagation in the arterial tree. Annual Review of Fluid Mechanics. 2011;43:467–499. [Google Scholar]
- 38.Vappou J, Luo J, Konofagou E. Pulse wave imaging for noninvasive and quantitative measurement of arterial stiffness in vivo. American journal of hypertension. 2010;23(4):393–398. doi: 10.1038/ajh.2009.272. [DOI] [PMC free article] [PubMed] [Google Scholar]
- 39.Vappou J, Luo J, Okajima K, Di Tullio M, Konofagou E. Non-invasive measurement of local pulse pressure by pulse wave-based ultrasound manometry (PWUM) Physiological measurement. 2011;32(10):1653. doi: 10.1088/0967-3334/32/10/012. [DOI] [PMC free article] [PubMed] [Google Scholar]
- 40.Vignon I, Taylor C. Outflow boundary conditions for one-dimensional finite element modeling of blood flow and pressure waves in arteries. Wave Motion. 2004;39(4):361–374. [Google Scholar]
- 41.Wagenseil J, Nerurkar N, Knutsen R, Okamoto R, Li D, Mecham R. Effects of elastin haploinsufficiency on the mechanical behavior of mouse arteries. American Journal of Physiology-Heart and Circulatory Physiology. 2005;289(3):H1209–H1217. doi: 10.1152/ajpheart.00046.2005. [DOI] [PubMed] [Google Scholar]
- 42.Westenberg J, van Poelgeest E, Steendijk P, Grotenhuis H, Jukema J, de Roos A. Bramwell-Hill modeling for local aortic pulse wave velocity estimation: a validation study with velocity-encoded cardiovascular magnetic resonance and invasive pressure assessment. J Cardiovasc Magn Reson. 2012;14(2) doi: 10.1186/1532-429X-14-2. [DOI] [PMC free article] [PubMed] [Google Scholar]
- 43.Widman E, Maksuti E, Larsson D, Urban M, Bjällmark A, Larsson M. Shear wave elastography plaque characterization with mechanical testing validation: a phantom study. Physics in medicine and biology. 2015;60(8):3151. doi: 10.1088/0031-9155/60/8/3151. [DOI] [PubMed] [Google Scholar]
- 44.Zhang L, Zhou W, Li D. Global convergence of a modified Fletcher Reeves conjugate gradient method with Armijo-type line search. Numerische Mathematik. 2006;104(4):561–572. [Google Scholar]
- 45.Zieman S, Melenovsky V, Kass D. Mechanisms, pathophysiology, and therapy of arterial stiffness. Arteriosclerosis, thrombosis, and vascular biology. 2005;25(5):932–943. doi: 10.1161/01.ATV.0000160548.78317.29. [DOI] [PubMed] [Google Scholar]


