

Abstract
Skeletal muscle is distinguished from other tissues on the basis of its shape, biochemistry, and physiological function. Based on mammalian studies, fiber size, fiber types, and gene expression profiles are regulated, in part, by the electrical activity exerted by the nervous system. To address whether similar adaptations to changes in electrical activity in skeletal muscle occur in teleosts, we studied these phenotypic properties of ventral muscle in the electric fish Sternopygus macrurus following 2 and 5 days of electrical inactivation by spinal transection. Our data show that morphological and biochemical properties of skeletal muscle remained largely unchanged after these treatments. Specifically, the distribution of type I and type II muscle fibers and the cross-sectional areas of these fiber types observed in control fish remained unaltered after each spinal transection survival period. This response to electrical inactivation was generally reflected at the transcript level in real-time PCR and RNA-seq data by showing little effect on the transcript levels of genes associated with muscle fiber type differentiation and plasticity, the sarcomere complex, and pathways implicated in the regulation of muscle fiber size. Data from this first study characterizing the acute influence of neural activity on muscle mass and sarcomere gene expression in a teleost are discussed in the context of comparative studies in mammalian model systems and vertebrate species from different lineages.
Keywords: skeletal muscle atrophy, fiber types in teleost fish, spinal cord transection, muscle inactivation, muscle transcriptome
skeletal muscles are composed of a heterogeneous population of muscle fibers with different morphological, biochemical, and physiological properties (13, 14). That many of these muscle fiber properties can be altered by changes in nervous system input has been demonstrated through cross reinnervation, chronic stimulation, and electrical inactivation studies. Together, these studies suggest that an important property of neural input affecting muscle fibers is the electrical activity of innervating motor neurons (20, 43, 58, 67). The molecular mechanisms that link electrical activity to changes in muscle gene expression have been the object of intensive investigation. Although the signaling pathways that transduce electrical muscle activity into distinct muscle gene expression programs are not well understood, studies in mammals, mainly rodents, have shown that removal of nerve-dependent electrical activity can lead to extensive changes in muscle fiber size, fiber types, and associated sarcomere gene expression that occur largely via transcriptional mechanisms. These changes have been reported to occur as early as 2 days after electrical inactivation (21, 31, 46, 50, 53, 59, 74). Several observations have suggested that transcription factor families including members of the MyoD, Mef2, and NFAT families, which are essential in myogenesis, also function as mediators through which neural activity regulates the types of transcripts and proteins expressed in a muscle fiber (4, 11, 12, 15, 16, 22, 34, 52, 70, 71).
This speculation is supported by studies showing that changes in electrical activity in skeletal muscles of adult animals are coupled to alterations in the levels of these transcriptional regulators, which in turn lead to modifications in the transcription of contraction-associated genes (1, 16, 47, 54). However, the role that Mef2, NFAT, and MyoD families play in regulating muscle properties other than changes in contractile protein isoforms has not been fully determined. In addition, the role of innervation on muscle properties in nonmammalian vertebrate model systems has been greatly overlooked. Hence, we understand little to nothing of how neural activity may regulate the skeletal muscle phenotype via conserved signaling pathways that transduce electrical muscle activity into distinct muscle gene expression programs across diverse vertebrate taxa.
Here, we report that the skeletal muscle fibers of the electric fish Sternopygus macrurus, a freshwater species of knife fish native to South America, do not change their size or their myosin heavy chain (MHC)-based fiber type composition even after a 5-day electrical inactivation period. We informed these morphological studies with gene expression analysis of different muscle protein systems, focusing primarily on the sarcomeric complex and the protein synthesis and degradation pathways and using real-time PCR and deep RNA sequencing (RNA-seq) to identify comprehensively genes that are differentially expressed after electrical inactivation and facilitate our investigations aimed at elucidating gene networks involved in electrical activity-dependent plasticity. The mRNA levels of genes associated with the sarcomere complex or the members of the Mef2, NFAT, and MyoD transcription factor families were unaffected. There was a transient upregulation in the expression of proteolytic pathway components after only 2 days of inactivation, and transcript profiles of genes in the IGF-Akt protein synthesis pathway were unaltered after 2 and 5 days of inactivity. The present results demonstrate that activity-independent mechanisms remain important sources of the control of the differentiated muscle phenotype in S. macrurus. Data from this first study characterizing the neural influence on muscle fiber size and sarcomere gene expression in a teleost are discussed in the context of comparative studies in mammalian model systems and vertebrate species from different lineages.
MATERIALS AND METHODS
Animals and Spinal Transection Surgery
Adult Sternopygus macrurus were obtained commercially from Ornamental Fish (Miami, FL). Fish used in this study measured about 30 cm in length and were of undetermined sex. Fish were housed individually in 15- to 20-gallon tanks, fed three times weekly, and maintained in aerated aquaria at temperatures of 25–28°C. A total of 21 fish were separated into three groups: a control unoperated group (n = 8) that received no treatment and two spinal transected (ST) groups from which tissues were harvested at 2 (2-day ST, n = 6) and 5 (5-day ST, n = 7) days after surgery. Fish that underwent ST surgery were anesthetized with 2-phenoxyethanol (Sigma-Aldrich, St. Louis, MO) in tank water (1.0 ml/l). A dorsal incision (∼3 cm long) was made at approximately midlength of the fish's body and followed by a partial dorsal laminectomy. The exposed spinal cord was transected with scissors, and complete transection was verified under a stereoscope by a clear separation of two spinal cord segments (Fig. 1). Following ST, the skin was sutured and treated with a topical antibiotic (nystatin and triamcinolone acetonide ointment USP; E. Fougera & Co., Melville, NY). Fish were immediately returned to their tanks and monitored until fully recovered from anesthesia, and STRESS COAT (Aquarium Pharmaceuticals, Chalfont, PA) was added to the tanks as an additional anti-infection agent. To validate the success of a complete ST, we monitored fish 10–15 min daily for the absence of muscle movement caudal to the ST site throughout the 2- and 5-day ST periods. All animal treatment and handling procedures used in this study complied with the American Physiological Society Animal Care Guidelines and were approved by the Institutional Animal Care and Use Committee at the New Mexico State University.
Fig. 1.
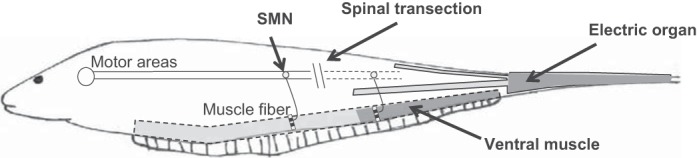
Schematic of the electromotor circuitry of Sternopygus macrurus and site of spinal transection (ST). Skeletal muscle fibers in the ventral muscle allow movement of the fin and are innervated by a population of spinal motoneurons called somatomotoneurons (SMNs) that receive electrical signals from motor areas within the brain. Spinal transection surgery was performed as indicated to electrically silence posteriorly located SMNs and innervated muscle fibers. Concurrently, the ST surgery also silenced electromotoneurons innervating electrocytes in the electric organ (EO). Only the most distal portion of ventral muscle (dashed outline, dark gray) and the caudal portion of the electric organ (solid outline, dark gray) were harvested for analysis. While EO samples were included in the assembly of the transcriptomic dataset, the current study examined only the effects on ventral muscle.
Tissue Dissection
At 2 and 5 days after ST surgery fish were reanesthetized to harvest ventral skeletal muscle tissues and tail segments posterior to the ST site (Fig. 1). For transcript analyses, a segment (∼3 cm) of ventral muscle was excised, skinned, blotted dry, and immediately immersed in RNAlater (Thermo Fisher Scientific, Waltham, MA) from control (n = 5), 2-day ST (n = 6), and 5-day ST (n = 4) fish. All quantitative transcript analyses carried out with real-time PCR used a minimum of the same four fish samples. The sample of ventral muscle from a control animal used to obtain a complete transcriptome with RNA-seq was not used for real-time PCR analysis. Morphological and immunolabeling analyses were performed on portions of ventral muscle caudal to those taken for quantitative RNA studies. Specifically, the tail segment (∼2 cm) immediately posterior to the ST site from control (n = 3) and 5-day ST (n = 3) fish was blotted dry, embedded in Tissue-Tek O.C.T. embedding compound (Sakura Finetek, Torrance, CA) on cork, and flash-frozen by immersion in liquid nitrogen-cooled isopentane (Sigma-Aldrich). All ventral muscle samples were stored at −80°C until further analysis.
RNA Isolation
Samples stored in RNAlater were blotted dry, weighed, pulverized in liquid nitrogen, and homogenized in TRIzol reagent (Thermo Fisher Scientific), and total RNA was extracted following manufacturer's instructions. Total RNA concentration and purity (A260/A280) were determined spectrophotometrically on a NanoDrop 2000 (Thermo Fisher Scientific) before and after removal of residual genomic DNA with DNase I, amplification grade (Thermo Fisher Scientific).
Real-time RT-PCR Determination of Transcript Abundances and Statistical Analysis
Total RNA samples isolated from control, 2-day ST, and 5-day ST fish were DNased and used for cDNA synthesis in triplicate using the SuperScript First-Strand Synthesis kit (Thermo Fisher Scientific) as per manufacturer's instructions. Additionally, one no-RT reaction that omitted the reverse transcriptase enzyme was performed for each sample to ensure absence of DNA contamination in subsequent PCR reactions. cDNA and no-RT samples were diluted 80-fold in nuclease-free water and stored at −20°C. Gene-specific primers (Table 1) were designed using Primer3 (http://primer3plus.com/cgi-bin/dev/primer3plus.cgi) and evaluated with NetPrimer (http://www.premierbiosoft.com/netprimer). Annealing temperature and primer concentration were optimized for each primer pair. Real-time PCR reactions were performed using Perfecta SYBR Green Fastmix (Quanta Biosciences, Gaithersburg, MD) on cDNA and no-RT samples on an Opticon2 DNA Engine (Bio-Rad, Hercules, CA) running Opticon Monitor software (v.3.1.32, Bio-Rad). PCR conditions were as follows: initial template denaturation and polymerase activation for 30 s at 95°C followed by 40 cycles of 1 s denaturation at 95°C, 15 s primer annealing at a temperature optimized for each primer pair (range: 57–62°C), 30 s extension at 72°C, and fluorescence signal reading. To validate primer specificity, we performed the following: 1) the PCR reactions were immediately followed by melting curve analysis (65–95°C in 0.2°C steps with a holding time of 2 s per step) to ensure the presence of a single sharp peak; and 2) PCR products were visualized on SYBRSafe-stained (Thermo Fisher Scientific) agarose gels. Raw fluorescence data were exported and analyzed with the real-time PCR Miner tool (http://www.miner.ewindup.info/; Ref. 76) to determine Ct values and amplification efficiencies for each primer pair. Ct values were exported into Microsoft Excel and analyzed using primer pair efficiency adjustment and geometric mean normalization against rps11, cct5, and snrpb to derive fold expression differences between control and ST muscle samples. Fold changes were assessed in R for significance using one-way ANOVA and Benjamini-Hochberg P value adjustment for multiple testing. Genes with P values that retained significance (P < 0.05) following multiple testing adjustment were subsequently tested for pair-wise group differences between 2-day ST vs. control and 5-day ST vs. control groups using the “contrasts” function in R.
Table 1.
Oligonucleotide primers used for quantitative RT-PCR
| Gene Name | Sense Primer | Antisense Primer | Length, bp |
|---|---|---|---|
| cct5 | 5′-AGATCGGAGATGGGACTACTGG-3′ | 5′-GTCCATGTCAGCTACGGTCAAG-3′ | 299 |
| rps11 | 5′-TACCCAGAATGAAAGGGCGTAT-3′ | 5′-CATGTTCTTGTGCCTCTTCTCG-3′ | 322 |
| snrpb | 5′-AAGATCAAGCCCAAAAATTCCA-3′ | 5′-CCTGAGGTGTCATTACCTGCTG-3′ | 289 |
| atg12 | 5′-CTGTTACCGATACAGGAGACACTGG-3′ | 5′-AGAAAGCGGGAGATAAACTGGG-3′ | 150 |
| becn1 | 5′-ACGTGGACAAGGGCAAGATC-3′ | 5′-CCCATTTGAGGTTGGTGAGC-3′ | 125 |
| bnip3 | 5′-TACCCAGCTCAGGAGAGAAGAAC-3′ | 5′-CAAGAGACGGAAGGAAGACTCTG-3′ | 258 |
| ctsll | 5′-TGGTGTCCCTGAGTGAGCAG-3′ | 5′-CACAAAGCCAGTGTCGTTAGC-3′ | 210 |
| fbxo32 | 5′-AACGACACGAGACGATAACGAG-3′ | 5′-CTTTGGTGCTCCCTTTGTGAAC-3′ | 206 |
| foxo3b | 5′-TCTTCTCCACAACAACCGACAC-3′ | 5′-CATCAGGTCAGAACGGATTATGG-3′ | 307 |
| gabarapa | 5′-CGACGACAGATTTCCACGG-3′ | 5′-ATTGTTGACGAAGAAGAAGAGTGC-3′ | 290 |
| ncl | 5′-CTCCTGCAACAACACAGAGATTG-3′ | 5′-TCCTCCTCACTGTCAAAGTCCA-3′ | 252 |
| psmb1 | 5′-TGGTGACTGTTTGACGCTGAC-3′ | 5′-CGCCTGCTTTGTAAGTGTCC-3′ | 250 |
| psmc2 | 5′-AAGAGGAGGAGAAAGACGACGG-3′ | 5′-GCTAAATCCCATAACGCAGGAG-3′ | 200 |
| psmc5 | 5′-GGTGTCCCTGATGATGGTGG-3′ | 5′-CAGACACTCGGATGAAGGTGC-3′ | 240 |
| psmc6 | 5′-ATTGACGGGCGTTTGAAGG-3′ | 5′-TCCAACAACATACCGAGGGC-3′ | 180 |
| psmd12 | 5′-CGGAAGAGGGAGAGAAGAGATGG-3′ | 5′-CAGTCATTCAGCAGATCATTGGG-3′ | 250 |
| psmd3 | 5′-GCTTCTACACCTCCAACGCC-3′ | 5′-CATCGGACACCTTCTGAGCC-3′ | 210 |
| psmd4b | 5′-GAGGCTCTCCTGAAGATGTCTG-3′ | 5′-CAGGCAGATTCTCCAACACACT-3′ | 247 |
| psmd7 | 5′-TGAGGAGGCAGAGGAAGTTGG-3′ | 5′-TGATCTGGTGATTGATGGGTAGC-3′ | 190 |
| trim63 (MuRF1) | 5′-CGAAGTGTCCACTCTGAAGAACG-3′ | 5′-AGCACCACCTTCTCATCCTGTT-3′ | 261 |
| ube2a | 5′-CCCGTCCGAGAACAATATCA-3′ | 5′-CAGGGCTGTTAGGATTTGGC-3′ | 280 |
| zfand5b | 5′-GAGATGAGCATTTCCTGTAAGG-3′ | 5′-TTGTGCTTGTCCGAGTAACGAT-3′ | 248 |
Sequences for sense and antisense primers as well as amplicon length are shown. Official gene names are used.
Illumina HiSeq2000 Sequencing and Transcriptome Processing
The assembly, annotation, and analysis of transcriptomic datasets obtained from ventral muscle of S. macrurus used in this study have been described previously, comparing the gene expression profiles of skeletal muscle and the myogenic electric organ (EO) in control adult fish (44). These transcriptomic datasets also included one muscle sample each from control, 2-day spinally transected, and 5-day spinally transected fish. In the present study, we used the DESeq2 package as per the program vignette (35) for normalization of transcript counts and to identify differentially expressed genes instead of the EBSeq package that was used in the transcriptomic analysis comparing muscle and EO of control fish (44).
Heat-map Plotting
For plotting of transcriptomic data in heat-map format the “heatmap.2” function within the “gplots” package (66) was used in R (60). Gene lists for pathways associated with regulating muscle fiber size used for heat-map plotting were assembled either manually based on literature searches (IGF pathway, myostatin pathway) (8, 49, 51) or based on Danio rerio KEGG pathways retrieved from the “pathview” package (36) in R with manual addition of further components (ubiquitylation, proteasome, regulation of autophagy, lysosome). For visualization, fold changes in transcript abundances between ST and control conditions provided by DESeq2 were log2-transformed and represented on a 100-step red-green color scale using the appropriate option for the “heatmap.2” function.
Immunolabeling
Longitudinal and cross sections (20 mm thick) from fish tail segments adjacent to the ST site were cut with a CM3050 cryostat (Leica Microsystems, Buffalo Grove, IL) and mounted on glass slides for immunolabeling processing as described in Unguez and Zakon (62). In brief, tissue cryosections were air-dried, rehydrated in 0.1 M PBS (pH 7.4) (5 min), fixed in 2% paraformaldehyde (10 min), and incubated in blocking solution (1% normal horse serum in PBS plus 0.1% Triton X-100) (1 h). Tissue sections were rinsed with PBS twice (5 min each) before incubation at room temperature with primary antibody in blocking solution overnight. Primary antibodies used included rabbit anti-laminin L9393 (Sigma-Aldrich, 1:20 dilution), mouse anti-slow and anti-fast MHC antibodies N2.261 (1:10) and A4.74 (1:2), respectively (Developmental Studies Hybridoma Bank, Iowa City, IA). Sections incubated with anti-slow and anti-fast MHC antibodies were coimmunolabeled with anti-laminin antibody. Following primary antibody incubation, tissue sections were washed three times with PBS (5 min each) and incubated with anti-mouse AlexaFluor488 and anti-rabbit AlexaFluor564 (Molecular Probes, Eugene, OR) diluted 1:200 each in blocking solution for 1 h at room temperature. Sections were washed twice in PBS (5 min each) before being mounted in Fluoromount (Sigma-Aldrich) and coverslipped. Immunolabeling of target antigens was detected, and tissue sections were imaged with a Zeiss DFC365 FX camera on a Zeiss Axioskop (Carl Zeiss Microimaging, Thornwood, NY) interfaced with a personal computer running the Leica Application Suite (v.3.1.0).
Quantification of Fiber Type Distribution and Fiber Size in Ventral Muscle and Statistical Analysis
In S. macrurus, as in most teleosts, ventral muscle is organized into myomeres, or fascicular bundles, of muscle fibers enveloped by thick connective tissue sheaths. In S. macrurus, individual myomeres were readily identifiable by their myoseptal outlines, which were immunolabeled with anti-laminin antibody (Fig. 2). These myomeres are arranged in pairs (left and right), and the number of myomere pairs decreases in the posterior direction along the tail (Fig. 2). Tail portions distal to the ST site generally contained six or seven myomeres (Fig. 2). Within a tail cross section, myomeres were labeled in ascending order from ventral to dorsal surface. The second pair of myomeres defined as the most dorsally located myomeres contained a centrally located population of type I (anti-slow MHC-positive) fibers along the dorsoventral region (Fig. 2). In control fish, the myomere pairs that contained muscle fiber populations with the least variability in fiber type distribution and cross-sectional area were #3 and #4, and therefore, our analyses on muscle fiber type distribution and cross-sectional area used myomere pairs 3–4 from both control (n = 3) and 5-day ST (n = 3) fish. The myosepta around myomere pairs 3 and 4 were traced to obtain the total area for each myomere, and the myomere areas containing type I fibers were outlined separately. Individual images for each fluorescence emission channel were assembled as a panorama using Adobe Photoshop Elements 5.0 (Adobe System, San Jose, CA), and the assembled images were then merged and loaded into Adobe Photoshop Elements 5.0 to manually trace outlines of myomeres and type I and II (anti-fast MHC-positive) muscle fibers. NIH ImageJ (v. 1.43) was used to quantify the areas occupied by type I and type II fibers as well as total myomere areas. Measurements for each of these were averaged for both myomere pairs to determine the proportion of type I area for each fish. We calculated type II area similarly by using the myomere areas reactive to anti-fast MHC antibody. Statistical analysis was performed by an independent samples t-test.
Fig. 2.
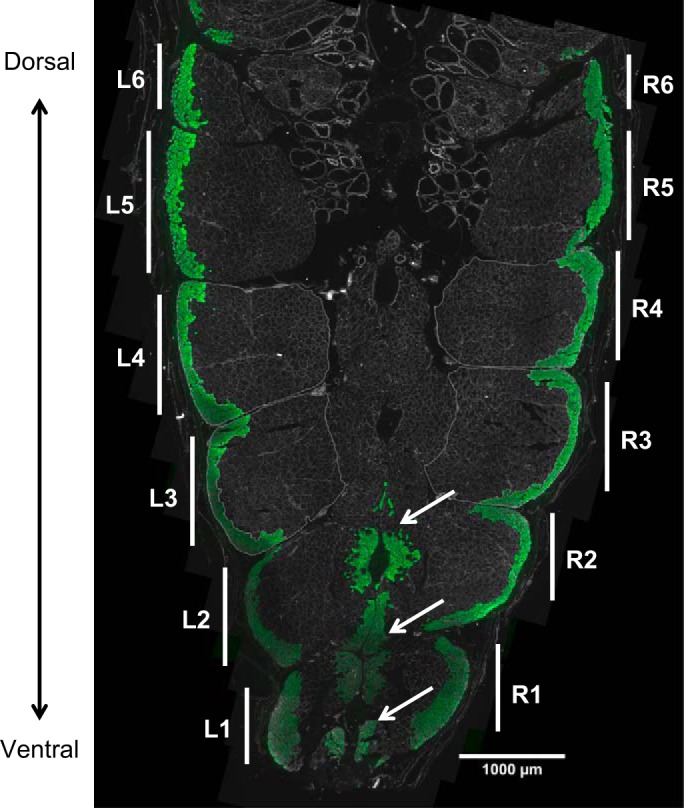
Fiber types in the ventral muscle of S. macrurus. Tissue cross section showing the ventral musculature of a tail from a control fish immunolabeled with an antibody against type I sarcomeric myosin heavy chain (green). Left (L) and right (R) myomeres are numbered in increasing order along the ventral-to-dorsal axis. Morphological and fiber type distribution analyses were performed bilaterally on myomeres 3 and 4 from tails of control and ST fish (n = 3 each). Scale bar, 1,000 μm.
We assessed changes in fiber sizes using the minimum Feret diameters (MFD) for type I and type II fibers in myomeres 3 and 4 of tails from the same control and 5-day ST fish that were used to determine fiber type distribution. The MFD has been shown to be a more reliable measure of cell size than direct measurements of cross-sectional areas (CSAs) since the MFD corrects for inaccuracies due to sectioning of fibers at nonorthogonal angles (10). CSAs of fibers were then calculated from the MFD measurements. For fibers sizes, the laminin-labeled sarcolemma of 10–25 individual fibers was traced on each side of the tail and in each myomere of myomere pairs 3 and 4. Images containing fiber outlines were loaded into NIH ImageJ to obtain measurements of fiber size. We noted that many muscle fibers in our tail cross sections, especially type I fibers, were oriented at oblique angles relative to the transverse plane of the fish tail. It has been demonstrated in mammals that when presented with these anatomical conditions, the MFD is a much more reliable metric for fiber size than the CSA (10). Hence, to assess changes in fiber size we measured the MFDs for type I and type II fibers in myomeres 3 and 4 of the same control and 5-day ST fish as those used to determine fiber type distribution. For statistical analysis measurements from all control and 5-day ST fish were combined separately and analyzed by an independent-samples t-test.
RESULTS
Electrical Inactivation for 5 Days Does Not Result in Atrophy of S. macrurus Ventral Muscle
To determine the effects of electrical inactivation on the size of muscle fibers in skeletal muscle of S. macrurus we measured the MFD for type I and type II fibers before and after the 5-day ST period. Using MFD measurements, we mathematically derived corresponding values for CSAs. In control fish, the mean CSA of type I fibers (73.0 ± 9.5 μm2) was more than 10-fold smaller than that of type II fibers (809.0 ± 16.1 μm2) (Fig. 3A). After the 5-day ST period, the average CSAs of type I fibers (5-day ST, 102.2 ± 11.1 μm2; Fig. 3A) and type II fibers (5-day ST, 804.3 ± 20.9 μm2; Fig. 3B) were not significantly different from control (type I fibers, P = 0.12; type II fibers, P = 0.89). These data showed that 5 days of electrical inactivation by ST resulted in no measurable reductions in cell size in type I and type II muscle fibers.
Fig. 3.

Effect of ST on cross-sectional area of muscle fiber types in S. macrurus. Minimum Feret diameter measurements were obtained for type I (A) and type II (B) muscle fibers from control and 5-day ST fish (n = 3 each) and used to calculate cross-sectional area, which was then normalized against total tail area to account for small differences in fish size. The number of fibers analyzed for each sample is indicated in parentheses. Data are represented as box plots with each open circle representing a single fiber measurement and “X” indicating the mean cross-sectional area for each fish.
Effects of Electrical Inactivation on Muscle Fiber Type Composition and Distribution
Spatial distribution of muscle fiber types I and II.
In every myomere analyzed, type I fibers were located most peripherally and adjacent to the skin, whereas type II fibers were located medial to the type I fibers (Fig. 2). In the three ventral-most myomeres (Fig. 2: L-R1, L-R2, L-R3), clusters of contiguous type I fibers were also found adjacent to the midline. This clear separation between fiber type populations was found in all control S. macrurus fish tails, and this pattern was unchanged following 5 days of electrical inactivation by ST (data not shown). Similar to control fish, we also did not observe any muscle fibers that were colabeled with antibodies against both slow and fast MHCs in 5-day ST fish (data not shown). The fiber type composition in ventral muscles of control and 5-day ST fish was established by measuring the area occupied by type I fibers relative to the total myomere area. In control and ST fish, the myomere area occupied by type I fibers was smaller than that occupied by type II fibers (Fig. 4). Figure 4 shows the average myomere areas occupied by type I fibers in myomeres of three control (means ± SD: 11.0 ± 2.0%, 10.0 ± 1.8%, 18.9 ± 2.1%) and three 5-day ST fish (11.3 ± 1.5%, 15.2 ± 1.3%, 11.9 ± 1.2%). The mean type I fiber proportions for the control (means ± SE: 13.3 ± 2.8%) and 5-day ST (12.8 ± 1.2%) groups were not found to differ significantly between these groups (P = 0.89). These data suggest that muscle fiber type composition and distribution in S. macrurus were not affected by 5 days of electrical inactivation.
Fig. 4.
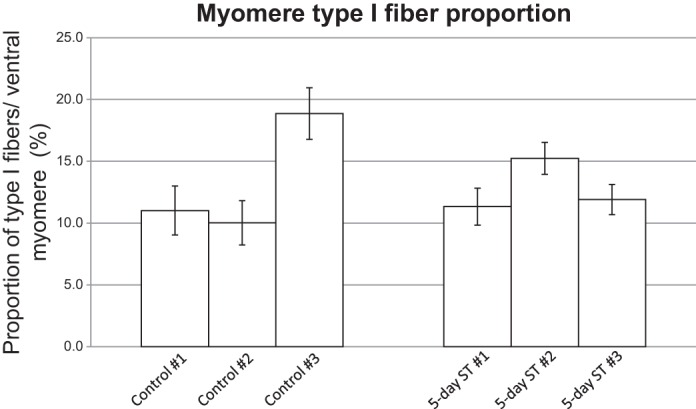
Effect of ST on muscle fiber type distribution in S. macrurus. Average type I muscle fiber distribution in myomeres 3 and 4 from control and spinal transected fish ventral muscle (n = 3 each) was determined as the average ratio of total cross-sectional area from type I muscle fibers to the total area of all muscle cells from four myomeres (i.e., L3, R3, L4, R4). Bars represent means ± SD for each sample.
Expression of the Muscle Program Is Largely Unaffected by Electrical Inactivation
Myogenic transcription factors.
In mammals, elimination of nerve-induced electrical activity triggers changes in the expression of muscle-specific transcription factors including the family of myogenic regulatory factors (MRFs). Changes in MRF expression precede alterations in structural muscle proteins providing a link with a likely transcriptional mechanism by which electrical activity may exert its effect on contractile properties in muscle (9, 17, 18, 48, 68). Our RNA-seq data showed that electrical inactivation had little effect on the expression levels of MyoD (myod), myogenin (myog), and MRF4 (myf6) genes in skeletal muscle of S. macrurus. Only Myf-5 (myf5) transcript levels were flagged as repressed at 2 days after ST (Fig. 5A). The expression patterns of positive (E12/E47) (tcf3) and negative (id1) co-regulators of MRFs were also unaffected by ST (Fig. 5A). The calcium-activated transcription factors belonging to the Mef2 (mef2c and mef2d) and the NFAT (nfatc1 to nfatc4) families did not show differences in transcript levels before and after ST (Fig. 5A). Other transcription factors involved in myogenesis, i.e., six1, eya1, sox6, and srf, also showed no changes in their gene expression levels before and after ST (Fig. 5A). Interestingly, one transcription factor that showed increased mRNA levels with ST and remained elevated compared with controls 5 days after ST was prdm1a. In the teleost D. rerio, the prdm1 transcription factor has been reported to induce type I muscle fiber differentiation by repressing the expression of sox6 (29). In S. macrurus, the increase in prdm1 transcript levels after ST was detected in the absence of changes to its target sox6 (Fig. 5A) or changes in the proportion of type I fibers in ventral muscle (Fig. 4).
Fig. 5.

Heat map of transcript abundance ratios of muscle transcription factor and sarcomeric genes between control and ST fish. Normalized transcript abundance ratios were determined for 2-day ST/control and 5-day ST/control muscle samples and the log2-transformed ratios were visualized as heat maps using the “heatmap.2” function in the “gplots” package in R for muscle transcription factors (A) and sarcomere genes (B). Transcription factors were ordered by the fiber type specificity of their target genes, whereas sarcomere genes were sorted by expression pattern using the default row clustering method in the “heatmap.2” function. Genes flagged as differentially expressed by DESeq2 are indicated by including the unadjusted P value overlaying the appropriate color cell.
Contraction-related genes.
A well-characterized response of muscle properties to nerve-dependent activity is the change that takes place in sarcomere gene expression following removal of neuronal activity. Our transcriptome provided extensive coverage of genes that form components of the contraction complex, i.e., the contractile sarcomeres. In total, only nine of 62 sarcomeric genes identified in our transcriptome were flagged as differentially expressed at the 2-day ST time point compared with control (Fig. 5B). Among these nine genes, two (trim63a, ampd3b) were found to be upregulated. In contrast, tmod1, mybpc1, ampd3a, capn3, tnni1a, mybpc3, and myoz2b were downregulated. At the 5-day ST time point only one of the 62 genes was found to be differentially expressed (upregulated) compared with control. In contrast to what has been reported in some mammals after electrical inactivation, our transcriptome data showed that electrical inactivation of ventral muscle for up to 5 days had little effect on the expression of key muscle transcription factors and genes that make up the entire contractile sarcomere unit.
Proteolytic Pathways Implicated in the Regulation of Fiber Size Are Only Transiently Induced Following Electrical Inactivation
Electrical inactivation-induced reduction in muscle fiber size in mammals is often accompanied by the activation of proteolytic mechanisms that include the ubiquitin-proteasome system, autophagy, and cathepsins (26, 37, 41, 75). Our quantitative expression analysis using real-time PCR of 19 mammalian orthologs of proteolytic genes in S. macrurus skeletal muscle showed an upregulation of eight of 14 proteasome-associated genes 2 days after ST (Fig. 6). The eight genes were the muscle-specific U3 ubiquitin ligases trim63 (a.k.a. MuRF1) and fbxo32 (atrogin-1), the ubiquitin-conjugating enzyme ube2a, the ubiquitylated protein shuttling factor zfand5, and the proteasome components psmc2, psmc5, psmd3, and psmd12. Increase in mRNA levels for four of five autophagy-related genes, i.e., becn1, bnip3, gabarapa, and the cathepsin-like ctsll, were also observed after a 2-day ST period (Fig. 6). However, the inactivity-induced increase in mRNA levels for most of these proteolytic genes was not maintained at the 5-day ST period. After 5 days of ST, the ubiquitin ligase trim63 was significantly decreased, while the proteasome-associated zfand5 and the autophagy regulator bnip3 remained upregulated compared with control levels (Fig. 6).
Fig. 6.

Quantification of transcript abundance ratios of selected genes of interest between spinally transected and control ventral muscle using real-time PCR (qPCR). Primers listed in Table 1 were used to amplify transcripts of interest. Abundance ratios determined by qPCR (n ≥ 4) for 2-day ST/control and 5-day ST/control were normalized using 3 internal references genes (rps11, snrpb, cct5) as described in materials and methods. Results are shown with means ± SE. *Statistically significant results with P < 0.05 after multiple testing adjustment. +Genes with statistical significance (P < 0.05) before, but not after, multiple testing adjustment.
Transcriptomic Analysis Confirms Transient Induction of Proteolytic Pathways
We complemented our real-time PCR data (n = 4) with next-generation RNA-seq analyses on ventral muscle tissue obtained from one control, 2-day ST, and 5-day ST fish. We found that of the 12 genes flagged as differentially expressed by real-time PCR, DESeq2-based assessment found six genes (fbxo32, trim63, psmd3, zfand5, bnip3, and ctsll) to be differentially expressed. The remaining gene (foxo3b) identified by DESeq2 as differentially expressed was found to be significantly changed (P < 0.05) by real-time PCR only before we adjusted its P value for multiple testing. In sum, DESeq2 analysis was consistent with real-time PCR data but was more conservative at flagging genes as differentially expressed (Fig. 6, Table 2).
Table 2.
Comparison of transcript quantification between real-time PCR (qPCR) and RNA-seq
| 2-day ST/control |
5-day ST/control |
||||
|---|---|---|---|---|---|
| Gene Name | Pathway | RNA-seq | qPCR | RNA-seq | qPCR |
| fbxo32 (atrogin-1) | proteasome-associated | 4.948# | 5.184 ± 0.923* | 2.354# | 1.742 ± 1.058 |
| foxo3b | proteasome-associated | 3.453# | 2.576 ± 0.635+ | 1.260 | 0.756 ± 0.138 |
| trim63 (MuRF1) | proteasome-associated | 3.412# | 4.869 ± 0.857* | 1.535 | 0.628 ± 0.231* |
| ube2a | proteasome-associated | 2.814 | 5.106 ± 0.771* | 1.483 | 1.427 ± 0.343 |
| ncl | proteasome | 0.963 | 1.267 ± 0.090 | 0.881 | 0.756 ± 0.284 |
| psmb1 | proteasome | 1.908 | 1.888 ± 0.216 | 1.555 | 1.627 ± 0.375 |
| psmc2 | proteasome | 2.472 | 3.316 ± 0.311* | 1.543 | 2.146 ± 0.649 |
| psmc5 | proteasome | 2.134 | 2.314 ± 0.215* | 1.597 | 1.507 ± 0.452 |
| psmc6 | proteasome | 2.375 | 3.032 ± 0.404 | 1.228 | 2.473 ± 1.111 |
| psmd12 | proteasome | 3.145 | 2.316 ± 0.205* | 2.064 | 1.664 ± 0.407 |
| psmd3 | proteasome | 3.959# | 7.985 ± 0.572* | 1.825 | 2.876 ± 1.389 |
| psmd4b | proteasome | 2.872 | 1.326 ± 0.262 | 2.170 | 1.105 ± 0.343 |
| psmd7 | proteasome | 2.666 | 2.455 ± 0.271+ | 1.567 | 1.687 ± 0.550 |
| zfand5 | proteasome | 7.271# | 17.064 ± 3.010* | 1.186 | 1.780 ± 1.199* |
| atg12 | autophagy-related | 2.064 | 1.288 ± 0.144 | 2.197 | 1.102 ± 0.199 |
| becn1 | autophagy-related | 1.697 | 2.690 ± 0.051* | 1.212 | 1.413 ± 0.177 |
| bnip3 | autophagy-related | 6.441# | 11.195 ± 1.770* | 2.118 | 1.630 ± 0.777* |
| gabarapa | autophagy-related | 2.245 | 2.014 ± 0.152* | 1.531 | 1.065 ± 0.138 |
| ctsll | autophagy | 6.761# | 4.298 ± 0.561* | 3.540# | 1.972 ± 0.753 |
Data for qPCR are the same as shown in Fig. 6. Corresponding RNA-seq ratios based on sample size of n = 1 for control, 2-day spinally transected, and 5-day spinally transected ventral muscle were selected based on the transcript sequence amplified by qPCR primers. Results for qPCR are shown as means ± SE with statistically significant results indicated (
, +) as in Fig. 6. Results for RNA-seq data are shown and those genes flagged as differentially expressed by DESeq2 are indicated (#).
Genes annotated to belong to pathways involved in regulating cell size were identified with the “pathview” package in R as well as manual literature searches. Changes in gene expression levels found at the 2-day and 5-day ST survival periods relative to control levels were visualized as heat maps created from the transcriptomic data. These data showed that several components related to the ubiquitin-proteasome pathway were transiently upregulated at the 2-day ST time point (Fig. 7). Six ubiquitylation-related genes were found to be upregulated after 2 days of ST, and these included the muscle-specific E3 ubiquitin ligases fbxo32 and trim63. At the 5-day post-ST time point only two genes were found to be upregulated, including fbxo32. For the proteasome, only one gene was found to be differentially expressed at each of the two time points. However, the expression of all proteasome components showed an overall induction at both time points post-ST, which appeared stronger at the 2-day ST time point. Few genes involved in the regulation of autophagy and the lysosome system were found to be differentially expressed at either time point, and no overall trend was discernible. A pattern of transient induction similar to that of ubiquitin-proteasome components was also observed for some members of the forkhead box O (FoxO) family of transcription factors, specifically foxo1a, foxo3b, and foxo4-like (Table 3). In contrast, transcript levels of genes in the IGF-Akt and myostatin pathways that are involved in regulating protein synthesis showed little evidence of altered gene expression with no genes flagged as differentially expressed at either time point post-ST (data not shown), a response to electrical inactivity unlike that reported in mammalian skeletal muscle (27, 31, 50, 55, 74).
Fig. 7.

Heat map of transcript abundance ratios of genes involved in cell size regulation between ST and control ventral muscle. Analysis and representation of data are the same as in Fig. 5. Genes within each pathway were sorted by expression pattern using the default row clustering method in the “heatmap.2” function.
Table 3.
Transcript abundances of FoxO
| Ratios (RNA-seq) |
||
|---|---|---|
| 2-day/Con | 5-day/Con | |
| foxo1a | 2.453 | 1.204 |
| foxo1b | 0.860 | 0.861 |
| foxo3a | 0.499 | 1.016 |
| foxo3b | 3.453# | 1.260 |
| foxo4-like | 2.269 | 1.140 |
DESeq2-derived fold changes in expression for 2-day spinally transected (ST)/control and 5-day ST/control ventral muscle are shown for each FoxO transcript variant detected in our transcriptome. The expression ratio of foxo3b for 2-day ST/control was flagged as differentially expressed and is indicated (#).
DISCUSSION
Our results show that morphological and biochemical properties of skeletal muscle in adult S. macrurus fish remained largely unchanged after 2 and 5 days of electrical inactivity by spinal transection. Specifically, the distribution of type I and type II muscle fibers and the differences in CSAs between these fiber types observed in control fish remained after each spinal transection survival period. This response to electrical inactivation was generally reflected in the RNA-seq data by showing little effect on the transcript levels of genes associated with muscle fiber type differentiation and plasticity, the sarcomere complex, and proteolytic pathways implicated in the regulation of muscle fiber size. Although spinal transection induced an upregulation in mRNA levels of some of these genes after 2 days of inactivity, this response was only transient, as gene expression profiles at 5 days after spinal transection were similar to those in control unoperated fish. These data expand on a previous study that tested the long-term effects of neural input on skeletal muscle plasticity in S. macrurus (62). Given that no dramatic changes in fiber type composition and fiber size were observed after 2 and 5 wk of electrical inactivation (62), our results suggest an absence of both short-term and chronic activity-induced cellular plasticity in skeletal muscle of S. macrurus.
Muscle Fiber Type Is Unaffected by Changes in Neural Input
A prominent effect of electrical inactivation of hindlimb muscles in rodents and feline species is the conversion of fiber type identity whereby type I fibers suppress the expression of type I sarcomeric gene isoforms and induce the expression of type II isoforms (3, 17, 21, 46, 58). The lack of support for fiber type conversion taking place in S. macrurus after 2 and 5 days of inactivity was evident in the fiber type distribution analysis and in the absence of any hybrid muscle fiber expressing type I and type II sarcomeric MHCs based on immunolabeling. Our whole muscle tissue transcriptomes also revealed little to no changes in sarcomere isoform transcripts associated with type I or type II muscle fibers after either electrical inactivation period (Fig. 5B). Furthermore, transcription factors sensitive to electrical activity changes in mammalian muscle like the MRFs and the calcium-activated transcription factors belonging to the Mef2 (mef2c and mef2d) and the NFAT (nfatc1 to nfatc4) families were unaltered in S. macrurus. Interestingly, the expression of prdm1a, a transcription factor implicated in the induction of slow type fiber genes, was induced at both inactivation time periods in S. macrurus (Fig. 5A). However, induction of the prdm1a gene was insufficient to result in any detectable fiber type change.
Resistance of Muscle Size to Change after Elimination of Neural Activity
Electrical inactivation consistently leads to a decrease in fiber size in skeletal muscles of mammals, particularly in the hindlimb muscles of rodents (7, 21, 25, 38, 39, 46). In rodents, muscle fibers can atrophy 20% or more depending on the fiber type following 5 days of electrical inactivation (21, 46). In contrast, electrical inactivity did not lead to a significant decrease in size for either type I or type II fibers in S. macrurus. This lack of response of muscle size to neural inactivity in S. macrurus resembles that reported in some hibernating mammalian species including several species of ground squirrels, bears, and bats. These hibernating animals experience extensive periods (3–9 mo) of muscle inactivity and yet show little to no atrophy in their hindlimb muscles compared with those of other mammalian species following nonhibernation inactivity (19, 28, 32, 40, 57, 61). Even more striking is the finding that denervation of ankle muscles in hibernating bears for up to 11 wk has little effect on muscle properties (33).
In hibernating mammals, the suppressed atrophy response of inactive muscle has been linked to a lack of induction of proteolytic pathways (23, 32, 40, 64, 72). This is in contrast to the activation of two proteolytic mechanisms, the ubiquitin-proteasome and autophagy-lysosome systems, in hindlimb muscles of nonhibernating mammals after removal of electrical activity (5, 7, 46, 50, 63, 65, 74, 75). Our expression analyses showed an upregulation of genes associated with these pathways at 2 but not 5 days after spinal transection (Fig. 7). Hence, the response of S. macrurus muscle to electrical inactivity is somewhere between the opposite responses observed in hindlimb muscles of hibernating and nonhibernating mammals. The identity of the factors responsible for suppressing the atrophy response in S. macrurus ventral muscle is unclear at this point. Passive stretch of electrically inactivated muscles and fibers has been suggested to be sufficient to induce compensatory hypertrophy in electrical-inactivated muscles in at least one human patient and experimentally in chicken (6, 56). In this study, fish continued to move freely in their aquatic housings following spinal transection surgery using the muscles proximal to the transection site. The swimming movements in S. macrurus consist of synchronized undulations of the ventral muscle tissue. While segments distal to the transection site appeared immobile, we cannot completely exclude the possibility that passive muscle stretches were nonetheless present and influenced the muscle fiber response in this study.
A Shout-out for Comparative Studies
While inactivity-induced fiber type transitions and atrophy are typical of hindlimb muscles in rodents and feline species (3, 58), it is important to note that the skeletal muscle response to inactivity is not the same across muscle types even within mammals. For example, in rats the diaphragm muscle undergoes limited morphological and fiber type changes after weeks of electrical inactivity by denervation (24, 73) compared with limb skeletal muscle (30, 39, 42). Similarly, inactivity effects have been found to differ between muscles following spinal cord transection in rodent limb muscles (21, 38). Few studies have examined the role of the nervous system on muscle properties in adult teleosts. Studies in piscine species report small changes in metabolic and contractile protein content in carp (69) and few changes in MHC fiber type conversion in zebrafish (2, 45) after a 14-day denervation period. In the common carp (Cyprinus carpio), a 2 wk denervation period resulted in small changes in metabolic markers and contractile protein content (69). A similar 2 wk denervation of adult zebrafish (Brachydanio rerio) muscle led to few changes in fiber type conversion, but not in all muscle fiber types (2, 45). Together, these data underscore the need for investigations using vertebrate species and muscle groups other than those most commonly used to date (particularly hindlimb muscles in rodents) to more rigorously test the prevailing premise that nerve-dependent electrical activity is an essential regulator of the skeletal muscle phenotype. A comparative approach will be useful in understanding the cellular and molecular basis of neural remodeling among muscle groups with distinct physiological demands within and across vertebrate taxa.
GRANTS
This research was funded by National Institute of General Medical Sciences Grant 1SC1GM-092297-01A1 (G. A. Unguez), National Science Foundation INSPIRE Award CNS-1248109 (G. A. Unguez), and Howard Hughes Medical Institute Grant 5200693.
DISCLOSURES
No conflicts of interest, financial or otherwise, are declared by the author(s).
AUTHOR CONTRIBUTIONS
R.G. and G.A.U. conception and design of research; R.G., A.C., and M.P.S. performed experiments; R.G. and M.P.S. analyzed data; R.G. and M.P.S. interpreted results of experiments; R.G. prepared figures; R.G. and G.A.U. drafted manuscript; R.G., A.C., and G.A.U. edited and revised manuscript; R.G., A.C., M.P.S., and G.A.U. approved final version of manuscript.
ACKNOWLEDGMENTS
The authors thank Chiann-Ling C. Yeh for help with Fig. 7 and Iliana Hernandez for technical assistance.
REFERENCES
- 1.Allen DL, Sartorius CA, Sycuro LK, Leinwand LA. Different pathways regulate expression of the skeletal myosin heavy chain genes. J Biol Chem 276: 43524–43533, 2001. [DOI] [PubMed] [Google Scholar]
- 2.van Asselt E, van Raamsdonk W, de Graaf F, Smit-Onel MJ, Diegenbach PC, Heuts B. Enzyme histochemical profiles of fish spinal motoneurons after cordotomy and axotomy of motor nerves. Brain Res 531: 25–35, 1990. [DOI] [PubMed] [Google Scholar]
- 3.Baldwin KM, Haddad F. Effects of different activity and inactivity paradigms on myosin heavy chain gene expression in striated muscle. J Appl Physiol 90: 345–357, 2001. [DOI] [PubMed] [Google Scholar]
- 4.Bassel-Duby R, Olson EN. Signaling pathways in skeletal muscle remodeling. Annu Rev Biochem 75: 19–37, 2006. [DOI] [PubMed] [Google Scholar]
- 5.Batt J, Bain J, Goncalves J, Michalski B, Plant P, Fahnestock M, Woodgett J. Differential gene expression profiling of short and long term denervated muscle. FASEB J 20: 115–117, 2006. [DOI] [PubMed] [Google Scholar]
- 6.Bernat JL, Ochoa JL. Muscle hypertrophy after partial denervation: a human case. J Neurol Neurosurg Psychiatry 41: 719–725, 1978. [DOI] [PMC free article] [PubMed] [Google Scholar]
- 7.Bodine SC, Latres E, Baumhueter S, Lai VK, Nunez L, Clarke BA, Poueymirou WT, Panaro FJ, Na E, Dharmarajan K, Pan ZQ, Valenzuela DM, DeChiara TM, Stitt TN, Yancopoulos GD, Glass DJ. Identification of ubiquitin ligases required for skeletal muscle atrophy. Science 294: 1704–1708, 2001. [DOI] [PubMed] [Google Scholar]
- 8.Bonaldo P, Sandri M. Cellular and molecular mechanisms of muscle atrophy. Dis Model Mech 6: 25–39, 2013. [DOI] [PMC free article] [PubMed] [Google Scholar]
- 9.Bongers KS, Fox DK, Ebert SM, Kunkel SD, Dyle MC, Bullard SA, Dierdorff JM, Adams CM. Skeletal muscle denervation causes skeletal muscle atrophy through a pathway that involves both Gadd45a and HDAC4. Am J Physiol Endocrinol Metab 305: E907–E915, 2013. [DOI] [PMC free article] [PubMed] [Google Scholar]
- 10.Briguet A, Courdier-Fruh I, Foster M, Meier T, Magyar JP. Histological parameters for the quantitative assessment of muscular dystrophy in the mdx-mouse. Neuromuscul Disord 14: 675–682, 2004. [DOI] [PubMed] [Google Scholar]
- 11.Buonanno A, Apone L, Morasso MI, Beers R, Brenner HR, Eftimie R. The MyoD family of myogenic factors is regulated by electrical activity: isolation and characterization of a mouse Myf-5 cDNA. Nucleic Acids Res 20: 539–544, 1992. [DOI] [PMC free article] [PubMed] [Google Scholar]
- 12.Buonanno A, Fields RD. Gene regulation by patterned electrical activity during neural and skeletal muscle development. Curr Opin Neurobiol 9: 110–120, 1999. [DOI] [PubMed] [Google Scholar]
- 13.Burke RE, Levine DN, Salcman M, Tsairis P. Motor units in cat soleus muscle: physiological, histochemical and morphological characteristics. J Physiol 238: 503–514, 1974. [DOI] [PMC free article] [PubMed] [Google Scholar]
- 14.Burke RE, Levine DN, Tsairis P, Zajac FE. Physiological types and histochemical profiles in motor units of the cat gastrocnemius. J Physiol 234: 723–748, 1973. [DOI] [PMC free article] [PubMed] [Google Scholar]
- 15.Calabria E, Ciciliot S, Moretti I, Garcia M, Picard A, Dyar KA, Pallafacchina G, Tothova J, Schiaffino S, Murgia M. NFAT isoforms control activity-dependent muscle fiber type specification. Proc Natl Acad Sci USA 106: 13335–13340, 2009. [DOI] [PMC free article] [PubMed] [Google Scholar]
- 16.Chin ER, Olson EN, Richardson JA, Yang Q, Humphries C, Shelton JM, Wu H, Zhu W, Bassel-Duby R, Williams RS. A calcineurin-dependent transcriptional pathway controls skeletal muscle fiber type. Genes Dev 12: 2499–2509, 1998. [DOI] [PMC free article] [PubMed] [Google Scholar]
- 17.Cohen TJ, Barrientos T, Hartman ZC, Garvey SM, Cox GA, Yao TP. The deacetylase HDAC4 controls myocyte enhancing factor-2-dependent structural gene expression in response to neural activity. FASEB J 23: 99–106, 2009. [DOI] [PMC free article] [PubMed] [Google Scholar]
- 18.Collard L, Herledan G, Pincini A, Guerci A, Randrianarison-Huetz V, Sotiropoulos A. Nuclear actin and myocardin-related transcription factors control disuse muscle atrophy through regulation of Srf activity. J Cell Sci 127: 5157–5163, 2014. [DOI] [PubMed] [Google Scholar]
- 19.Cotton CJ, Harlow HJ. Avoidance of skeletal muscle atrophy in spontaneous and facultative hibernators. Physiol Biochem Zool 83: 551–560, 2010. [DOI] [PubMed] [Google Scholar]
- 20.Dubowitz V. Cross-innervated mammalian skeletal muscle: histochemical, physiological and biochemical observations. J Physiol 193: 481–496, 1967. [DOI] [PMC free article] [PubMed] [Google Scholar]
- 21.Dupont-Versteegden EE, Houlé JD, Gurley CM, Peterson CA. Early changes in muscle fiber size and gene expression in response to spinal cord transection and exercise. Am J Physiol Cell Physiol 275: C1124–C1133, 1998. [DOI] [PubMed] [Google Scholar]
- 22.Eftimie R, Brenner HR, Buonanno A. Myogenin and MyoD join a family of skeletal muscle genes regulated by electrical activity. Proc Natl Acad Sci USA 88: 1349–1353, 1991. [DOI] [PMC free article] [PubMed] [Google Scholar]
- 23.Fedorov VB, Goropashnaya AV, Stewart NC, Tøien O, Chang C, Wang H, Yan J, Showe LC, Showe MK, Barnes BM. Comparative functional genomics of adaptation to muscular disuse in hibernating mammals. Mol Ecol 23: 5524–5537, 2014. [DOI] [PMC free article] [PubMed] [Google Scholar]
- 24.Geiger PC, Bailey JP, Zhan WZ, Mantilla CB, Sieck GC. Denervation-induced changes in myosin heavy chain expression in the rat diaphragm muscle. J Appl Physiol 95: 611–619, 2003. [DOI] [PubMed] [Google Scholar]
- 25.Germinario E, Esposito A, Megighian A, Midrio M, Biral D, Betto R, Danieli-Betto D. Early changes of type 2B fibers after denervation of rat EDL skeletal muscle. J Appl Physiol 92: 2045–2052, 2002. [DOI] [PubMed] [Google Scholar]
- 26.Gomes AV, Waddell DS, Siu R, Stein M, Dewey S, Furlow JD, Bodine SC. Upregulation of proteasome activity in muscle RING finger 1-null mice following denervation. FASEB J 26: 2986–2999, 2012. [DOI] [PMC free article] [PubMed] [Google Scholar]
- 27.Gonzalez de Aguilar JL, Niederhauser-Wiederkehr C, Halter B, De Tapia M, Di Scala F, Demougin P, Dupuis L, Primig M, Meininger V, Loeffler JP. Gene profiling of skeletal muscle in an amyotrophic lateral sclerosis mouse model. Physiol Genomics 32: 207–218, 2008. [DOI] [PubMed] [Google Scholar]
- 28.Hindle AG, Otis JP, Epperson LE, Hornberger TA, Goodman CA, Carey HV, Martin SL. Prioritization of skeletal muscle growth for emergence from hibernation. J Exp Biol 218: 276–284, 2015. [DOI] [PMC free article] [PubMed] [Google Scholar]
- 29.von Hofsten J, Elworthy S, Gilchrist MJ, Smith JC, Wardle FC, Ingham PW. Prdm1- and Sox6-mediated transcriptional repression specifies muscle fibre type in the zebrafish embryo. EMBO Rep 9: 683–639, 2008. [DOI] [PMC free article] [PubMed] [Google Scholar]
- 30.Huey KA, Bodine SC. Changes in myosin mRNA and protein expression in denervated rat soleus and tibialis anterior. Eur J Biochem 256: 45–50, 1998. [DOI] [PubMed] [Google Scholar]
- 31.Krishan K, Dhoot GK. Changes in some troponin and insulin-like growth factor messenger ribonucleic acids in regenerating and denervated skeletal muscles. J Muscle Res Cell Motil 17: 513–521, 1996. [DOI] [PubMed] [Google Scholar]
- 32.Lee K, So H, Gwag T, Ju H, Lee JW, Yamashita M, Choi I. Molecular mechanism underlying muscle mass retention in hibernating bats: role of periodic arousal. J Cell Physiol 222: 313–319, 2010. [DOI] [PubMed] [Google Scholar]
- 33.Lin DC, Hershey JD, Mattoon JS, Robbins CT. Skeletal muscles of hibernating brown bears are unusually resistant to effects of denervation. J Exp Biol 215: 2081–2087, 2012. [DOI] [PubMed] [Google Scholar]
- 34.Liu Y, Shen T, Randall WR, Schneider MF. Signaling pathways in activity-dependent fiber type plasticity in adult skeletal muscle. J Muscle Res Cell Motil 26: 13–21, 2005. [DOI] [PubMed] [Google Scholar]
- 35.Love MI, Huber W, Anders S. Moderated estimation of fold change and dispersion for RNA-seq data with DESeq2. Genome Biol 15: 1–34, 2014. [DOI] [PMC free article] [PubMed] [Google Scholar]
- 36.Luo W, Brouwer C. Pathview: an R/Bioconductor package for pathway-based data integration and visualization. Bioinformatics 29: 1830–1831, 2013. [DOI] [PMC free article] [PubMed] [Google Scholar]
- 37.Medina R, Wing SS, Goldberg AL. Increase in levels of polyubiquitin and proteasome mRNA in skeletal muscle during starvation and denervation atrophy. Biochem J 307: 631–637, 1995. [DOI] [PMC free article] [PubMed] [Google Scholar]
- 38.Negredo P, Rivero JLL, González B, Ramón-Cueto A, Manso R. Slow- and fast-twitch rat hind limb skeletal muscle phenotypes 8 months after spinal cord transection and olfactory ensheathing glia transplantation. J Physiol 586: 2593–2610, 2008. [DOI] [PMC free article] [PubMed] [Google Scholar]
- 39.Niederle B, Mayr R. Course of denervation atrophy in type I and type II fibres of rat extensor digitorum longus muscle. Anat Embryol (Berl) 153: 9–21, 1978. [DOI] [PubMed] [Google Scholar]
- 40.Nowell MM, Choi H, Rourke BC. Muscle plasticity in hibernating ground squirrels (Spermophilus lateralis) is induced by seasonal, but not low-temperature, mechanisms. J Comp Physiol B 181: 147–164, 2011. [DOI] [PubMed] [Google Scholar]
- 41.O'Leary MFN, Vainshtein A, Carter HN, Zhang Y, Hood DA. Denervation-induced mitochondrial dysfunction and autophagy in skeletal muscle of apoptosis-deficient animals. Am J Physiol Cell Physiol 303: C447–C454, 2012. [DOI] [PubMed] [Google Scholar]
- 42.Patterson MF, Stephenson GMM, Stephenson DG. Denervation produces different single fiber phenotypes in fast- and slow-twitch hindlimb muscles of the rat. Am J Physiol Cell Physiol 291: C518–C528, 2006. [DOI] [PubMed] [Google Scholar]
- 43.Pette D, Vrbová G. Adaptation of mammalian skeletal muscle fibers to chronic electrical stimulation. Rev Physiol Biochem Pharmacol 120: 115–202, 1992. [DOI] [PubMed] [Google Scholar]
- 44.Pinch M, Güth R, Samanta MP, Chaidez A, Unguez GA. The myogenic electric organ of Sternopygus macrurus: a non-contractile tissue with a skeletal muscle transcriptome. Peer J 4: e1828, 2016. [DOI] [PMC free article] [PubMed] [Google Scholar]
- 45.van Raamsdonk W, Pool CW, Heyting C, TeKronnie G, Veeken K. Effects of immobilization and partial denervation on the differentiation of muscle fiber types in the Zebrafish, Brachydanio rerio. Anat Embryol (Berl) 164: 63–74, 1982. [DOI] [PubMed] [Google Scholar]
- 46.Raffaello A, Laveder P, Romualdi C, Bean C, Toniolo L, Germinario E, Megighian A, Danieli-Betto D, Reggiani C, Lanfranchi G. Denervation in murine fast-twitch muscle: short-term physiological changes and temporal expression profiling. Physiol Genomics 25: 60–74, 2006. [DOI] [PubMed] [Google Scholar]
- 47.Rana ZA, Gundersen K, Buonanno A. Activity-dependent repression of muscle genes by NFAT. Proc Natl Acad Sci USA 105: 5921–5926, 2008. [DOI] [PMC free article] [PubMed] [Google Scholar]
- 48.Rana ZA, Gundersen K, Buonanno A. The ups and downs of gene regulation by electrical activity in skeletal muscles. J Muscle Res Cell Motil 30: 255–260, 2009. [DOI] [PMC free article] [PubMed] [Google Scholar]
- 49.Rodriguez J, Vernus B, Chelh I, Cassar-Malek I, Gabillard JC, Hadj Sassi A, Seiliez I, Picard B, Bonnieu A. Myostatin and the skeletal muscle atrophy and hypertrophy signaling pathways. Cell Mol Life Sci 71: 4361–4371, 2014. [DOI] [PMC free article] [PubMed] [Google Scholar]
- 50.Sacheck JM, Hyatt JPK, Raffaello A, Jagoe RT, Roy RR, Edgerton VR, Lecker SH, Goldberg AL. Rapid disuse and denervation atrophy involve transcriptional changes similar to those of muscle wasting during systemic diseases. FASEB J 21: 140–155, 2007. [DOI] [PubMed] [Google Scholar]
- 51.Sandri M. Signaling in muscle atrophy and hypertrophy. Physiology (Bethesda) 23: 160–170, 2008. [DOI] [PubMed] [Google Scholar]
- 52.Schiaffino S, Sandri M, Murgia M. Activity-dependent signaling pathways controlling muscle diversity and plasticity. Physiology 22: 269–278, 2007. [DOI] [PubMed] [Google Scholar]
- 53.Schulte L, Peters D, Taylor J, Navarro J, Kandarian S. Sarcoplasmic reticulum Ca2+ pump expression in denervated skeletal muscle. Am J Physiol Cell Physiol 267: C617–C622, 1994. [DOI] [PubMed] [Google Scholar]
- 54.Serrano AL, Murgia M, Pallafacchina G, Calabria E, Coniglio P, Lømo T, Schiaffino S. Calcineurin controls nerve activity-dependent specification of slow skeletal muscle fibers but not muscle growth. Proc Natl Acad Sci USA 98: 13108–13113, 2001. [DOI] [PMC free article] [PubMed] [Google Scholar]
- 55.Shang FF, Zhao W, Zhao Q, Liu J, Li DW, Zhang H, Zhou XF, Li CY, Wang TH. Upregulation of eIF-5A1 in the paralyzed muscle after spinal cord transection associates with spontaneous hindlimb locomotor recovery in rats by upregulation of the ErbB, MAPK and neurotrophin signal pathways. J Proteomics 91: 188–199, 2013. [DOI] [PubMed] [Google Scholar]
- 56.Sola OM, Christensen DL, Martin AW. Hypertrophy and hyperplasia of adult chicken anterior latissimus dorsi muscles following stretch with and without denervation. Exp Neurol 41: 76–100, 1973. [DOI] [PubMed] [Google Scholar]
- 57.Steffen JM, Koebel DA, Musacchia XJ, Milsom WK. Morphometric and metabolic indices of disuse in muscles of hibernating ground squirrels. Comp Biochem Physiol B Biochem Mol Biol 99: 815–819, 1991. [DOI] [PubMed] [Google Scholar]
- 58.Talmadge RJ. Myosin heavy chain isoform expression following reduced neuromuscular activity: potential regulatory mechanisms. Muscle Nerve 23: 661–679, 2000. [DOI] [PubMed] [Google Scholar]
- 59.Tang H, Macpherson P, Marvin M, Meadows E, Klein WH, Yang XJ, Goldman D. A histone deacetylase 4/myogenin positive feedback loop coordinates denervation-dependent gene induction and suppression. Mol Biol Cell 20: 1120–1131, 2009. [DOI] [PMC free article] [PubMed] [Google Scholar]
- 60.Team RC. R: a Language and Environment for Statistical Computing. Vienna: R Foundation for Statistical Computing, 2014, http://www.r-project.org/. [Google Scholar]
- 61.Tinker DB, Harlow HJ, Beck TD. Protein use and muscle-fiber changes in free-ranging, hibernating black bears. Physiol Zool 71: 414–424, 2015. [DOI] [PubMed] [Google Scholar]
- 62.Unguez GA, Zakon HH. Reexpression of myogenic proteins in mature electric organ after removal of neural input. J Neurosci 18: 9924–9935, 1998. [DOI] [PMC free article] [PubMed] [Google Scholar]
- 63.Urso ML, Chen YW, Scrimgeour AG, Lee PC, Lee KF, Clarkson PM. Alterations in mRNA expression and protein products following spinal cord injury in humans. J Physiol 579: 877–892, 2007. [DOI] [PMC free article] [PubMed] [Google Scholar]
- 64.Vermillion KL, Anderson KJ, Hampton M, Andrews MT. Gene expression changes controlling distinct adaptations in the heart and skeletal muscle of a hibernating mammal. Physiol Genomics 47: 58–74, 2015. [DOI] [PMC free article] [PubMed] [Google Scholar]
- 65.Wang X, Blagden C, Fan J, Nowak SJ, Taniuchi I, Littman DR, Burden SJ. Runx1 prevents wasting, myofibrillar disorganization, and autophagy of skeletal muscle. Genes Dev 19: 1715–1722, 2005. [DOI] [PMC free article] [PubMed] [Google Scholar]
- 66.Warnes GR, Bolker B, Bonebakker L, Gentleman R, Huber W, Liaw A, Lumley T, Maechler M, Magnusson A, Moeller S, Schwartz M, Venables B. gplots: Various R Programming Tools for Plotting Data. 2015. http://cran.r-project.org/package=gplots. [Google Scholar]
- 67.Westgaard RH, Lømo T. Control of contractile properties within adaptive ranges by patterns of impulse activity in the rat. J Neurosci 8: 4415–4426, 1988. [DOI] [PMC free article] [PubMed] [Google Scholar]
- 68.Wiberg R, Jonsson S, Novikova LN, Kingham PJ. Investigation of the expression of myogenic transcription factors, microRNAs and muscle-specific E3 ubiquitin ligases in the medial gastrocnemius and soleus muscles following peripheral nerve injury. PLoS One 10: e0142699, 2015. [DOI] [PMC free article] [PubMed] [Google Scholar]
- 69.Wittenberger C, Coprean D. Some effects of denervation upon white and red muscles in carp. Comp Biochem Physiol A 56: 307–312, 1977. [Google Scholar]
- 70.Witzemann V, Sakmann B. Differential regulation of MyoD and myogenin mRNA levels by nerve induced muscle activity. FEBS Lett 282: 259–264, 1991. [DOI] [PubMed] [Google Scholar]
- 71.Wu H, Naya FJ, McKinsey TA, Mercer B, Shelton JM, Chin ER, Simard AR, Michel RN, Bassel-Duby R, Olson EN, Williams RS. MEF2 responds to multiple calcium-regulated signals in the control of skeletal muscle fiber type. EMBO J 19: 1963–1973, 2000. [DOI] [PMC free article] [PubMed] [Google Scholar]
- 72.Yang CX, He Y, Gao YF, Wang HP, Goswami N. Changes in calpains and calpastatin in the soleus muscle of Daurian ground squirrels during hibernation. Comp Biochem Physiol A Mol Integr Physiol 176: 26–31, 2014. [DOI] [PubMed] [Google Scholar]
- 73.Yang L, Bourdon J, Gottfried SB, Zin WA, Petrof BJ. Regulation of myosin heavy chain gene expression after short-term diaphragm inactivation. Am J Physiol Lung Cell Mol Physiol 274: L980–L989, 1998. [DOI] [PubMed] [Google Scholar]
- 74.Zeman RJ, Zhao J, Zhang Y, Zhao W, Wen X, Wu Y, Pan J, Bauman WA, Cardozo C. Differential skeletal muscle gene expression after upper or lower motor neuron transection. Pflügers Arch 458: 525–535, 2009. [DOI] [PubMed] [Google Scholar]
- 75.Zhao J, Brault JJ, Schild A, Cao P, Sandri M, Schiaffino S, Lecker SH, Goldberg AL. FoxO3 coordinately activates protein degradation by the autophagic/lysosomal and proteasomal pathways in atrophying muscle cells. Cell Metab 6: 472–483, 2007. [DOI] [PubMed] [Google Scholar]
- 76.Zhao S, Fernald RD. Comprehensive algorithm for quantitative real-time polymerase chain reaction. J Comput Biol 12: 1047–1064, 2005. [DOI] [PMC free article] [PubMed] [Google Scholar]