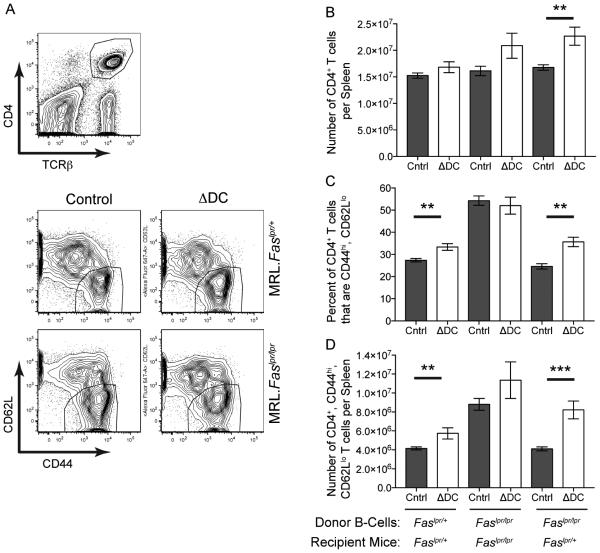
Figure 5. Recipient Mice Lacking Fas and/or Dendritic Cells Have Higher Numbers of Activated CD4+ T Cells than Control Mice.
Splenic T cells from experimental mice shown in Figures 2-4 were analyzed by flow cytometry.
(A) Representative sample showing the gating of live splenocytes for CD4+, TCRβ+ cells (top) that were further sub-gated (bottom) by their activation markers (CD44hi, CD62Llo).
(B) Number of CD4+, TCRβ+ cells per spleen.
(C) Percent of CD4+, TCRβ+ cells that are activated (CD44hi, CD62Llo).
(D) Number of CD4+, TCRβ+, CD44hi, CD62Llo cells per spleen. ΔDC, mice that lack cDCs; Cntrl, littermate controls. Bars represent mean and SEM. **p < 0.01; ***p < 0.001 by Mann-Whitney U test. See also Figure S6.

