Abstract
Antibody-drug conjugates (ADCs) are designed to target antigen expressing (Ag+) cells in a tumor. Once processed by the Ag+ cells, ADCs can release cytotoxic drug molecules that can diffuse out of Ag+ cells into the neighboring antigen-negative (Ag−) cells to induce their cytotoxicity. This additional efficacy of ADCs on Ag− cells in the presence of Ag+ cells is known as the `bystander effect'. Although the importance of this phenomena is widely acknowledged for effective killing of a heterogeneous tumor, the rate and extent of the bystander killing in a heterogeneous system is not quantitatively understood yet. Thus, the objectives of this manuscript were to: 1) synthesize and characterize a tool ADC Trastuzumab-vc-MMAE that is capable of exhibiting bystander effect, 2) quantify the time course of the bystander effect for the tool ADC using in vitro co-culture systems created using mixture of various HER2-expressing cell lines, and 3) develop a pharmacodynamic (PD) model that is capable of characterizing the bystander effect of ADCs. Co-culture studies conducted using GFP labelled MCF7 cells as Ag− cells and N87, BT474, and SKBR3 as Ag+ cells revealed that the bystander effect of ADC increases with increasing fraction of Ag+ cells in a co-culture system, and with increased expression level of target on Ag+ cells. A notable lag time after ADC incubation was also observed prior to significant bystander killing of Ag− cells. Based on our results we hypothesize that there may be other determinants apart from the antigen expression level that can also influence the ability of Ag+ cells to demonstrate the bystander effect in a co-culture system. The co-culture analysis also suggested that the bystander effect of the ADC can dissipate over the period of time as the population of Ag+ cells declines. A novel PD model was developed to mathematically characterize the bystander effect of ADCs by combining two different cell distribution models to represent the population of Ag+ and Ag− cells in a co-culture system. This PD model can be integrated with the systems PK model for ADCs in the future to generate a quantitative framework that is capable of supporting the discovery and development of novel ADCs with optimal bystander killing capabilities.
Keywords: Antibody-Drug Conjugates, Bystander Effect, Co-culture System, Pharmacodynamic Modeling, Tumor Heterogeneity
INTRODUCTION
Antibody-drug Conjugates (ADCs) are promising therapeutic agents designed to selectively target and kill cancerous cells [1]. There are more than 55 ADCs in the clinic right now for the treatment of various oncology indications [2]. A typical ADC consists of monoclonal antibody (mAb) and cytotoxic drug molecules conjugated via chemical linker that is designed to release the drug specifically inside the target expressing cells. The exact number of drug molecules attached on mAb differs between different ADC molecules, and the average number of drug molecules attached on antibody is known as the average Drug-to-Antibody Ratio (DAR) [3]. ADCs act via binding to the targeted antigen on the surface of a cancer cells, which leads to ADC internalization via receptor mediated endocytosis. Once inside the cells the ADC molecules degrade and releases the pharmacologically active drug in the cytoplasm, which leads to the cytotoxicity. This ability to delivery potent anticancer drug molecules specifically inside the tumor cells is believed to provide ADCs a superior therapeutic index compared to traditional non-targeted chemotherapeutic agents [4].
In the past 5 years, two ADCs have been approved by FDA. Brentuximab vedotin (SGN-35), an anti-CD30-vc-MMAE conjugate (Adcetris®, Seattle Genetics) for the treatment of Hodgkin's lymphoma (HL) and Anaplastic large cell lymphoma (ALCL) [5], and ado-trastuzumab-emtansine (T-DM1), an anti-HER2-smcc-DM1 conjugate (Kadcylla®, Genentech) for the treatment of trastuzumab-refractory metastatic breast cancer [6]. Both the ADCs are designed via random conjugation and employs drug molecules (i.e. MMAE and DM1) that are potent microtubule inhibitors [7] [8]. However, the chemical nature of the linkers used in SGN-35 and T-DM1 are very distinct. T-DM1 is designed with a non-cleavable SMCC linker that becomes part of the released drug when the ADC gets metabolized via lysosomal degradation. T-DM1 releases several DM1 containing catabolites intracellularly that are attached with linker and amino acid residues, of which lysine-mcc-DM1 is the predominant catabolite that is highly charged and demonstrates very low cell permeability [9]. On the contrary, SGN-35 is designed with a cleavable valine-citrulline linker which gets cleaved by intracellular cathepsin B enzyme in endosomes/lysosomes, releasing the unmodified drug molecule MMAE in the cytoplasm. The released MMAE is shown to be relatively more permeable across the cell membrane, and thus capable of diffusing into the neighboring cells to cause additional cell killing. This phenomena has been termed as the `bystander effect' of ADCs [10,11].
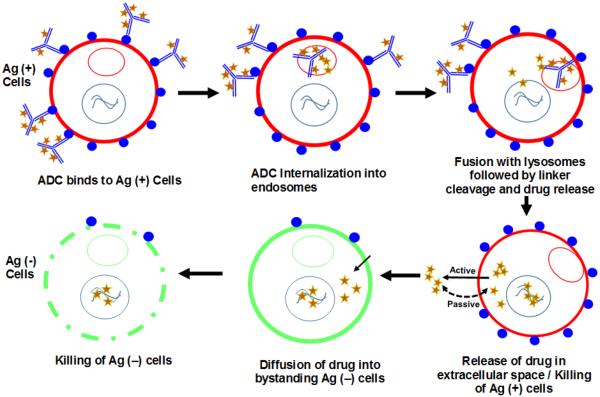
Figure 1 illustrates the bystander effect of ADCs in a heterogeneous population of antigen-positive (Ag+) and antigen-negative (Ag−) cells in the tumor. Majority of ADC molecules bind to Ag+ cells followed by internalization into endosomes and trafficking to lysosomes where ADC is metabolized. Free cytotoxic drug molecules are released in the cytoplasm where they can either bind to the target or can exit (via active or passive routes) out of the cell and diffuse into neighboring Ag− cells, where they can exert the cytotoxic effect. This enhanced killing of neighboring Ag− cells can eventually lead to a higher overall efficacy of the ADC, and has been proposed to be of clinical significance for tumors demonstrating heterogeneity in target expression or heterogeneous distribution of ADCs in the tumor [10,12]. In fact, increased prevalence of intratumoral heterogeneity has huge implications for antibody therapeutics that generally targets a specific antigen expressed only on a sub-population of cells in the tumor [13]. For example, for molecules targeting HER2 antigen it has been reported that increased intratumoral heterogeneity leads to increased chances of tumor relapse with a monotherapy and decreased disease-free survival rates [14]. Thus, an ability to demonstrate significant bystander effect can be an important virtue of successful ADCs. It has been reported that the choice of an optimal drug-linker combination is an important determinant of bystander effect, and highly permeable toxins (e.g. MMAE or DM4) conjugated with cleavable linkers (e.g. disulphide or valine-citrulline) have been indicated to exhibit successful bystander killing [10,15–19]. Consequently, majority of the current ADCs in the clinical trials employ vc-MMAE or similar linker-payload combinations capable of releasing the free drug molecules inside the cells that can render the bystander effect [1,2]. Despite the consensus on the importance of the bystander effect, however, a quantitative understanding about the time-course and extent of bystander effect of ADCs in a heterogeneous system with different ratios of Ag+ and Ag− cells is lacking. In this manuscript, we have tried to further understand this phenomena using in vitro experiments and mathematical modeling.
Figure 1.
Schematic narrating the mechanism of bystander effect induced by ADCs in a heterogeneous population of antigen-positive (Ag+) and antigen-negative (Ag−) cells.
Here we have synthesized and characterized a HER2 targeting ADC, trastuzumab-vc-MMAE (T-vc-MMAE) with an average DAR of ~4.0, which is capable of releasing the attached drug MMAE in a pure form inside the cell. This tool ADC is used to investigate the time course of bystander killing of Ag− cells in an in vitro co-culture system containing different Ag+ cells with varying degree of antigen expression level. Finally, an in vitro pharmacodynamic (PD) model was developed to quantitatively characterize the bystander effect of ADCs by combining two different cell distribution models that could represent the population of Ag+ and Ag− cells with differential sensitivity to T-vc-MMAE.
MATERIALS AND METHODS
Synthesis and Characterization of Trastuzumab-vc-MMAE
Preparation of T-vc-MMAE
5 mg/mL of trastuzumab (Herceptin®, Genentech) in Dulbecco's phosphate-buffered saline (DPBS, without Ca2+ and Mg2+) was partially reduced by incubating with ~2.5 molar equivalents of tris(2-carboxyethyl) phosphine (TCEP) for 2 hr at 37°C. Following the reduction the concentration of free thiol groups per antibody was measured using Ellman's reagent (DTNB, 5, 5-dithiobis (2-nitrobenzoic acid)). Around 8 molar equivalents of maleimidocaproyl-Val-Cit-MMAE (vc-MMAE) was added to the reduced antibody and incubated at 25°C for 2 hr. At the end of the reaction the excess linker-payload (vc-MMAE) was separated from the conjugated antibody using Sephadex G-25 column (GE®, Life Sciences). The purified T-vc-MMAE was concentrated and stored at 4°C for further use. Average DAR for the ADC was calculated using the ratio of UV absorbance (R) measured at 248 and 280 nm wavelengths, according to the following equation.
| (1) |
Where, ϵ refers to extinction coefficients specific to drug ( and ) and antibody ( and ) respectively.
Hydrophobic Interaction Chromatography (HIC)
Average DAR value for T-vc-MMAE was confirmed by performing HIC analysis using an HPLC system (Agilent Technologies®) coupled to a UV detector set at the room temperature. A TSKButyl-NPR 2.1 × 4.6 mm column (Tosoh® bioscience) was used with the mobile phase-A consisting of 1.5 M ammonium sulfate in 25 mM potassium phosphate (pH 7.0), and mobile phase-B consisting of a mixture of 25 mM potassium phosphate and 25% isopropanol (pH 7.0). Separation was obtained with a linear gradient of 0–100% for mobile phase B over 12 min at a flow rate of 0.8 mL/min. T-vc-MMAE was injected at the concentration of 2 mg/ml (in PBS) and the data was analyzed by integrating the absorbance peak areas (A214 nm) for different DAR species at 214 nm. Average DAR calculated using the following equation:
| (2) |
Where, n refers to the individual DAR value and ADARn refers to the peak area for the respective DAR species in a sample.
Size Exclusion Chromatography (SEC)
Potential of any aggregate formation while synthesizing T-vc-MMAE was assessed by performing a SEC on an HPLC system (Agilent Technologies®). Samples (30 μg each) of trastuzumab and T-vc-MMAE were analyzed using Superdex 200 Increase 10/300 GL column (GE®, Life Sciences) at room temperature. Samples were eluted at a flow rate of 0.35 ml/min with 0.2M Sodium Phosphate buffer as the mobile phase and the elution was monitored at 280 nm.
Evaluation of Antibody and ADC Binding to HER2 using Flow Cytometer
Binding properties of T-vc-MMAE were compared with the naked trastuzumab using HER2 expressing BT474 cells (ATCC®). Cell suspensions of ~0.2 million cells in PBS (with 0.5% BSA) were incubated with 10μg/mL of either trastuzumab or T-vc-MMAE for 1h at 4°C. Cells were washed three times with ice cold PBS followed by incubation with FITC-labeled anti-human IgG for 30 mins. After one more washing step, cells were finally resuspended in PBS (with 0.5% BSA) and analyzed using BD FACS Scan flow cytometer with Cell Quest software.
Cell Lines
MCF7 cells, stably transfected to express the green fluorescent protein (GFP), were acquired from Cell Biolabs Inc., and are referred to as GFP-MCF7 cells (see Supplementary Figure S1B for the microscopic image). These cells have minimal expression of HER2 and are used as Ag− cells for all the co-culture experiments. GFP-MCF7 cells were grown in DMEM (high glucose) supplemented with 10% fetal bovine serum (FBS), 0.1 mM MEM Non-essential Amino Acids (NEAA), 2mM L-glutamine and 1% Penicillin-Streptomycin (Life technologies®). N87, BT-474, SKBR3, MDA-MB-453, and unlabeled MCF7 cells were obtained from ATCC and were grown in the recommended cell culture medium supplemented with heat-inactivated 10% v/w fetal bovine serum (FBS; Gibco- Life Technologies) and 10μg/mL of Gentamycin (Sigma, St. Louis, MO) at 37°C in a humidified incubator containing 5% CO2.
Standard Curves to Quantify Different Cell Populations in a Co-Culture System
To quantify the cell numbers of Ag− and Ag+ cells in a co-culture system, generalized standard curves were generated for each type of cells using 20 different experiments. Total cell viability in a culture was assessed by performing the MTT assay [20]. 5 mg/mL solution of MTT (3-(4,5-dimethylthiazol-2-yl)-2.5-diphenyl-2H-tetrazolium bromide, Alpha Aesar) in sterile phosphate buffer saline (pH 7.4) was freshly prepared and 25μL of the solution was added in each well of the 96-well plate containing cell standards in 100 μL of media. After 4.5 hr of incubation in the incubator, 100 μL of 10% SDS-0.01 M HCL solution was added to each well and plates were incubated overnight to dissolve the purple formazan crystals. UV absorbance was read at 595 nm (OD595) using Spectramax plate reader (Molecular Devices, CA). A quantitative relationship between total cell number and OD595 was established, which was further used to interpolate the total number of cell based on the measured OD595 value. Number of GFP-MCF7 cells in a culture were assessed by measuring the extent of fluorescence (FL) at 485/535 nm (excitation/emission). A quantitative relationship between total number of GFP-MCF7 cells and FL was established, which was further used to interpolate the total number of GFP-MCF7 cell based on the measured FL value.
Cytotoxicity Studies
Effect of T-vc-MMAE on N87 and GFP-MCF7 monoculture viability
Effect of T-vc-MMAE on the viability of GFP-MCF7 (Ag− cells) and N87 cells (Ag+ cells) was assessed in the 96 well plate format. For both the cell lines five 96-well plates were prepared by adding approximately 10,000 cells in 100μL of fresh media per each well. Following overnight incubation media was removed from each plate and replaced with media containing T-vc-MMAE at nine different concentrations ranging from ~0.01pM to 1500 nM. Each concentration was tested in six replicates. For each cell line, 1 plate was terminated at 12, 24, 72, 96 and 144 hr after the drug exposure, and cell viability was measured using MTT or fluorescent assay. Previously established standard curves were used to calculate the number of viable cells per each well.
Effect of T-vc-MMAE on the viability of GFP-MCF7 cells in a co-culture with N87 cells
Two different sets of experiments were conducted to quantify the bystander effect of T-vc-MMAE in a co-culture system containing N87 and GFP-MCF7 cells. In the first set of experiment, different concentrations of T-vc-MMAE were studied on a single co-culture ratio of GFP-MCF7 and N87 cells, whereas for the second set of experiments a single concentration of T-vc-MMAE was studied in different co-culture ratios of GFP-MCF7 and N87 cells.
For the first set of experiment, GFP-MCF7 cells were seeded in two 96-well plates at a total density of ~2500 cells/well. One plate served as control, whereas in the other plate additional ~22,500 N87 cells/well were added, resulting in the final ratios of GFP-MCF7: N87 cells 1:9. After overnight attachment, media was removed from all the wells and 100μL of fresh media containing nine different concentrations of T-vc-MMAE in the range of 0.1 pM to 1000 nM was added. Each concentration was tested in replicates of six. Cell viability of GFP-MCF7 cells was quantified at different time points based on fluorescence.
In the second set of experiments co-cultures of GFP-MCF7 and N87 cells at six different ratios (100:0, 90:10, 75:25, 50:50, 25:75, 10:90 and 0:100) were seeded in a single 96 well plate, while maintaining the total cell density of ~10,000 cells/well. After overnight attachment, media was removed and half of the wells were treated with fresh media containing 100nM of T-vc-MMAE, whereas the rest of the wells were replaced with fresh media alone and marked as the control group. The concentration of T-vc-MMAE is chosen based on the first co-culture study to make sure that at this concentration the ADC does not show significant killing of GFP-MCF7 cell by direct effect and shows maximum killing of N87 cells. Each co-culture ratio was tested in six wells. Number of viable GFP-MCF7 cells were quantified at different time points based on fluorescence.
Evaluation of T-vc-MMAE bystander effect in co-cultures of GFP-MCF7 cells with other Ag+ cells
Two different sets of experiments were conducted to quantify the bystander effect of T-vc-MMAE on GFP-MCF7 cells in a co-culture system with other HER2+ cells. In the first set of experiments different ratios of GFP-MCF7:BT474 and GFP-MCF7:SKBR3 cells in a co-culture system were studied at a single concentration of T-vc-MMAE. Whereas, in the second set of experiments the bystander effect of T-vc-MMAE was investigated at a single concentration on the co-cultures of GFP-MCF7 cells with BT474, SKBR3, N87, MDA-MB-453, or unlabeled MCF7 cells, prepared at 50:50 ratio.
For the first set of experiments GFP-MCF7 cells were incubated with BT474 or SKBR3 cells in separate 96 well plates at six different ratios (100:0, 90:10, 75:25, 50:50, 25:75, 10:90 and 0:100), to achieve a total cell density of ~10,000 cells/well. After overnight attachment, half of the wells in each plates were treated with media containing 500 nM of T-vc-MMAE, whereas the rest of the wells were replaced with fresh media and used as the control group. The concentration of T-vc-MMAE is chosen to ensure minimum direct killing of GFP-MCF7 cell and maximum killing of Ag+ cells. All the co-culture ratios were tested in six replicate wells. Number of viable GFP-MCF7 cells were quantified at different time points based on fluorescence.
For the second set of experiment a single 96 well plate was seeded with co-cultures of GFP-MCF7 cells with BT474, SKBR3, N87, MCF7 (no label) and MDA-MB-453 at a single ratio of 50:50 with the total cell density of ~10,000 cells/well. After overnight cell attachment, half of the wells in the plate were treated with 100 μL of media containing 100 nM T-vc-MMAE, whereas the rest of the wells were replaced with fresh media. All the co-culture ratios were tested in six replicate wells. Number of viable GFP-MCF7 cells were quantified at different time points based on fluorescence.
Quantification of the bystander effect
A novel parameter, “φBE” coined as the Bystander Effect Coefficient was proposed to quantify the extent of bystander effect by the ADC with increasing fraction of Ag+ cells in a co-culture system. The parameter φBE can be calculated as follows:
| (3) |
| (4) |
In equation-3, AUEC refers to the `area under the effect curve' for cell number vs. time profiles of Ag− cells in any experiment. The expression, βGroup calculates the percentage decrease in the AUEC (or decrease in cell viability) for an ADC treatment group compared to the untreated control group in any experiment. Since ADC treatment can also have some effect on the viability of Ag− cells in a monoculture system, this effect was corrected using the equation-4. This step essentially subtracts the observed percentage decrease in AUEC of Ag− cells when treated with the ADC in a monoculture system from the observed percentage decrease in AUEC of Ag− cells when treated with the same concentration of ADC in a co-culture system. Thus, the parameter provides accurate estimation of the bystander effect of the ADC at any given ratio of Ag− and Ag+ cells irrespective of the ADC concentration used for treatment.
Mathematical Modeling of the Bystander Effect
Datasets from the cytotoxicity studies conducted on GFP-MCF7 and N87 cells were utilized for building the mathematical model to characterize the in vitro bystander effect of T-vc-MMAE. First, the cytotoxic effect of T-vc-MMAE on GFP-MCF7 and N87 monocultures was characterized individually using a PD model, and later the individual models for GFP-MCF7 and N87 cells were combined in a semi-mechanistic manner to develop a PD model that can characterize the bystander effect of the ADC in co-culture system.
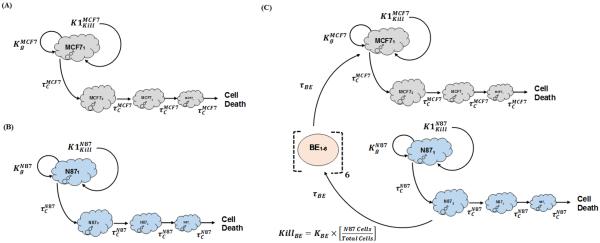
Cytotoxicity of T-vc-MMAE in GFP-MCF7 and N87 monoculture systems was characterized using similar PD models, as shown Figure 2A and 2B. Growth profile of each cell line () was characterized using a saturable growth equation, which is a function of the cell doubling time (DTCell) and upper limit of cell count per each well (CellMax) (see equation-5). Cytotoxic effect of T-vc-MMAE on each cell line () was characterized using a non-linear equation, which is a function of the maximal killing rate (Kmaxcell), a sigmoidicity factor (γCell), and the concentration of T-vc-MMAE responsible for 50% of maximum cell killing () (see equation-6). It was assumed that upon exposure to T-vc-MMAE, a proportion of the proliferating cells transit through a cascade of non-proliferating transduction steps () before they are eliminated from the system. Thus, total number of viable cells at a particular time were assumed to the sum of proliferating as well as non-proliferating cells (TCCell). This PD model is also referred to as the cell distribution model [21,22]. The proposed PD model was fitted individually to the cytotoxicity data from GFP-MCF7 and N87 cells to obtain cell line specific parameter estimates. A general scheme of model equations associated with this model are listed below:
| (5) |
| (6) |
| (7) |
| (8) |
| (9) |
Above, `j' signifies the cell distribution compartment number, usually ranging from 1 to 3. `cell(0)' represents the initial cell seeding density, and `TCCell' represents the total number of viable cells at a given time.
Figure 2.
Model diagrams for in vitro PD models used to characterize the cytotoxic effects of T-vc-MMAE on: (A) GFP-MCF7 cells (B) N87 cells, and (C) co-cultures of N87 and GFP-MCF7 cells. See the text for explanation of the symbols.
The bystander effect of T-vc-MMAE on Ag− cells was quantitatively characterized by fitting the observed cytotoxicity data from GFP-MCF7 and N87 co-culture studies using the model structure showed in Figure 2C. The bystander effect PD model was developed by combining the individual cell line PD models using an additional killing function (KillBE), which was assumed to be driven by fraction of Ag+ (N87) cells present in a co-culture system. This killing function provides additional killing to Ag− cells, and goes through a series of transduction steps (τBE) to mimic the observed delay in the bystander effect of T-vc-MMAE on GFP-MCF7 cells. In order to develop the bystander effect PD model, all the parameters associated with the individual cell line PD model were fixed, and only the two parameters associated with bystander effect (i.e. KBE,τBE) were estimated. Equations associated with the proliferation of N87 and GFP-MCF7 cells in a co-culture system are as described below:
| (10) |
| (11) |
| (12) |
| (13) |
Above, cell line specific growth ( and ) and killing ( and ) functions are identical to as described in equation-5 and 6. T_Cell(0) and %N87 refer to the initial total cell seeding density and percentage of N87 cells in a co-culture system, respectively. Equations associated with the cellular distribution phase that occurs following T-vc-MMAE exposure to N87 or GFP-MCF7 cells were similar to as shown in equation-8.
Equations related to the bystander killing and its associated transduction steps are as listed below:
| (14) |
| (15) |
| (16) |
Above, `k' refer to the number of bystander killing compartment (`BE' in Figure 2C), which ranges from 1 to 5.
All the model fittings were performed using maximum likelihood (ML) estimation method in ADAPT-5 software [23] (BMSR, CA) with a following variance model:
| (17) |
Where, `σintercept' refers to the additive error to the data and `σslope' refers to the proportional error to the model output.
Results
Synthesis and Characterization of Trastuzumab-vc-MMAE
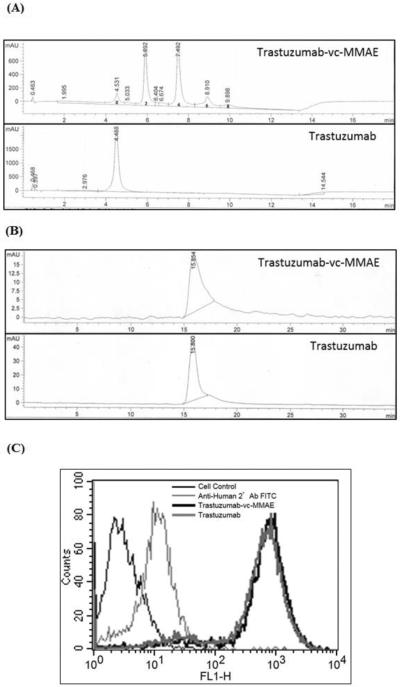
Figure 3A provides the HIC profiles for the T-vc-MMAE ADC and unconjugated trastuzumab. Based on this profile and the UV absorbance ratio method (equation-1 and 2), the average DAR for the T-vc-MMAE ADC was found to be ~4. SEC profiles for T-vc-MMAE ADC and unconjugated trastuzumab are shown in Figure 3B, which suggest the absence of any aggregation in the T-vc-MMAE formulation. Figure 3C provides the data from the flow cytometry experiment, which shows that the binding of T-vc-MMAE and trastuzumab was identical to the HER2 expressing cells. Thus, the data from Figure 3 collectively proves that we were able to successfully produce the T-vc-MMAE ADC.
Figure 3.
Characterization of T-vc-MMAE ADC. (A) Hydrophobic Interaction Chromatography (HIC) analysis of trastuzumab and T-vc-MMAE ADC used for calculation of DAR. (B) Size Exclusion Chromatography (SEC) analysis of trastuzumab and T-vc-MMAE ADC used to assess aggregation in the formulation. (C) Flow cytometry analysis to assess the binding of T-vc-MMAE ADC (in black) and trastuzumab (in dark grey) on HER2 expressing BT474 cells.
Standard Curves to Quantify Different Cell Populations in a Co-Culture System
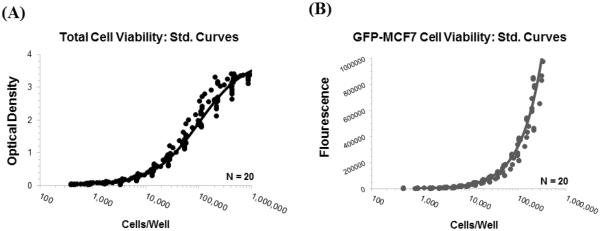
Figure 4A shows 20 different standard curves for `OD vs. total cell number' relationships generated at different days superimposed over each other, along with the model fitted line generated using the following function:
| (18) |
Equation 18 was used to calculate the total cell numbers per well for the rest of the experiments based on the observed OD values.
Figure 4.
Standard curve profiles generated to help calculate number of viable cells per well of a 96-well plate: (A) Observed (symbols) and model fitted (line) `optical density vs. cell number per well' profiles generated using MTT assay. (B) Observed (symbols) and model fitted (line) `fluorescence vs. cell number per well' profiles generated for GFP-MCF7 cells by measuring the extent of fluorescence per well.
Figure 4B shows 20 different standard curves for `FL vs. cell number' relationships generated at different days superimposed over each other, along with the model fitted line generated using the following function:
| (19) |
Equation 19 was used to calculate the number of GFP-MCF7 cells per well for the rest of the experiments based on the observed FL values.
Cytotoxicity Studies
Effect of T-vc-MMAE on N87 and GFP-MCF7 monoculture viability
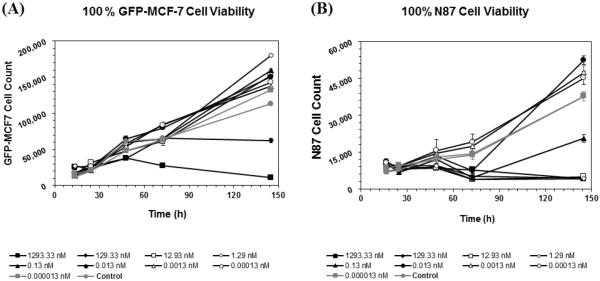
Figure 5A and 5B shows the effect of T-vc-MMAE on the viability of GFP-MCF7 and N87 cells at nine different concentrations. As shown in Figure 5A, T-vc-MMAE was not efficacious against GFP-MCF7 cells at most of the concentrations. Only the highest two concentrations of T-vc-MMAE tested (>100 nM) were able to induce cytotoxicity in the low HER2 expressing GFP-MCF7 cells, which can be either due to the entry of the ADC inside the cells via small number of HER2 receptors present on the cell surface or via non-specific pinocytosis of the ADC inside the cells at these high concentrations. In general, the cytotoxic effect of the ADC on GFP-MCF7 cells was also delayed by several hours after the incubation of the ADC. To assess the toxicity of ADC components on GFP-MCF7 cells additional cytotoxicity experiment was conducted, where the GFP-MCF7 cells were incubated with different concentrations of Trastuzumab, Trastuzumab-vc-MMAE, and free MMAE for 96 h (see Supplementary Figure S3). Naked trastuzumab, which would serve as the unconjugated antibody control, showed no efficacy at any concentration, whereas the free MMAE (unconjugated drug control) showed significantly higher efficacy at all concentrations greater than 1 pM. As shown in Figure 5B, T-vc-MMAE ADC caused rapid killing of high HER2 expressing N87 cells at all concentrations above 0.1 nM (i.e. at concentrations 1000 times less than efficacious concentrations in GFP-MCF7 cells).
Figure 5.
Cell viability profiles for (A) GFP-MCF7 and (B) N87 monoculture cells after treatment with various concentrations of T-vc-MMAE ADC.
Effect of T-vc-MMAE on the viability of GFP-MCF7 cells in a co-culture with N87 cells
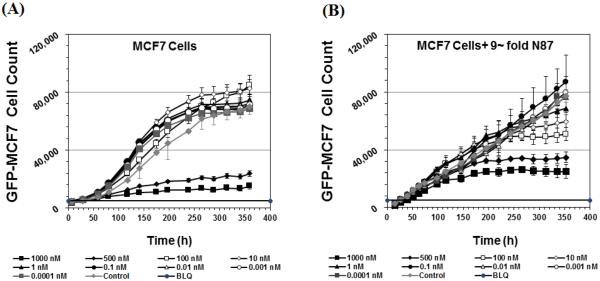
Figure 6A and 6B shows the cytotoxicity of T-vc-MMAE on GFP-MCF7 cells at nine different concentrations in the absence or presence of 9-fold excess N87 cells. As shown in Figure 6A, the efficacy of T-vc-MMAE on GFP-MCF7 cells was limited to the highest two concentrations and started after couple of days of ADC incubation, which is similar to the results shown in Figure 5A. However, in the co-culture system when 9-fold higher N87 cells were present (Figure 6B), the cytotoxicity of the ADC on GFP-MCF7 cells at the highest two concentrations was further delayed, and later in the study all the concentrations at or above 1nM started showing cytotoxicity.
Figure 6.
Cell viability profiles after treatment with various concentrations of T-vc-MMAE for GFP-MCF7 cells in the (A) absence or (B) presence of 9-fold excess N87 cells.
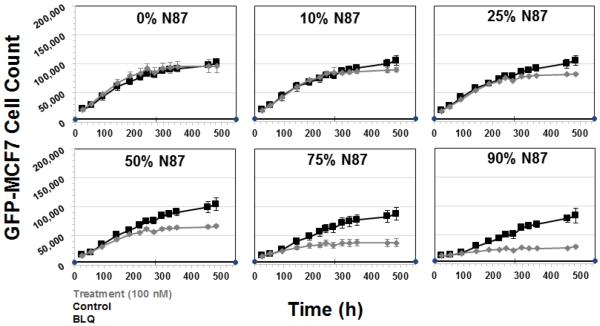
Based on the above mentioned results, a treatment concentration of 100 nM was chosen for T-vc-MMAE to further investigate the extent of the bystander effect by the ADC on different ratios of GFP-MCF7 and N87 cells in a co-culture. The concentration of 100 nM was chosen for T-vc-MMAE because it was below the IC50 of the ADC in GFP-MCF7 cells and much higher than the IC90 of the ADC (i.e. very cytotoxic) for N87 cells. As shown in Figure 7, at 100 nM concentration T-vc-MMAE was not efficacious in GFP-MCF7 cells (shown in 0% N87 panel), whereas the efficacy of 100 nM ADC for GFP-MCF7 cells increased with increasing fraction of N87 cells in the co-culture system. From the Figure 7 it also seemed like there was an apparent differences in the growth profiles of GFP-MCF7 cells between different co-culture ratios, however it was just an artifact of the different initial seeding densities of GFP-MCF7 cells. A simple exponential growth function with the same growth rate and different initial cell numbers was able to recapitulate the observed seemingly different growth profiles in different co-culture ratios very well (see Supplementary Figure S2). The value of Bystander Effect Coefficient (φBE) was found to be 9%, 16%, 30%, 49% and 57% for the co-cultures containing 10%, 25%, 50%, 75% and 90% of N87 cells.
Figure 7.
Cell viability profiles for GFP-MCF7 cells in co-cultures with increasing percentage of N87 cells. Black lines represent control group without ADC treatment and the gray lines represent the group treated with 100 nM T-vc-MMAE ADC.
Using an additional cytotoxicity study with 50:50 co-culture of GFP-MCF7 and N87 cells, we have shown that when T-vc-MMAE concentration is ≥100 nM there is a complete killing of N87 cells (See Supplementary Figure S4). This result supports the notion that the bystander effect in Ag− GFP-MCF7 cells was not observed at the expense of reduced efficacy of Ag+ N87 cells.
Evaluation of T-vc-MMAE bystander effect in co-cultures of GFP-MCF7 cells with other Ag+ cells
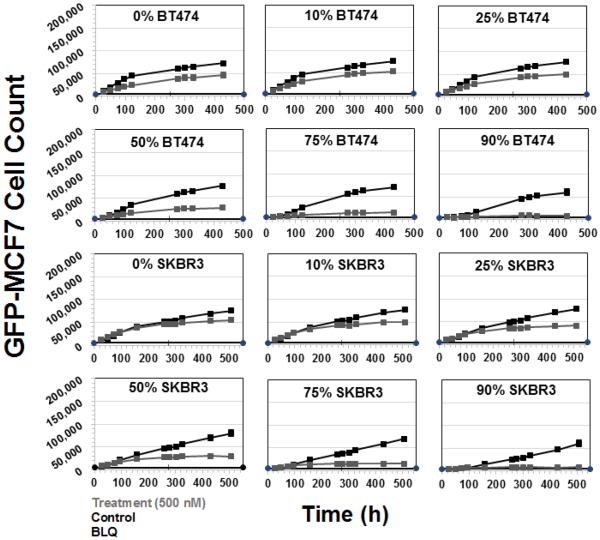
Figure 8 shows the cytotoxicity of T-vc-MMAE ADC on GFP-MCF7 cells at the concentration of 500 nM in co-culture with HER2-overexpressing BT474 or SKBR3 cells. The concentration of 500 nM was chosen based on our preliminary data to ensure minimum direct killing of GFP-MCF7 cells and maximum direct killing of BT474 and SKBR3 cells. As shown in the Figure 8, for both BT474 and SKBR3 co-culture systems increasing the fraction of Ag+ cells led to increased efficacy of T-vc-MMAE for GFP-MCF7 cells. While there was a slight direct toxicity of T-vc-MMAE on GFP-MCF7 cells at the high concentration of 500 nM, it was accounted for while calculating the Bystander Effect Coefficient (φBE) for the co-culture system. The extent of bystander effect for the BT474 co-culture system was found to be 17%, 34% and 39% for the co-culture with 50%, 75% and 90% of BT474 cells. Likewise, the extent of bystander effect for the SKBR3 co-culture system was found to be 7%, 18%, 32%, 48% and 58% for co-cultures with 10%, 25%, 50%, 75% and 90% of SKBR3 cells.
Figure 8.
Cell viability profiles for GFP-MCF7 cells in co-cultures with increasing percentage of BT474 cells (upper two rows) and SKBR3 cells (lower two rows). Black lines represent control group without ADC treatment and the gray lines represent the group treated with 500 nM T-vc-MMAE ADC.
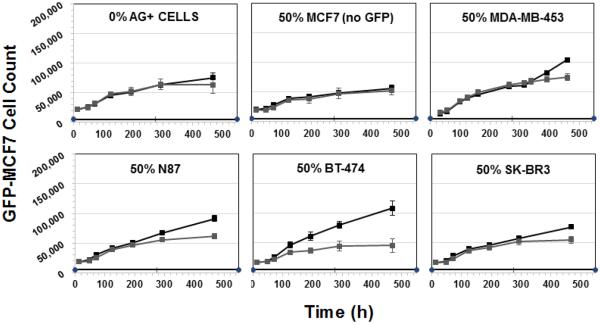
Figure 9 shows the extent of bystander effect of T-vc-MMAE ADC on GFP-MCF7 cells, in co-cultures with several cell lines expressing varying levels of HER2, at a single ratio of 50:50. A collection of HER2 low expressing (unlabeled MCF7 cells), moderate expressing (MDA-MB 453) and high expressing (N87, BT474 and SKBR3) cell lines were chosen to obtain a range of bystander effect. The ADC concentration chosen for this experiment was 100 nM to ensure minimum direct killing of GFP-MCF7 cells and maximum direct killing of all Ag+ cells. The Bystander Effect Coefficient (φBE) was found to be 1% for unlabeled MCF7 cells, 3.6% for MDA-MB 453 cells, 12% for SKBR3 cells, 16% for N87 cells, and 41% for BT474 cells. Of note, while the bystander effect increased with increasing expression of HER2 in cell lines, the extent of bystander effect was not exactly similar between cell lines expressing similar levels of HER2.
Figure 9.
Cell viability profiles for GFP-MCF7 cells in co-cultures with 0% Ag+ cells, 50% unlabeled MCF7 cells, 50% MDA-MB-453 cells, 50% N87 cells, 50% BT474 cells, and 50% SKBR3 cells. Black lines represent control group without ADC treatment and the gray lines represent the group treated with 100 nM T-vc-MMAE ADC.
Mathematical Modeling of the Bystander Effect
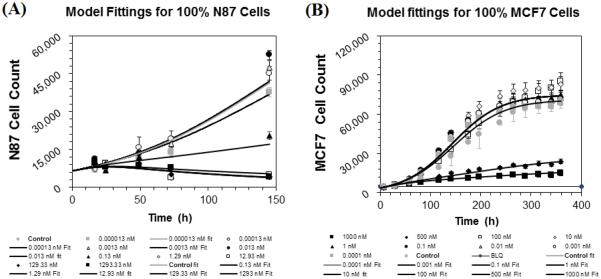
Figure 10A and 10B shows the observed and model predicted `cell number vs. time' profiles, obtained after incubating different concentrations of T-vc-MMAE ADC with GFP-MCF7 and N87 monoculture systems, superimposed over each other. The PD model used for each cell line was able to capture all the cytotoxicity profiles reasonably well. The estimated values of model parameter along with the CV% are provided in the Table 1. The estimated doubling time for each cell line was found to be very similar to the observed values (see Supplementary Figure S1).
Figure 10.
Observed (symbols) and PD model predicted (lines) cell viability profiles for (A) N87 and (B) GFP-MCF7 monoculture cells after treatment with various concentrations of T-vc-MMAE ADC.
Table 1.
A list of parameters used for the development of the bystander effect PD model and their estimated values.
| Parameters | Units | Description | Estimate (%CV) |
|---|---|---|---|
| KmaxN87, KmaxMCF7 | 1/hr | Maximum rate of T-vc-MMAE induced cell killing in the respective cell lines | 0.023 (7.8%), 0.016 (4.1%) |
| , | nM | Concentrations of T-vc-MMAE that produces 50% of maximum killing in the respective cell lines | 0.19 (32.7%), 353.3 (55.1%) |
| DTN87, DTMCF7 | hr | Doubling times for the two cell lines | 40.1 (20.1%), 33.6 (1.5 %) |
| γN87, γMCF7 | Unitless | Curve fitting parameter that determines the steepness of the concentration-effect relationship for each cell line | 1.1 (15.8 %), 2.48 (18.1%) |
| , | hr | Transit time parameter used for the cell distribution model applied to each cell line | 9.1 (34.2%), 18.9 (25.4 %) |
| , | Number of cells | Maximum achievable cell number per well for each cell line | 80,500 (34.2%), 75,000 (1.86 %) |
| KBE | 1/hr | Bystander killing constant | 11.36 (15.2%) |
| τ BE | hr | Transit time parameter used to capture the delay in the bystander killing | 35.8 (13.9%) |
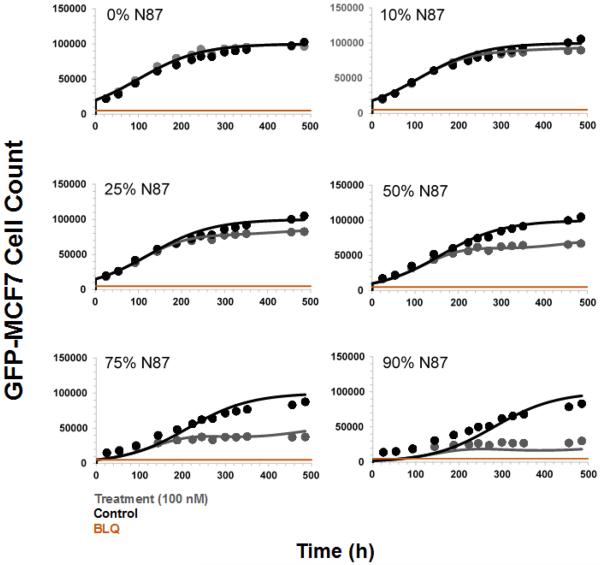
Figure 11 shows the observed and model predicted `cell number vs. time' profiles for GFP-MCF7 cells, obtained after incubating 100 nM of T-vc-MMAE ADC with different ratios of GFP-MCF7 and N87 cells in a co-culture system, superimposed over each other. The model was able to effectively capture the increased efficacy of T-vc-MMAE in GFP-MCF7 cells with increasing ratios of N87 cells. The model parameters associated with the bystander killing (i. e. KBE, τBE) were estimated with good precision as shown in Table 1.
Figure 11.
Observed (symbols) and PD model predicted (lines) cell viability profiles for GFP-MCF7 cells in co-cultures with increasing percentage of N87 cells. Black symbol and lines represent control group without ADC treatment and the gray symbols and lines represent the group treated with 100 nM T-vc-MMAE ADC.
Discussion
There is a general consensus that bystander effect of ADCs helps in overcoming the limitations associated with heterogeneous distribution of ADCs inside a tumor and the heterogeneous expression of antigen in a tumor tissue. However, a quantitative understanding about the rate and extent of bystander killing by ADCs is still missing. We believe that availability of a mathematical model that can characterize and predict the extent of bystander effect for an ADC based on the abundance of Ag+ cells in the tumor would be of great help in discovering and developing novel ADCs.
Bystander effect of ADCs has been characterized by several groups. One of the earliest work by Okeley et al. [10] showed the bystander effect of clinically approved ADC brentuximab-vc-MMAE (SGN-35) in mixed population of CD30+ and CD30− cells. By using co-cultures of 50:50 CD30+ and CD30− cells they showed enhanced killing of CD30− cells by SGN-35, and also demonstrated improved overall efficacy of the ADC. Later on the importance of linker-payload in achieving the bystander effect of ADCs was highlighted by Kovtun et al. [15], who investigated CanAg (MUC1) targeting ADC [24]. The authors compared ADCs synthesized using either disulphide (cleavable) or thioether (non-cleavable) linkers, and demonstrated significant bystander effect produced by conjugates designed with only the cleavable disulphide linker. They concluded that the non-cleavable thioether linker yields highly charged lysine adducts of drug metabolites which are unable to diffuse out of cell membrane, resulting in minimal bystander killing [9]. The significance of linker-design in determining the bystander effect of ADCs is also emphasized by Van der Lee et al. [17], who compared trastuzumab-vc-seco-DUBA (cleavable linker) with trastuzumab-smcc-DM1 (non-cleavable). The authors showed that increasing fractions of HER2+ cells in a co-culture led to increased bystander effect, however, the extent of bystander killing was much higher with valine-citrulline based conjugates as compared to T-DM1. Thus, all the above mentioned and several other [16,18,19, 25] studies collectively reveal the importance of having a cleavable linker that can yield the cytotoxic drug molecule in its pure form to achieve the bystander effect with an ADC. However, how the relative abundance of Ag+ cells in a tumor microenvironment affect the bystander effect of an ADC is not studied in a detailed quantitative manner yet. Here we have developed T-vc-MMAE as our tool ADC to evaluate the bystander effect of the ADC in co-culture system with different ratios of Ag+ and Ag− cells. With the help of different cell lines expressing varying levels of HER2 we have investigated the rate and extent of bystander killing by T-vc-MMAE, and quantitatively characterized it using a PD model.
As the first step, the cell viability of HER2 overexpressing N87 (Ag+) and HER2 low expressing GFP-MCF7 (Ag−) monoculture cells was investigated in the presence of different concentrations of T-vc-MMAE (Figure 5). We observed efficient killing of N87 cells () and minimal killing of GFP-MCF7 cells () at most ADC concentrations tested. These results were expected based on the mechanism of action of ADCs, which requires sufficient expression of the target antigen on the cell surface to induce an efficient killing of the cell. Subsequently, the bystander effect of T-vc-MMAE on Ag− GFP-MCF7 cells was investigated by performing co-culture studies with 9-fold higher N87 cells (Figure 6B) at a range of ADC concentrations. Interestingly, the efficacy of ADC on GFP-MCF7 cells at the highest two concentrations was delayed by several days in the presence of Ag+ N87 cells. This is attributed to the `antigen sink' created by the presence of 9 fold excess Ag+ cells, which would reduce the amount of free ADC available in the media for nonspecific uptake by the Ag− cells in the beginning. As the time progresses, the free MMAE generated by N87 cells would diffuse in the neighboring GFP-MCF7 cells, leading to their cytotoxicity. In addition, the presence of N87 cells lead to enhanced killing of GFP-MCF7 cells at three different ADC concentrations (i.e. 1, 10, and 100 nM) at later time points. This observation suggests the presence of bystander killing at these concentrations that are otherwise nontoxic to GFP-MCF7 cells in a monoculture system.
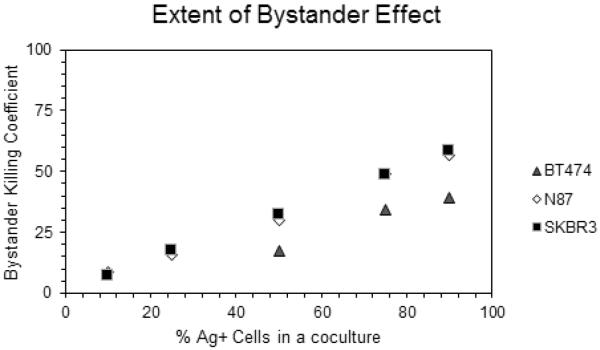
Based on the monoculture experiments the concentration of 100 nM T-vc-MMAE was chosen to investigate the bystander effect of ADC in a co-culture system with different ratios of Ag+ N87 and Ag− GFP-MCF7 cells. This concentration was expected to show minimum direct killing on GFP-MCF7 cells and significant cytotoxicity on N87 cells (). It was observed that increasing the fraction of N87 cells in the co-culture system resulted in increased bystander killing of GFP-MCF7 cells (Figure 7). This is mainly because increased population of Ag+ cells in a co-culture system would lead enhanced intracellular processing of T-vc-MMAE that could result in an increase in the amount of MMAE available in the media for the bystander effect. Similar results were also observed when the co-culture studies of GFP-MCF7 cells were conducted with BT474 and SKBR3 cells at the concentration of 500 nM T-vc-MMAE (Figure 8). These datasets collectively confirmed a positive correlation between the extent of bystander effect and the fraction of Ag+ cells present in a co-culture system, irrespective of the Ag+ cell line used. We further compared the observed bystander effects obtained using different Ag+ cells, by plotting the Bystander Effect Coefficient (φBE) against different percentages of Ag+ cells present in the co-culture system (Figure 12). It was observed that 'φBE vs. % of Ag+ cells' profiles obtained for N87 and SKBR3 co-cultures were superimposable, whereas the profile for BT474 cells was relatively lower with the similar trend. It is reported that N87 and SKBR3 cells express higher number of HER2 receptor compared to BT474 cells [26], thus one can conclude that the level of antigen expression on Ag+ cells is a key determinant for the bystander effect of an ADC in the co-culture system.
Figure 12.
`Bystander Effect Coefficient (φBE) vs. % of Ag+ cells present in a co-culture' relationships observed following T-vc-MMAE ADC treatment of different co-culture ratios of GFP-MCF7 cells with N87, SKBR3 and BT474 cells.
We further evaluated the importance of antigen expression level on the bystander effect of ADC by conducting co-culture studies of GFP-MCF7 (Ag−) cells with an array of cancer cells with varying degree HER2 expression at a fixed ratio of 50:50 (Figure 9). It was found that increasing level of HER2 expression led to increased extent of bystander effect, calculated using the φBE values. There was also an apparent inverse correlation between the expression level of target and the lag time before the bystander effect becomes visible. Additionally, among the three high HER2 expressing cell lines (N87, BT474 and SKBR3) the calculated φBE values were different, suggesting that there may be other determinants aside from antigen expression level that differentiates the ability of these cell lines to demonstrate bystander effect in a co-culture system. This may include differences in the intracellular biomeasures that determines the cellular PK of ADCs and their components, like the intracellular levels of cathepsin B and other proteases, intracellular levels of binding components (e.g. tubulin), and levels of efflux transporters (e.g. Pgp) on cell membrane. We hypothesize that further understanding of the importance of each of these factors in determining the bystander effect of ADCs will increase our ability to predict the bystander effect with confidence.
We have also proposed a PD model to characterize the extent of in vitro bystander effect produced by T-vc-MMAE on GFP-MCF7 cells in co-culture with N87 cells. The model employed a signal transduction component to characterize the delay observed in the induction of the bystander effect. However, in part this delay is caused by the time taken for the ADC to be processed by Ag+ cells and the released drug to diffuse into the Ag− cells. Thus, in order to make a fully mechanistic model for characterizing the bystander effect of ADC, one need to integrate a systems PK model with the PD model. The PD model also suggested that the bystander effect of the ADC in a co-culture system can dissipate over the period of time as the population of Ag+ cells declines. Thus, for a heterogeneous tumor in vivo, significant bystander effect could only be achieved as long as there is a high fraction of Ag+ cells present in the system. This also suggests that non-internalizing ADCs that bind to extracellular matrix proteins (e.g. fibronectin) [27] inside tumor microenvironment could have an advantage over conventional ADCs in maintaining sustained bystander effect over time. It is also important to note that the importance of determinants for the cellular PK of ADC and released drug changes between in vitro and in vivo situations [28], hence one need to be careful before translating the knowledge gained from the in vitro systems to in vivo scenarios. Nonetheless, we believe that integration of the proposed PD model with our previously published systems PK model for ADCs [28,29] would provide a reliable mathematical framework to interpret and predict in vivo bystander effect of ADCs.
In summary, using T-vc-MMAE as a tool ADC, and in vitro co-culture systems created by mixing GFP-MCF7 (Ag−) cells with various Ag+ cells, here we have quantified the rate and extent of bystander effect by the ADC and mathematically characterize it using a PD model. It was observed that the bystander effect of the ADC increases with increase in the fraction of Ag+ cells present in a co-culture and with increase in the antigen expression levels on Ag+ cells. It was also observed that initiation of the bystander effect takes time, most probably due to the time taken for processing of the ADC by Ag+ cells and diffusion of the released drug in neighboring Ag− cells. Results from our investigation also suggested that there may be other determinants apart from the antigen expression level that can influence the ability of Ag+ cells to demonstrate bystander effect in a co-culture system. We have also proposed a novel PD model for characterizing the bystander effect of ADC in co-culture system, integration of which with systems PK models of ADC can provide a quantitative framework that can be used to discover and develop novel ADCs with optimal bystander killing capabilities.
Supplementary Material
Acknowledgements
This work was supported by NIH grant GM114179 to D.K.S., and the Centre for Protein Therapeutics at the State University of New York at Buffalo. S.S. was supported by a post-doctoral fellowship from Hoffman La-Roche, Switzerland to D.K.S. Authors would also like to thank Dr. Wojciech Krzyzanski, University at Buffalo, for his helpful discussion on mathematical modeling section of the manuscript.
References
- 1.Peters C, Brown S. Antibody-drug conjugates as novel anti-cancer chemotherapeutics. Bioscience reports. 2015;35(4) doi: 10.1042/BSR20150089. doi:10.1042/BSR20150089. [DOI] [PMC free article] [PubMed] [Google Scholar]
- 2.Sohayla RIQ, Robert S. The Clinical Landscape of Antibody-drug Conjugates. 2014 doi:10.14229/jadc.2014.8.1.001. [Google Scholar]
- 3.Lin K, Tibbitts J. Pharmacokinetic considerations for antibody drug conjugates. Pharmaceutical research. 2012;29(9):2354–2366. doi: 10.1007/s11095-012-0800-y. doi:10.1007/s11095-012-0800-y. [DOI] [PubMed] [Google Scholar]
- 4.Chari RV, Miller ML, Widdison WC. Antibody-drug conjugates: an emerging concept in cancer therapy. Angewandte Chemie. 2014;53(15):3796–3827. doi: 10.1002/anie.201307628. doi:10.1002/anie.201307628. [DOI] [PubMed] [Google Scholar]
- 5.Younes A, Bartlett NL, Leonard JP, Kennedy DA, Lynch CM, Sievers EL, Forero-Torres A. Brentuximab vedotin (SGN-35) for relapsed CD30-positive lymphomas. The New England journal of medicine. 2010;363(19):1812–1821. doi: 10.1056/NEJMoa1002965. doi:10.1056/NEJMoa1002965. [DOI] [PubMed] [Google Scholar]
- 6.Girish S, Gupta M, Wang B, Lu D, Krop IE, Vogel CL, Burris Iii HA, LoRusso PM, Yi JH, Saad O, Tong B, Chu YW, Holden S, Joshi A. Clinical pharmacology of trastuzumab emtansine (T-DM1): an antibody-drug conjugate in development for the treatment of HER2-positive cancer. Cancer chemotherapy and pharmacology. 2012;69(5):1229–1240. doi: 10.1007/s00280-011-1817-3. doi:10.1007/s00280-011-1817-3. [DOI] [PMC free article] [PubMed] [Google Scholar]
- 7.Hamblett KJ, Senter PD, Chace DF, Sun MM, Lenox J, Cerveny CG, Kissler KM, Bernhardt SX, Kopcha AK, Zabinski RF, Meyer DL, Francisco JA. Effects of drug loading on the antitumor activity of a monoclonal antibody drug conjugate. Clinical cancer research : an official journal of the American Association for Cancer Research. 2004;10(20):7063–7070. doi: 10.1158/1078-0432.CCR-04-0789. doi:10.1158/1078-0432.CCR-04-0789. [DOI] [PubMed] [Google Scholar]
- 8.Kamath AV, Iyer S. Preclinical Pharmacokinetic Considerations for the Development of Antibody Drug Conjugates. Pharmaceutical research. 2015;32(11):3470–3479. doi: 10.1007/s11095-014-1584-z. doi:10.1007/s11095-014-1584-z. [DOI] [PMC free article] [PubMed] [Google Scholar]
- 9.Erickson HK, Park PU, Widdison WC, Kovtun YV, Garrett LM, Hoffman K, Lutz RJ, Goldmacher VS, Blattler WA. Antibody-maytansinoid conjugates are activated in targeted cancer cells by lysosomal degradation and linker-dependent intracellular processing. Cancer research. 2006;66(8):4426–4433. doi: 10.1158/0008-5472.CAN-05-4489. doi:10.1158/0008-5472.CAN-05-4489. [DOI] [PubMed] [Google Scholar]
- 10.Okeley NM, Miyamoto JB, Zhang X, Sanderson RJ, Benjamin DR, Sievers EL, Senter PD, Alley SC. Intracellular activation of SGN-35, a potent anti-CD30 antibody-drug conjugate. Clinical cancer research : an official journal of the American Association for Cancer Research. 2010;16(3):888–897. doi: 10.1158/1078-0432.CCR-09-2069. doi:10.1158/1078-0432.CCR-09-2069. [DOI] [PubMed] [Google Scholar]
- 11.Katz J, Janik JE, Younes A. Brentuximab Vedotin (SGN-35) Clinical cancer research : an official journal of the American Association for Cancer Research. 2011;17(20):6428–6436. doi: 10.1158/1078-0432.CCR-11-0488. doi:10.1158/1078-0432.CCR-11-0488. [DOI] [PubMed] [Google Scholar]
- 12.Kim EG, Kim KM. Strategies and Advancement in Antibody-Drug Conjugate Optimization for Targeted Cancer Therapeutics. Biomolecules & therapeutics. 2015;23(6):493–509. doi: 10.4062/biomolther.2015.116. doi:10.4062/biomolther.2015.116. [DOI] [PMC free article] [PubMed] [Google Scholar]
- 13.Fisher R, Pusztai L, Swanton C. Cancer heterogeneity: implications for targeted therapeutics. British journal of cancer. 2013;108(3):479–485. doi: 10.1038/bjc.2012.581. doi:10.1038/bjc.2012.581. [DOI] [PMC free article] [PubMed] [Google Scholar]
- 14.Seol H, Lee HJ, Choi Y, Lee HE, Kim YJ, Kim JH, Kang E, Kim SW, Park SY. Intratumoral heterogeneity of HER2 gene amplification in breast cancer: its clinicopathological significance. Modern pathology : an official journal of the United States and Canadian Academy of Pathology, Inc. 2012;25(7):938–948. doi: 10.1038/modpathol.2012.36. doi:10.1038/modpathol.2012.36. [DOI] [PubMed] [Google Scholar]
- 15.Kovtun YV, Audette CA, Ye Y, Xie H, Ruberti MF, Phinney SJ, Leece BA, Chittenden T, Blattler WA, Goldmacher VS. Antibody-drug conjugates designed to eradicate tumors with homogeneous and heterogeneous expression of the target antigen. Cancer research. 2006;66(6):3214–3221. doi: 10.1158/0008-5472.CAN-05-3973. doi:10.1158/0008-5472.CAN-05-3973. [DOI] [PubMed] [Google Scholar]
- 16.Masuda S, Miyagawa S, Sougawa N, Sawa Y. CD30-targeting immunoconjugates and bystander effects. Nature reviews Clinical oncology. 2015;12(4) doi: 10.1038/nrclinonc.2014.159-c1. doi:10.1038/nrclinonc.2014.159-c1. [DOI] [PubMed] [Google Scholar]
- 17.van der Lee MM, Groothuis PG, Ubink R, van der Vleuten MA, van Achterberg TA, Loosveld EM, Damming D, Jacobs DC, Rouwette M, Egging DF, van den Dobbelsteen D, Beusker PH, Goedings P, Verheijden GF, Lemmens JM, Timmers M, Dokter WH. The Preclinical Profile of the Duocarmycin-Based HER2-Targeting ADC SYD985 Predicts for Clinical Benefit in Low HER2-Expressing Breast Cancers. Molecular cancer therapeutics. 2015;14(3):692–703. doi: 10.1158/1535-7163.MCT-14-0881-T. doi:10.1158/1535-7163.MCT-14-0881-T. [DOI] [PubMed] [Google Scholar]
- 18.Golfier S, Kopitz C, Kahnert A, Heisler I, Schatz CA, Stelte-Ludwig B, Mayer-Bartschmid A, Unterschemmann K, Bruder S, Linden L, Harrenga A, Hauff P, Scholle FD, Muller-Tiemann B, Kreft B, Ziegelbauer K. Anetumab ravtansine: a novel mesothelin-targeting antibody-drug conjugate cures tumors with heterogeneous target expression favored by bystander effect. Molecular cancer therapeutics. 2014;13(6):1537–1548. doi: 10.1158/1535-7163.MCT-13-0926. doi:10.1158/1535-7163.MCT-13-0926. [DOI] [PubMed] [Google Scholar]
- 19.Li JY, Perry SR, Muniz-Medina V, Wang X, Wetzel LK, Rebelatto MC, Hinrichs MJ, Bezabeh BZ, Fleming RL, Dimasi N, Feng H, Toader D, Yuan AQ, Xu L, Lin J, Gao C, Wu H, Dixit R, Osbourn JK, Coats SR. A Biparatopic HER2-Targeting Antibody-Drug Conjugate Induces Tumor Regression in Primary Models Refractory to or Ineligible for HER2-Targeted Therapy. Cancer cell. 2016;29(1):117–129. doi: 10.1016/j.ccell.2015.12.008. doi:10.1016/j.ccell.2015.12.008. [DOI] [PubMed] [Google Scholar]
- 20.Lobo ED, Balthasar JP. Pharmacodynamic modeling of chemotherapeutic effects: application of a transit compartment model to characterize methotrexate effects in vitro. AAPS pharmSci. 2002;4(4):E42. doi: 10.1208/ps040442. doi:10.1208/ps040442. [DOI] [PMC free article] [PubMed] [Google Scholar]
- 21.Simeoni M, Magni P, Cammia C, De Nicolao G, Croci V, Pesenti E, Germani M, Poggesi I, Rocchetti M. Predictive pharmacokinetic-pharmacodynamic modeling of tumor growth kinetics in xenograft models after administration of anticancer agents. Cancer research. 2004;64(3):1094–1101. doi: 10.1158/0008-5472.can-03-2524. [DOI] [PubMed] [Google Scholar]
- 22.Yang J, Mager DE, Straubinger RM. Comparison of two pharmacodynamic transduction models for the analysis of tumor therapeutic responses in model systems. The AAPS journal. 2010;12(1):1–10. doi: 10.1208/s12248-009-9155-7. doi:10.1208/s12248-009-9155-7. [DOI] [PMC free article] [PubMed] [Google Scholar]
- 23.D'Argenio DZ, Schumitzky A, Wang X. Biomedical Simulations Resource. Los Angeles: 2009. ADAPT 5 User's Guide: Pharmacokinetic/Pharmacodynamic Systems Analysis Software. [Google Scholar]
- 24.Tolcher AW, Ochoa L, Hammond LA, Patnaik A, Edwards T, Takimoto C, Smith L, de Bono J, Schwartz G, Mays T, Jonak ZL, Johnson R, DeWitte M, Martino H, Audette C, Maes K, Chari RV, Lambert JM, Rowinsky EK. Cantuzumab mertansine, a maytansinoid immunoconjugate directed to the CanAg antigen: a phase I, pharmacokinetic, and biologic correlative study. Journal of clinical oncology : official journal of the American Society of Clinical Oncology. 2003;21(2):211–222. doi: 10.1200/JCO.2003.05.137. [DOI] [PubMed] [Google Scholar]
- 25.Ogitani Y, Hagihara K, Oitate M, Naito H, Agatsuma T. Bystander killing effect of DS-8201a, a novel anti-HER2 antibody-drug conjugate, in tumors with HER2 heterogeneity. Cancer science. 2016 doi: 10.1111/cas.12966. doi:10.1111/cas.12966. [DOI] [PMC free article] [PubMed] [Google Scholar]
- 26.Maass KF, Kulkarni C, Betts AM, Wittrup KD. Determination of Cellular Processing Rates for a Trastuzumab-Maytansinoid Antibody-Drug Conjugate (ADC) Highlights Key Parameters for ADC Design. The AAPS journal. 2016 doi: 10.1208/s12248-016-9892-3. doi:10.1208/s12248-016-9892-3. [DOI] [PMC free article] [PubMed] [Google Scholar]
- 27.Perrino E, Steiner M, Krall N, Bernardes GJ, Pretto F, Casi G, Neri D. Curative properties of noninternalizing antibody-drug conjugates based on maytansinoids. Cancer research. 2014;74(9):2569–2578. doi: 10.1158/0008-5472.CAN-13-2990. doi:10.1158/0008-5472.CAN-13-2990. [DOI] [PubMed] [Google Scholar]
- 28.Singh AP, Maass KF, Betts AM, Wittrup KD, Kulkarni C, King LE, Khot A, Shah DK. Evolution of Antibody-Drug Conjugate Tumor Disposition Model to Predict Preclinical Tumor Pharmacokinetics of Trastuzumab-Emtansine (T-DM1) The AAPS journal. 2016 doi: 10.1208/s12248-016-9904-3. doi:10.1208/s12248-016-9904-3. [DOI] [PMC free article] [PubMed] [Google Scholar]
- 29.Shah DK, Haddish-Berhane N, Betts A. Bench to bedside translation of antibody drug conjugates using a multiscale mechanistic PK/PD model: a case study with brentuximab-vedotin. Journal of pharmacokinetics and pharmacodynamics. 2012;39(6):643–659. doi: 10.1007/s10928-012-9276-y. doi:10.1007/s10928-012-9276-y. [DOI] [PubMed] [Google Scholar]
Associated Data
This section collects any data citations, data availability statements, or supplementary materials included in this article.


