Abstract
This study examined whether the mechanical characteristics of the cochlea could influence individual variation in the ability to use temporal fine structure (TFS) information. Cochlear mechanical functioning was evaluated by swept-tone evoked otoacoustic emissions (OAEs), which are thought to comprise linear reflection by micromechanical impedance perturbations, such as spatial variations in the number or geometry of outer hair cells, on the basilar membrane (BM). Low-rate (2 Hz) frequency modulation detection limens (FMDLs) were measured for carrier frequency of 1000 Hz and interaural phase difference (IPD) thresholds as indices of TFS sensitivity and high-rate (16 Hz) FMDLs and amplitude modulation detection limens (AMDLs) as indices of sensitivity to non-TFS cues. Significant correlations were found among low-rate FMDLs, low-rate AMDLs, and IPD thresholds (R = 0.47–0.59). A principal component analysis was used to show a common factor that could account for 81.1, 74.1, and 62.9 % of the variance in low-rate FMDLs, low-rate AMDLs, and IPD thresholds, respectively. An OAE feature, specifically a characteristic dip around 2–2.5 kHz in OAE spectra, showed a significant correlation with the common factor (R = 0.54). High-rate FMDLs and AMDLs were correlated with each other (R = 0.56) but not with the other measures. The results can be interpreted as indicating that (1) the low-rate AMDLs, as well as the IPD thresholds and low-rate FMDLs, depend on the use of TFS information coded in neural phase locking and (2) the use of TFS information is influenced by a particular aspect of cochlear mechanics, such as mechanical irregularity along the BM.
KEYWORDS: temporal fine structure, frequency modulation detection, interaural time difference, amplitude modulation detection, otoacoustic emission, principal component analysis, multiple regression analysis
INTRODUCTION
A previous study (Otsuka et al. 2014) reported a significant correlation between low-rate frequency modulation detection limens (FMDLs) and the features extracted from click-evoked otoacoustic emissions (CEOAEs). A CEOAE is a small-amplitude acoustic signal evoked by a click and is considered to reflect the function of the outer hair cells (OHCs) and the degree of mechanical irregularity, such as spatial variations in the number or geometry of OHCs, along the basilar membrane (BM) (Hilger et al. 1995). It has been suggested that the major cue for detecting low-rate (<5 Hz) frequency modulation (FM) is the change in the temporal fine structure (TFS) of a stimulus, which is represented by the pattern of neural phase locking at the auditory periphery (e.g., Moore and Sek 1996). Thus, the correlation between FMDLs and CEOAEs observed by Otsuka et al. (2014) could be interpreted as indicating that the ability to use TFS information is affected by cochlear mechanical properties, e.g., the irregularity on the BM might influence the efficiency of TFS coding based on comparisons of relative phases of the outputs between two adjacent and distinct regions on the BM (Loeb et al. 1983; Carlyon et al. 2012). Otsuka et al. (2014) were not able to rule out the possibility that the cochlear mechanical properties determine the coding efficiency of cues other than the TFS that might be used by listeners in the FM detection task. For example, Moore and Sek (1996) and Ernst and Moore (2010) suggested that changes in the excitation pattern provide another cue for FM detection.
The present study was intended to test the hypothesis that particular features of OAEs are related specifically to TFS coding. For that purpose, the earlier study (Otsuka et al. 2014) was extended by measuring performance for multiple psychoacoustic tasks that are or are not assumed to rely on TFS information. The tasks included low- and high-rate FM detections, low- and high-rate amplitude modulation (AM) detections, and interaural phase difference (IPD) detection. If the hypothesis is correct, then there should be consistent correlations between the strength of an OAE feature and performance of the tasks based on TFS coding. Such correlations should not be observed for tasks that do not require the TFS cue.
IPD thresholds are considered to reflect the peripheral efficiency of TFS coding. Low-rate FMDLs and IPD thresholds have been used to evaluate sensitivity to TFS in previous studies (Grose and Mamo 2010, 2012; Strelcyk and Dau 2009). Strelcyk and Dau (2009) found a positive correlation between low-rate FMDLs and IPD thresholds for hearing-impaired listeners. High-rate FM is assumed to be detected primarily by FM to amplitude modulation (AM) conversion at the outputs of off-frequency auditory filters (Moore and Sek 1996). It has been argued that the mechanism that decodes TFS information is “sluggish” and cannot track rapid changes in frequency, on the basis of the fact that FM detection is robust to interfering AM imposed on the same carrier only for low FM rates and low carrier frequency (Sek and Moore 1995; Moore and Sek 1995, 1996). Low- and high-rate (2 and 16 Hz, respectively) AM detection limens (AMDLs) were expected to serve as control measures that would indicate the listeners’ general sensitivities to time-varying stimuli. AM is represented by neural phase-locking, the neural response to the envelope of the stimulus on the BM, or by fluctuations in the average rate of firing at the auditory periphery (Joris et al. 2004).
In the present study, cochlear mechanics were examined by measuring swept-tone OAEs (e.g., Choi et al. 2008; Bennett and Ozdamar 2010; Kalluri and Shera 2013). The origin and properties of swept-tone OAEs are considered to be the same as those of CEOAEs, which were examined in the earlier study (Otsuka et al. 2014). A swept-tone OAE generally has a higher signal-to-noise ratio (SNR) than a CEOAE. As in the earlier study, the swept-tone OAE spectra were decomposed into several components by a principal component analysis (PCA). This procedure was intended to characterize the amplitude spectra of OAE, which is assumed to reflect the degree of impedance irregularities on the BM (Hilger et al. 1995). Then, a multiple regression analysis was applied to examine the relation between OAE characteristics and psychoacoustic performance. If the hypothesis is correct, some components extracted from swept-tone OAE spectra would be correlated with low-rate FMDLs and IPD thresholds but not with high-rate FMDLs and AMDLs.
In order to explain the correlation between a specific OAE feature and low-rate FM detection performance, Otsuka et al. (2014) speculated that the mechanical irregularity along the BM influences the efficiency of TFS coding on the basis of comparisons of phases of the outputs between two adjacent and distinct regions on the BM (Loeb et al. 1983; Carlyon et al. 2012). The present study further explored this explanation by using a one-dimensional transmission line model. This model incorporates impedance irregularities in the cochlear mechanics and was able to reproduce OAEs. The model analysis was adopted to examine whether the implemented irregularities can change the phase responses along the BM and how the simulated OAE features are related to the phase changes.
METHODS
Participants
There were 34 participants (12 males and 22 females). All ears had normal pure-tone audiometric thresholds (thresholds <20 dB HL) from 0.25 to 8 kHz. All ears showed a normal tympanogram, the peak-compensated static compliance was 0.3–2.0 ml, and peak pressure was between −100 and +50 daPa. The static compliance of two participants was greater than 4.0 ml, and these two participants were not included in further analysis. One participant whose average SNR of swept-tone OAEs was below 6 dB was also excluded from further analysis. As a result, psychoacoustic measurements were obtained for 31 participants (12 males and 19 females) aged 19–39 years (mean = 29.2, standard deviation = 5.5). Five of the participants took part in the previous study (Otsuka et al. 2014). Low-rate FMDLs, high-rate FMDLs, and low-rate AMDLs were measured for all participants. IPD thresholds were measured for 24 participants (11 males and 13 females), and high-rate AMDLs were measured for 24 participants (9 males and 15 females). The experiments were approved by the Research Ethics Committee of NTT Communication Science Laboratories.
Equipment
Stimuli were digitally synthesized with sampling rates of 96 kHz for the OAE measurements and 44.1 kHz for psychoacoustic measurements and converted to analog signals using an audio interface (Edirol UA-101) with a precision of 24 bits. For the psychoacoustic measurements, these converted signals were presented through Sennheiser HDA 200 headphones. For the OAE measurements, the analog signals were amplified by a headphone buffer and presented through Etymotic Research ER-2A earphones. The two outputs from the ER-2A were calibrated using the DB2012 accessory (external ear simulator) of a Bruel and Kjaer Type 4257 ear simulator (IEC 711). Ear canal sound pressure was recorded using an Etymotic Research ER-10B low-noise microphone system inserted in each ear. An Etymotic Research ER-7c probe microphone was used to measure ear canal reflectance. All measurements were conducted in a double-walled sound-attenuating room.
Measurement of FMDLs
FM tones were characterized using the following equation:
| 1 |
where f c is the carrier frequency, Δf is the frequency excursion, and f m is the modulation rate. The starting modulator phase θ was selected randomly for each presentation. The f c was set at 1 kHz, and f m was either 2 or 16 Hz. The stimulus duration was 750 ms, including 20-ms raised-cosine ramps. The stimulus was presented at 55 dB SPL to the participant’s right ear. A two-interval two-alternative forced-choice (2I-2AFC) procedure and a two-down, one-up transformed adaptive method were used to track 70.7 % (Levitt 1971) correct FM detection. The inter-stimulus interval was 500 ms. One track of measurements was terminated after 12 reversals, and the FMDL (in Hertz) for that track was defined as the geometric mean of allΔf values of the last eight reversals. A run started withΔf = 25 Hz. The step size inΔf was a factor of 20.5 for the first four reversals and a factor of 20.25 for later reversals. The FMDL was estimated as the geometric mean across three tracks. The order of tracks for the 2- and 16-Hz FM rate was randomized for each participant. If the standard deviation (SD) over the mean of the three estimates was greater than 0.2, two additional tracks were obtained. The mean FMDL for each participant and for the modulation rate was derived from the results of all tracks except those with extremely high FMDLs (more than twice the mean FMDL of all the tracks for each participant and rate), for which the participants probably temporarily lost their concentration.
Measurement of AMDLs
AM tones were characterized using the following equation:
| 2 |
where f c is the carrier frequency, ΔA is the modulation depth, and f m is the modulation rate. The starting modulator phase θ was randomly changed for each presentation. The f c was set at 1 kHz, and f m was either 2 or 16 Hz. The stimulus duration was 750 ms, including 20-ms raised-cosine ramps. The stimulus was presented at 55 dB SPL to the participant’s right ear. The AMDL was defined asΔA at the detection threshold and was measured using a 2I-2AFC procedure and a two-down, one-up transformed adaptive method. One track of measurements was terminated after 12 reversals, and the AMDL (in decibels) for that track was defined as the geometric mean of allΔA (in decibels) values of the last eight reversals. The two intervals were separated by a 500-ms silent gap. A run was started withΔA = 0.5. ΔA was changed by a factor of 20.5 for the first four reversals and by a factor of 20.25 for later reversals. The order of tracks for the 2- and 16-Hz AM rates was randomized for each participant. The mean AMDL for each participant was computed from three or five thresholds by the same procedure as for the FMDLs. The mean AMDLs were converted to a decibel scale for further analysis.
Measurement of IPD Thresholds
IPD thresholds were measured for 1000-Hz tones of 400-ms duration, including 100-ms raised-cosine ramps. To reduce the contribution of the interaural time difference of the onset envelope to lateralization judgments, relatively long duration ramps were used and the envelope was synchronized between ears. Tones were presented at 55 dB SPL. IPD thresholds were measured using a 2I-2AFC procedure and a two-down, one-up transformed adaptive method. In each trial, one randomly chosen stimulus had an IPD of +ΔIPD/2 (right advance in time) and the other had an IPD of –ΔIPD/2 (left advance in time). One track of measurements was terminated after 12 reversals, and the IPD (in ms) for that track was defined as the geometric mean of all ΔIPD (in ms) values of the last eight reversals. The two intervals were separated by a 250-ms silent gap. The participants were required to indicate the direction of motion between two intervals. The value ofΔIPD started at 300 ms and was increased or decreased by a factor of 20.5 for the first four reversals and by a factor of 20.25 for later reversals. The mean IPD threshold for each participant was computed from the geometric mean of three or five thresholds by the same procedure as for the FMDLs.
Measurement of Swept-Tone OAEs
Swept-tone OAEs were measured by applying the log-time stretched pulse (TSP) method, where the impulse response of a system is measured by a stimulus called a log-TSP signal (Morise et al. 2007). The frequency-domain log-TSP signal was expressed by the following equations:
| 3 |
where
| 4 |
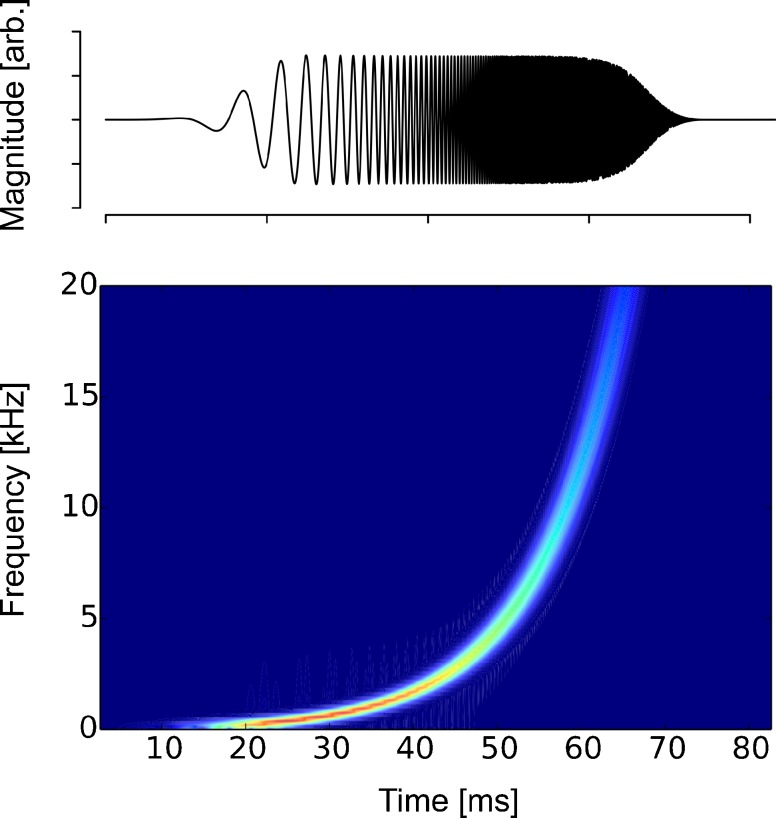
and k is discretized frequency with a step size of 11.9 Hz. The length of the signal, N, was set at 8092 samples (84.3 ms). The sweep speed, m, was set at N/2. The time-domain log-TSP signal s[n] (n = 1–8192) (Fig. 1) was computed by an inverse fast Fourier transform (FFT) of S[k], band-pass filtered by a second-order Butterworth filter (200–20,000 Hz), and presented to the participants’ right ear. The response to s[n] and r[n] was transformed into frequency-domain R[k] by FFT.
FIG. 1.
A time-domain log-TSP signal (s[n]) (upper panel) and its spectrogram (bottom panel).
A time-domain impulse response was computed using the following equation:
| 5 |
To eliminate stimulus ringing, the nonlinear portion of the swept-tone OAEs contained in h[n] was extracted by the double-evoked procedure (Keefe 1998), where three stimuli—s 1, s 2, and s 12 (s 1 and s 2 were the same stimuli but were presented from different loudspeakers; s 12 means that s 1 and s 2 were presented from the two loudspeakers at the same time)—were presented, and the nonlinear portion of OAE (r nl) was derived using the following equation.
| 6 |
where r 1, r 2, and r 12 were the recorded responses to s 1, s 2, and s 12, respectively.
In this study, the stimulus sequence was modified such that s 1, s 2, and s 12 were each presented twice, resulting in a sequence comprising six sweeps (s 1, s 1ʹ, s 2, s 2ʹ, s 12, and s 12ʹ). Impulse responses for each stimulus were calculated by the method described above, resulting in h 1, h 1ʹ, h 2, h 2ʹ, h 12, and h 12ʹ. Impulse responses for each stimulus were derived by averaging adjacent impulse response waveforms. The swept-tone OAE was defined as the nonlinear portion of the impulse responses, which was computed using the following equation:
| 7 |
The corresponding noise waveforms were derived by using the following equation:
| 8 |
The sound pressure levels of s 1 and s 2 were 55-dB SPL. Log-TSP signals derived from Eq. (3) were presented at a rate of ten sweeps per second. The stimulus sequence was presented 250 times. The mean swept-tone OAE for each participant was obtained by averaging the 200 swept-tone OAE waveforms with the lowest noise, i.e., the root mean-squared value of corresponding noise obtained from Eq. (8).
A complex Morlet wavelet analysis was applied to the averaged swept-tone OAEs to calculate the frequency characteristics. Wavelet analysis has been applied to decompose OAE signals into time-frequency components because of its good balance between frequency and time resolution (Tognola et al. 1997; Wit et al. 1994). The mother wavelet was defined as follows:
| 9 |
where f 0 is the center frequency of the mother wavelet and σ t is the parameter that determines the window width of the mother wavelet. Both f 0 and σ t were set to 1.0.
The mother wavelet was scaled with a scale factor of f/f 0 and ranged from 0.25 to 5 kHz in 0.01-kHz steps. As a result, the bandwidth of each wavelet was 0.53 f 0 . The scaled wavelet was applied for a period between 0 and 25 ms after stimulus onset to obtain the time-frequency representation of the swept-tone OAEs was calculated. The swept-tone OAE spectrum was defined as the root mean square value at each analysis frequency.
Measurement of Ear Canal Reflectance
Participants’ middle ear function was evaluated on the basis of ear canal reflectance. This was done to examine the extent to which middle ear characteristics could account for the results. Ear canal reflectance is the complex ratio between an incident wave and backward wave, which reflects impedance mismatch between the ear canal and eardrum. The ear canal reflectance frequency response has been used for middle ear diagnoses (e.g., Feeney et al. 2003).
The stimulus for the measurements was a TSP signal computed from Eq. (3) and presented at 75 dB SPL. The TSP signals were presented 500 times. Measured waveforms were averaged across the recordings, and responses with abnormal magnitudes (>0.01 Pa) were excluded to remove artifacts such as coughs and respiration. The frequency response of the recorded sound was computed from an FFT of the whole range of responses (8096 samples). The ear canal impedance was computed by substituting the measured pressure in the ear canal and the impedance of the system into Thevenin’s equation (Keefe et al. 1992). The ear canal reflectance (R) was derived from the characteristic impedance (Z 0 = r c/A, where r is the density of air and c is the speed of sound) and the ear canal impedance (Z ec) using the following equation (Keefe et al. 1992):
| 10 |
The method described by Keefe et al. (1992) was used to measure the impedance of the system. Calibration was conducted by using a set of four brass tubes with an inner diameter of 8 mm and lengths ranging from 10 to 72 mm. During the measurement, the participant’s ear canal was sealed with an ear tip attached to the ER-10B system. If the low-frequency reflectance (below 500 Hz) was below 0.8, which is indicative of a leaky probe fitting, the probe tip was removed from the ear canal and reinserted.
Statistical Analysis
To explore features that characterize swept-tone OAE spectra, a PCA was applied. The PCA was performed on vectors of OAE spectra ranging from 0.25 to 5 kHz (476 data points), with each vector representing one participant. Cross-correlations were used for computing relation matrices. The lowest number of principal components (PCs) required to account for 95 % of the variance was adopted. The same procedure was applied to the ear canal reflectance within the range 0.25–5 kHz (414 data points) and to the audiogram within the range 0.25–8 kHz (six data points).
A multiple regression analysis was applied to the extracted PCs (explaining variables) and the thresholds measured in the psychoacoustic tasks (explained variables); six regression equations, for low- and high-rate FMDLs, low- and high-rate AMDLs, and IPD thresholds, were derived. In order to identify components that would effectively account for psychoacoustic threshold variations, variable selections were made on the basis of leave-one-out cross-validation (LOOCV) (e.g., Lachenbruch and Mickey 1968). A single observation (i.e., one participant) was left out as a test observation and estimated by the regression derived from the remaining observations. Then, the squared prediction error for the test observation was computed. This procedure was iterated such that each observation was used once as a test datum, and the mean square error (MSE) of the predictions was used as the model’s prediction accuracy for unseen data. The MSEs were calculated for all models generated by all possible combinations of explaining variables, and the combination showing the lowest MSE was selected. All statistical analyses were performed on a log10-scale.
Cochlear Model
The structure of the one-dimensional transmission line cochlear model was identical to the linear model in Ku et al. (2009), in which nonlinear gain properties of OHC are not taken account. This simplification is widely accepted to simulate OAEs originating from the reflection by impedance irregularities (e.g., Choi et al. 2008) and the BM’s phase response including a sharp phase transition around the peak of the traveling wave (Neely and Kim 1986). The BM was divided into 500 partitions along the length of the cochlea, each of which was taken as a mass-damper-spring system; the partitions at the apical and basal end were models of the stapes and the helicotrema, respectively. The other elements were the micromechanical model of the BM. This model comprised a two-degree-of-freedom system with an active element, which provides negative damping and stiffness proportional to the displacement and velocity between the BM and tectorial membrane. The gain and tuning of each partition of the BM can be adjusted by the gain parameter of the active element, γ(x), where x is the position along the BM. These mechanical elements were coupled via the cochlear fluid. The coupled relationship between the cochlear partitions and the fluid mechanics were described by state-space formulation (Elliott et al. 2007), and the differential equation was solved by using the Runge-Kutta fourth-order algorithm. The step size for the algorithm was set to 3 × 10⁻⁶ s.
Similarly to previous studies that simulated OAE in a transmission line model (Lineton and Lutman 2003; Choi et al. 2008; Epp et al. 2010; Verhulst et al. 2012), the impedance irregularities along the BM were implemented by randomly varying the gain parameter, γ(x), across positions on the BM. A set of random numbers were samples from a normal distribution (standard variation = 0.01, mean = 0.9). It was confirmed that the model constructed in this way had the tuning of the 1-kHz traveling wave of Q = 11.1, which is close to the human auditory filter at low to moderate sound levels (Oxenham and Shera 2003). This procedure was repeated 500 times to produce 500 cochlear models (or 500 simulated “ears”) with different gain profiles.
To simulate CEOAEs, which are basically the same as the swept-tone OAEs, a click was presented to the first elements corresponding to the stapes at peak acceleration of 0.018 m/s2. Note that the stimulus intensity would not affect the results, because this model did not incorporate the nonlinearity in the stimulus level. The click had a 100-μs duration. Reflected waves generated by the implemented impedance irregularity were observed at the stapes (the first element of the BM partitions) and defined as CEOAE (in meters). Similarly to the swept-tone OAEs obtained empirically, the simulated CEOAE was represented as an amplitude spectrum. To remove short-latency stimulus ringing, the spectrum analysis was applied only to the part 5 ms after the stimulus onset (Kemp 1978). The spectrum of the CEOAE was calculated and decomposed into 476 components (the number of bins of CEOAE spectra) by the same procedure as for the swept-tone OAE analysis.
For each of the 500 cochlear models, a traveling wave responding to the 1-kHz pure-tone was calculated. The stimulus was presented to the first elements (the stapes) at acceleration of 0.018 m/s2. The stimulus duration was 160 ms. The phase and magnitude of the traveling wave at each position along the BM were calculated from the phase and magnitude of the FFT bin corresponding to the characteristic frequency at each position. FFT was applied to each vibration between 80 and 100 ms after the onset of the stimulus. The phase response of the BM of a given cochlear model with a random gain profile was compared with that of the BM with a smooth gain profile, i.e., one not containing impedance irregularities. The phase difference between the models with an irregular and the smooth profiles was calculated at each location along the BM (bottom panel in Fig. 10B). Then, the total phase fluctuation of each cochlear model (with an irregular profile) was represented as a root mean square (RMS) value of those phase differences along the BM. It was assumed that the phase response of the BM in the smooth cochlear model is optimal for TFS coding on the basis of comparisons of relative phases of the outputs between two adjacent and distinct regions on the BM (e.g., Carlyon et al. 2012). Thus, the larger phase fluctuation should lead to poorer TFS coding. To identify the principal components of OAE that were related to the phase fluctuation, a correlation between each principal component and the size of phase fluctuation was calculated.
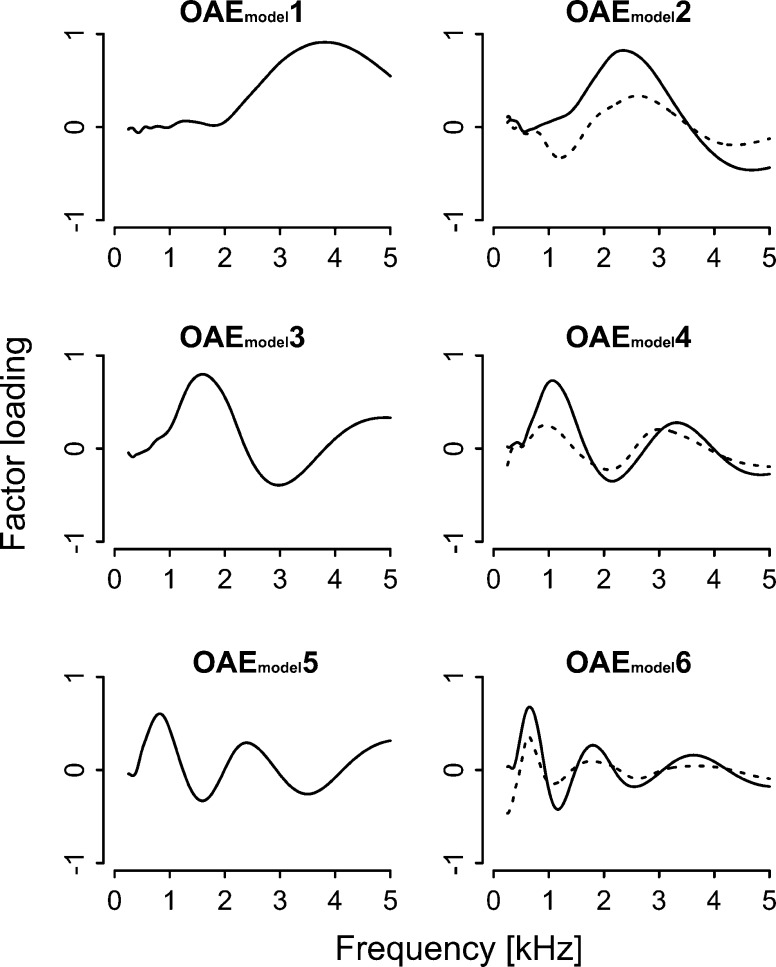
FIG. 10.
Factor loadings of PCs extracted from the simulated CEOAEs. OAE4, OAE5, and OAE6 are indicated by a dotted line superimposed on OAEmodel2, OAEmodel4, and OAEmodel6, respectively.
RESULTS
Psychoacoustic Measures
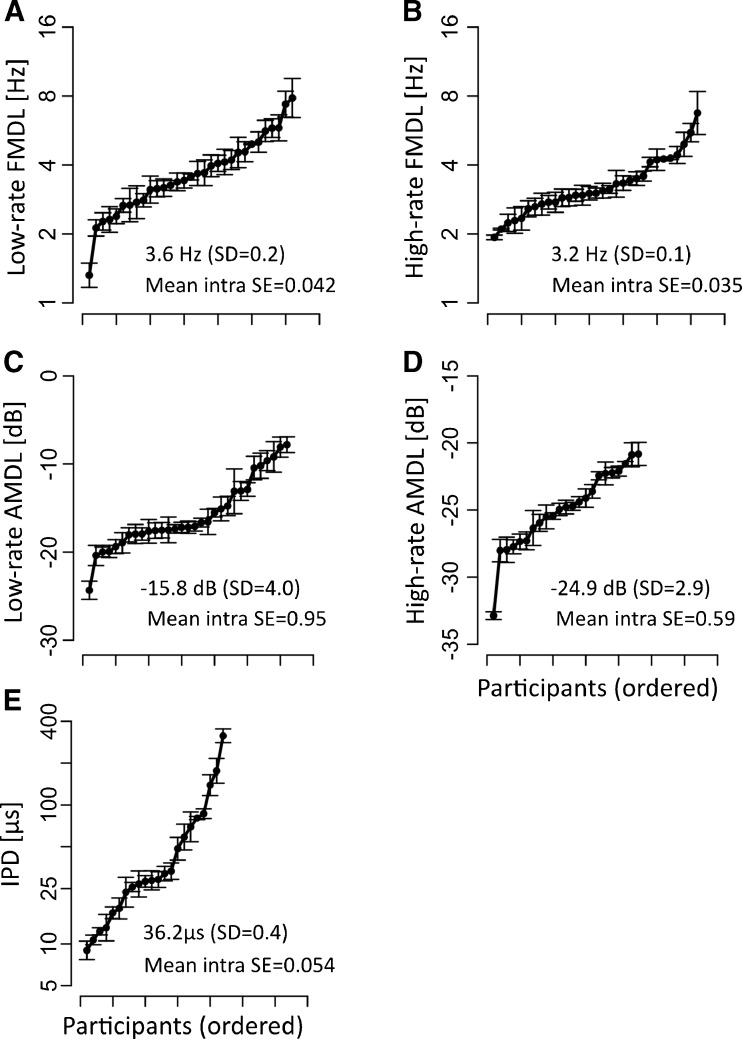
Individual FMDLs, AMDLs, and IPD thresholds are given in Fig. 2. Mean thresholds and standard deviations (base-10 logarithmic scale) are also shown in the panels. The inter-individual variation of psychoacoustic thresholds was generally more than five times larger than the intra-individual variation (Fig. 2).
FIG. 2.
Psychoacoustic thresholds of individual listeners. The symbols and error bars show means and standard errors (on a logarithmic scale), respectively. Each panel represents one task: A low-rate FMDLs, B high-rate FMDLs, C low-rate AMDLs, D high-rate AMDLs, and E IPDs. The participants are ordered along the x-axis according to their threshold. The ordering was done independently for each task and was different for each task. The average threshold for each task (with standard deviation) and mean intra-individual variation for each threshold (mean intra SE) are given as an inset in each panel.
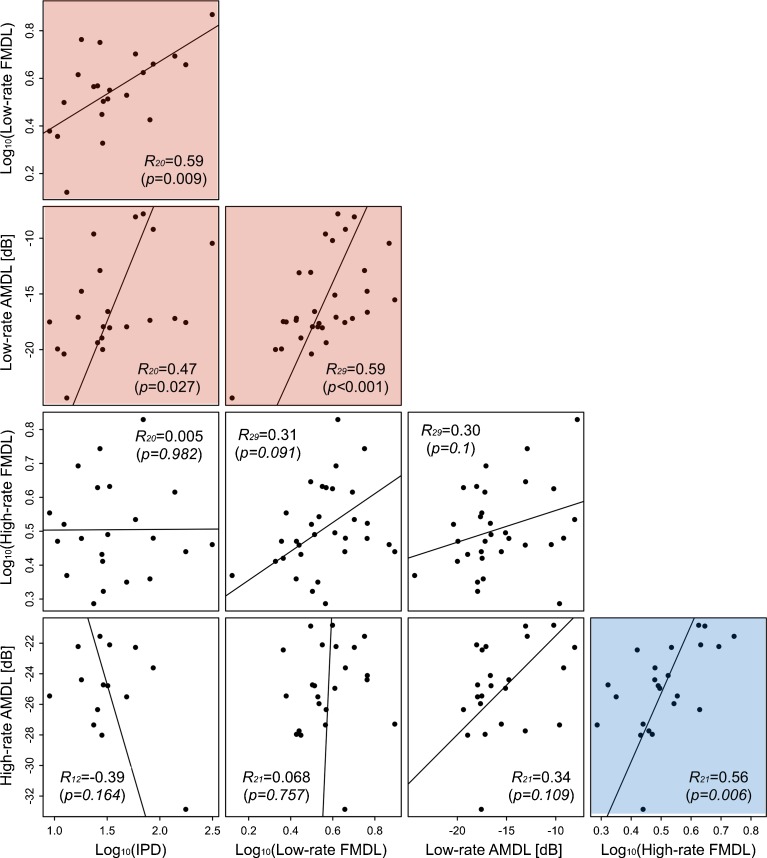
The correlations among thresholds for all tasks are summarized in Fig. 3. Significant correlations were found between IPD thresholds, low-rate FMDLs, and low-rate AMDLs (red background) and between high-rate AMDLs and high-rate FMDLs (blue background).
FIG. 3.
Scatterplots of thresholds for pairs of tasks. Each panel represents one pair. Each symbol represents one participant. Regression lines were derived from linear orthogonal regression. Pearson correlation coefficients are shown with subscripts indicating the number of participants, and p values are indicated in parentheses. Significant correlations were found among IPD thresholds, low-rate AMDLs, and low-rate FMDLs (red background) and among high-rate AMDLs and high-rate FMDLs (blue background).
The correlations found among IPD thresholds, low-rate FMDLs, and low-rate AMDLs are likely to reflect a common factor among the three measures rather than separate factors that are specific to individual pairs. This is because a PCA applied to thresholds for the three tasks indicated that the first component (CM1), which had an eigenvalue of 2.1 and contribution of 69.7 % and the second and the third components had eigenvalues of less than 1.0. CM1, was expressed as follows:
| 11 |
CM1 could account for 81.1, 74.1, and 62.9 % of variance in low-rate FMDLs, low-rate AMDLs, and IPD thresholds, respectively.
OAE Spectra
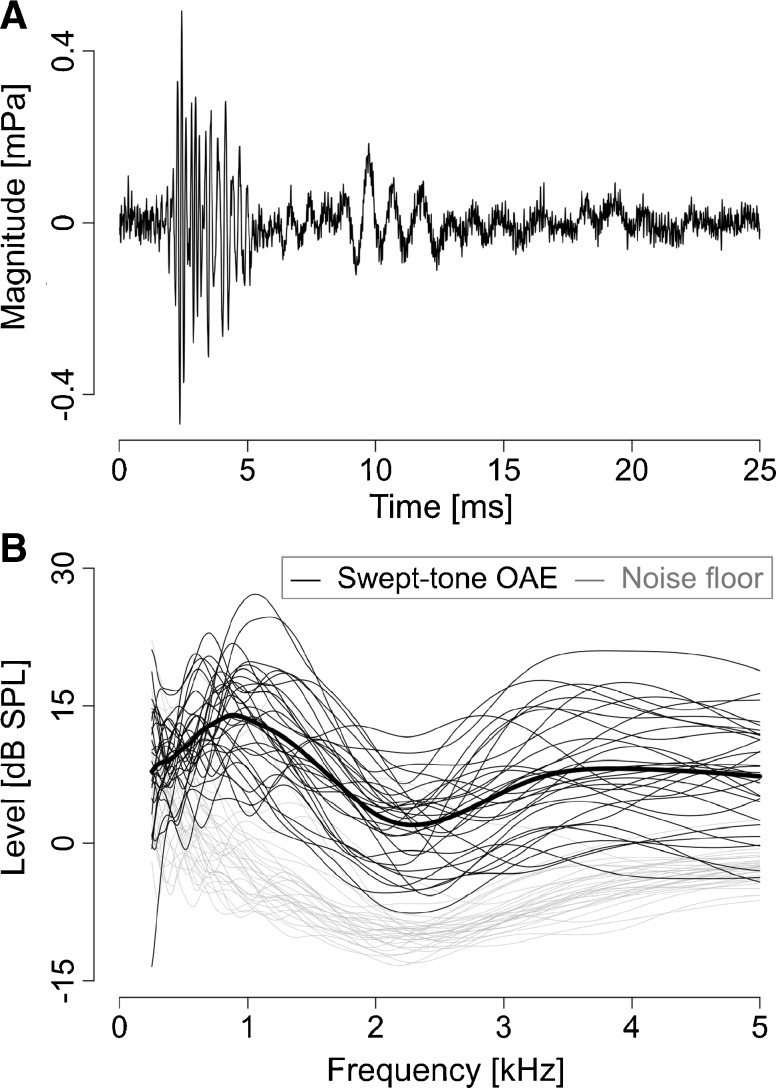
Typical swept-tone OAE waveforms are shown in Fig. 4A. In the swept-tone OAE spectra, the noise floor was low relative to the swept-tone OAE level (<−10 dB) except below 0.5 kHz (Fig. 4B). The swept-tone OAE spectra tended to have a dip around 2–2.5 kHz. This tendency has also been observed in other studies (e.g., Schairer et al. 2003).
FIG. 4.
A A typical TSPEOAE waveform. B TSPEOAE spectra, derived from wavelet analysis. Individual data are plotted as thin lines. Gray lines indicate the noise floor.
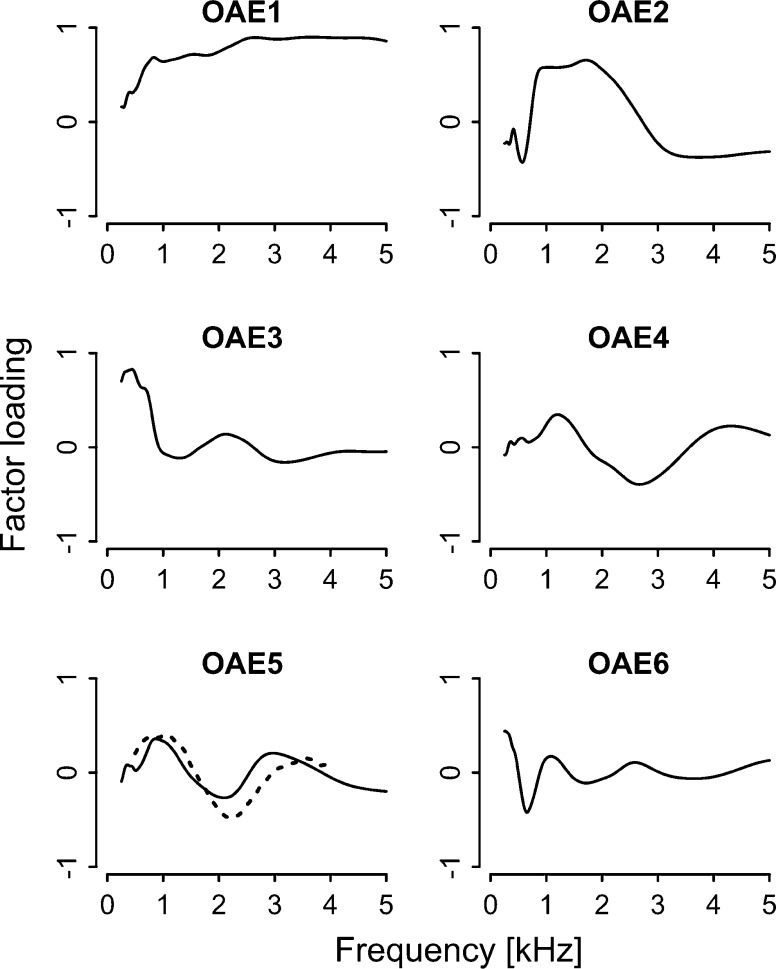
The swept-tone OAE spectra were decomposed into six components by performing PCA on vectors of OAE spectra ranging from 0.25 to 5 kHz (476 data points), with each vector representing one participant. The factor loadings of the derived PCs are shown in Fig. 5. The contributions of the PCs were 62.9 % (OAE1), 16.9 % (OAE2), 6.6 % (OAE3), 4.8 % (OAE4), 3.1 % (OAE5), and 1.8 % (OAE6), and eigenvalues of all components were above 1.0. High cumulative contributions (a total of 96.0 %) and high individual eigenvalues ensured that these PCs could describe the main features of the OAE spectra. It appeared that OAE1 captured the overall response strength and that OAE2 mainly reflected the response strength around 1–2 kHz. OAE3-5 represented more detailed oscillation patterns of the spectrum.
FIG. 5.
Factor loadings of PCs extracted from the swept-tone OAE spectra. C3 in Otsuka et al. (2014) was similar to OAE5 (indicated by a dotted line superimposed on OAE5).
Relation of the OAE Components and Psychoacoustic Thresholds
Multiple regression analysis with the LOOCV-based variable selection (see “METHODS” section) showed that the selected OAE components could significantly (p < 0.05) account for IPD thresholds, low-rate AMDLs, and low-rate FMDLs. On the other hand, they failed to account for high-rate FMDLs and high-rate AMDLs by significant amounts with any combination of OAE components (summarized in Table TABLE 1). The derived regression equations, for the three significant cases, are as follows:
| 12 |
| 13 |
| 14 |
TABLE 1.
Summary of regression analysis
| Low-rate FMDL | High-rate FMDL | Low-rate AMDL | High-rate AMDL | IPD | CM1 | OAE5 | |
|---|---|---|---|---|---|---|---|
| OAE | 0.26 (p=0.002) | 0.04 | 0.17 (p=0.046) | 0.075 | 0.16 (p=0.037) | 0.26 (p=0.009) | (Orthogonal) |
| Middle ear | 0.035 | 0.18 (p=0.04) | 0.27 (p=0.005) | 0.24 | 0.07 | 0.11 | 0.23 (p=0.018) |
| audiometry | 0.035 | 0.082 | 0.0063 | 0.014 | 0.064 | 0.047 | 0.032 |
Adjusted R-square for each regression is shown with significance
The asterisks after the coefficient refer to its significance: a predictor (OAE-related component) that has a low p value is likely to be a meaningful addition to the regression model. To ensure that the analyses were not predominantly influenced by the results for a few participants with extreme data, Cook’s distance (Cook 1977) was computed for each participant in the above regressions; a distance >1 for a given participant indicates that the participant can be regarded as an outlier. All of the Cook’s distances were below 0.5, which means that the above regressions did not include potential outliers.
Equations (12)–(14) all incorporated OAE5, which showed a characteristic dip at around 2 kHz (see Fig. 5). The result for low-rate FMDLs [Eq. (10)] is consistent with the previous study (Otsuka et al. 2014), which also found a significant correlation between low-rate FMDLs and the PC of the CEOAE spectrum representing a characteristic dip at around 2 kHz (component C3 in Otsuka et al. 2014, shown in Fig. 4).
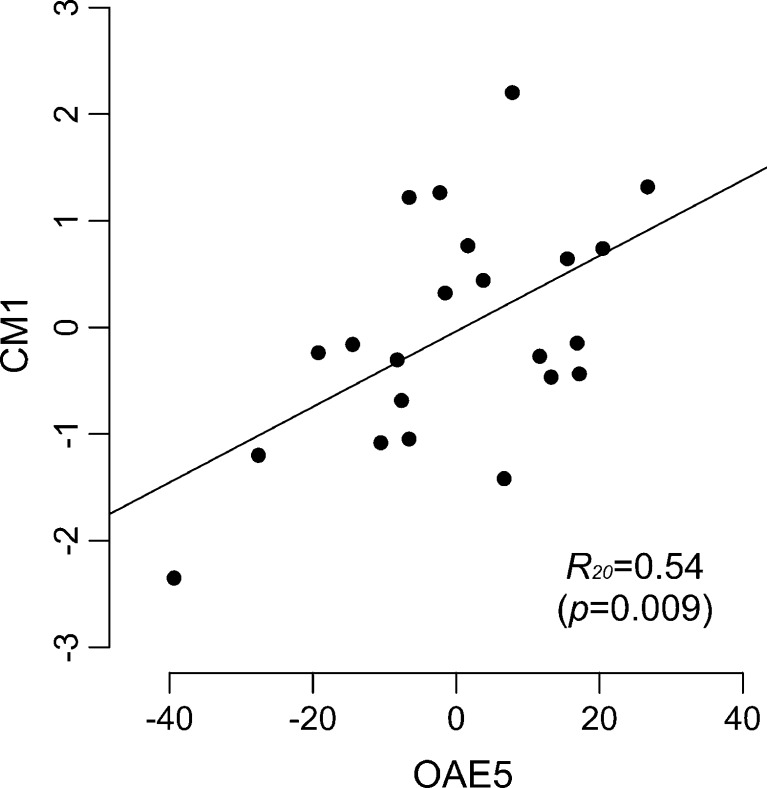
A multiple regression analysis with LOOCV-based variable selection (see “METHODS” section) revealed that OAE5 alone could significantly account for CM1. The derived equation was as follows:
| 15 |
The comparison between CM1 and OAE5 is shown in Fig. 6. The positive coefficient of OAE5 indicates that participants with relatively large dips at around 2 kHz in the OAE spectrum tended to have higher (poorer) thresholds in these psychoacoustic tasks.
FIG. 6.
Relationship between CM1 (a PC for the IPD thresholds, low-rate AMDLs, and low-rate FMDLs) and OAE5. Each symbol represents one participant. The straight line is the best fitting line using the least squares method. The correlation coefficient is shown with the p value in parentheses.
Relation Between Ear Canal Reflectance and Psychoacoustic Thresholds
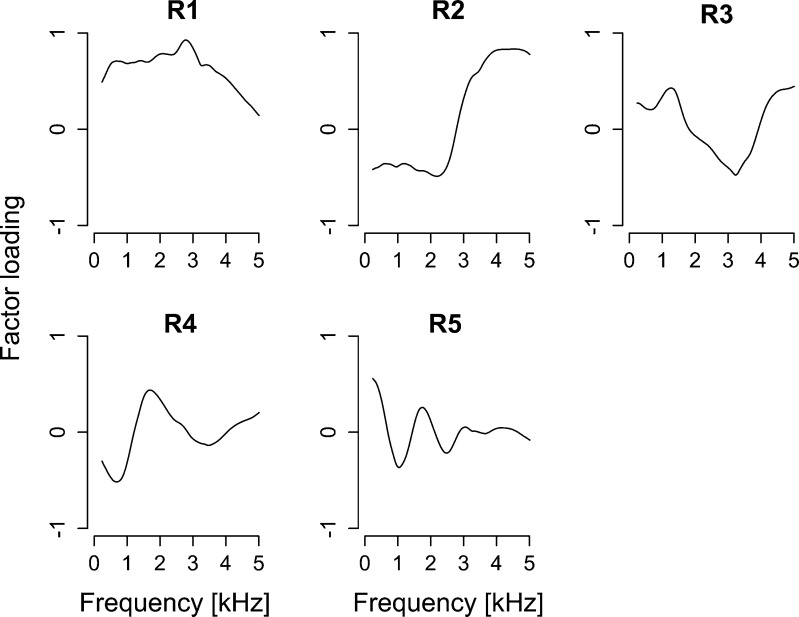
The extent to which middle ear function (revealed as the ear canal reflectance) can account for OAE5 and the performance of the psychoacoustic tasks was examined. A PCA was applied to the ear canal reflectance functions. Extracted PCs from ear canal reflectance functions are summarized in Fig. 7. The first to fifth PCs were selected for ear canal reflectance (contributions of 44.0 % (R1), 31.6 % (R2), 9.2 % (R3), 6.5 % (R4), and 3.3 (R5); cumulative contribution of 94.6 %). The multiple regression analysis with LOOCV-based variable selection was performed. The derived regression equations are:
| 16 |
| 17 |
| 18 |
FIG. 7.
Factor loadings of first to fourth principal components (R1–R6) extracted from ear canal reflectance. The cumulative contribution of R1–R6 was 97.7 %.
Although OAE5, low-rate AMDLs, and high-rate FMDLs were partly explained by middle ear factors, the other thresholds including the common factors underlying low-rate FMDLs, low-rate AMDLs, and IPD were not explained by middle ear factors.
Audiogram Cannot Account for the Variation of Psychoacoustic Thresholds
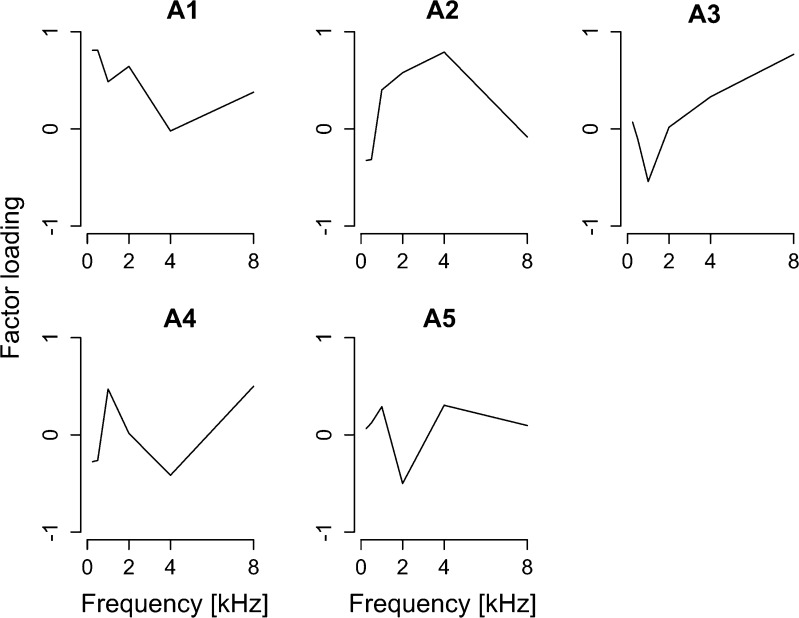
The analysis examined the extent to which audiogram can account for OAE5 and the performance of the supra-threshold psychoacoustic tasks. The PCA was performed on vectors of audiometric thresholds at 0.25, 0.5, 1, 2, 4, and 8 kHz, obtained from individual participants. The extracted PCs are shown in Fig. 8: The first to fourth PCs were extracted (contributions of 35.0 % (HL1), 22.2 % (HL2), 16.8 % (HL3); cumulative contribution of 74.0 %). A multiple regression analysis with LOOCV-based variable selection was performed. None of the psychoacoustic thresholds and OAE5 were explained by the factors revealed in the audiogram.
FIG. 8.
Factor loadings of first to fourth principal components (HL1–HL3) extracted from the audiograms. The cumulative contribution of HL1–HL3 was 74.0 %.
The audiometric threshold specifically at 2 kHz showed no significant correlation with OAE5, characterized by a characteristic dip at around 2 kHz. The pure-tone threshold at 1 kHz was not correlated with any psychoacoustic performance, which was measured with 1-kHz stimuli, except for the 2-Hz FMDL (T 29 = 2.15, p = 0.04). Thus, we do not have evidence indicating a strong link between frequency-dependent cochlear gain and OAE5/psychoacoustic measures.
A Cochlear Model Indicates the Relation Between OAE Feature and Phase Response of the BM
The analyses above indicated a relationship between a component of OAE spectrum and performance of (presumably) TFS-based psychoacoustic tasks. Otsuka et al. (2014) argued the irregularity of gain profiles along the BM as a possible explanation for this relationship. The analyses in this section were conducted to test the plausibility of the explanation with a simple transmission line model of the BM that incorporates an irregular gain profile and can generate OAEs (e.g., Choi et al. 2008). Specific goals of the analyses were to confirm that the irregularity profile affects the BM phase responses, which were assumed to influence the TFS-based task performance, and that a specific OAE spectral pattern, namely, a dip at 2 kHz, is associated with the profile-dependent BM phase responses.
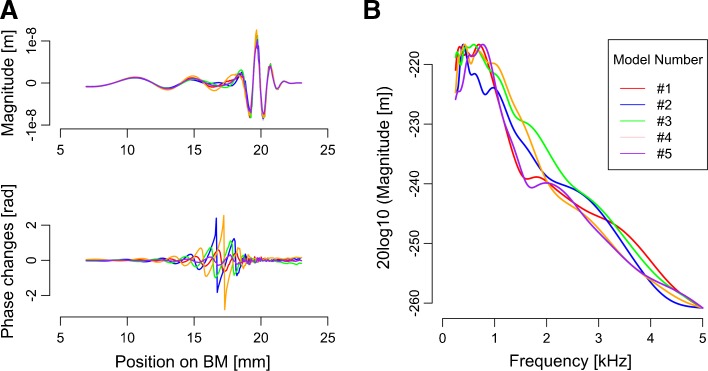
For each cochlear model with a particular random gain profile, the deviation of the phase response of the traveling wave from that for the smooth cochlear model was evaluated (Fig. 9A, upper panel). The effect of the irregularity on the phase response was largest around the slightly basal region from the traveling wave peak (five examples are shown in Fig. 9A, bottom panel).
FIG. 9.
A Snapshots of the traveling wave responding to 1 kHz pure tone at 90 ms after the onset of the stimulus (top panel) and phase changes relative to the smooth cochlear output (bottom panel). B Typical simulated CEOAE spectra derived from wavelet analysis. In each graph, five examples calculated from models with a different irregularity profile are shown in different colors.
The model with implemented irregularity also generated (simulated) CEOAEs, and the shape of the OAE spectra depended on the implemented irregularity profile. Five examples of CEOAE spectra are shown in Fig. 9B. The simulated OAE spectra exhibited monotonic decreases above 2 kHz. This tendency was not found in empirical OAE spectra (Fig. 4). The difference is possibly due to a difference in the OAE extraction methods: the linear windowing method for the model and the double-evoking method for the experiment (see “METHODS” section).
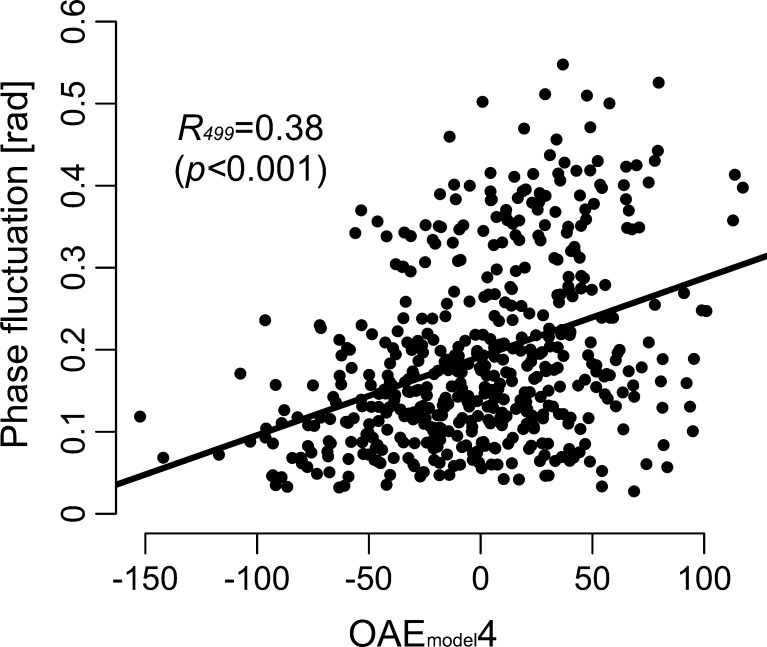
Similarly to the empirically obtained CEOAE spectra described earlier, the simulated CEOAE spectra were decomposed into ten components by using PCA. The contributions of the PCs were 31.4 % (OAEmodel1), 19.1 % (OAEmodel2), 13.9 % (OAEmodel3), 9.3 % (OAEmodel4), 6.4 % (OAEmodel5), and 5.0 % (OAEmodel6) and eigenvalues of all components were above 1.0. High cumulative contributions (a total of 85.2 %) and high individual eigenvalues ensured that these PCs could describe the main features of the OAE spectra. The decreasing trend observed in high-frequency region of the simulated OAE spectra is captured mostly by the OAE1model. Some principal components resembled those extracted from human OAEs: OAEmodel2, OAEmodel4, and OAEmodel6 resembled OAE4, OAE5 (C3), and OAE6, respectively (Fig. 10). The size of the total phase changes from the smooth cochlear model (see “METHODS” section) significantly correlated with OAEmodel4 (r = 0.38, p < 0.001; Fig. 11), and this correlation coefficient was higher than the other combinations (|r| < = 0.31).
FIG. 11.
Relationship between OAEmodel4 and the total phase fluctuation induced by impedance irregularities. Each symbol represents one cochlear model. The straight line is the best fitting line using the least-squares method. The correlation coefficient is shown with the p value in parentheses.
DISCUSSION
Comparison with Previous Studies
The mean thresholds obtained in the present study fell within a range similar to that obtained in earlier comparable studies, such as IPD thresholds in Henning (1983), low-rate FMDLs in Otsuka et al. (2014) and Buss et al. (2004), high-rate FMDLs in Strelcyk and Dau (2009), and high-rate AMDLs in Kohlrausch et al. (2000). Low-rate AMDLs were larger than high-rate AMDLs, which is consistent with the study of Moore and Sek (1995).
The spectra of swept-tone OAEs showed a characteristic dip at around 2–2.5 kHz. A similar pattern was observed for CEOAE spectra in earlier studies (Sisto and Moleti 2005; Siegel and Hirohata 1994; Otsuka et al. 2014). In the present study, the OAE spectra were decomposed into six components. The first and second components were similar to those extracted from CEOAE spectra in Otsuka et al. (2014): It appeared that OAE1 captured the overall response strength, and OAE2 mainly reflected the response strength around 1–2 kHz. The two studies are consistent also in that there was a component that reflected the characteristic dip at around 2–2.5 kHz (OAE5 in the present study): Otsuka et al. (2014) found a significant correlation between low-rate FMDLs and the PC of the CEOAE spectrum representing a characteristic dip at around 2 kHz (component C3 in Otsuka et al. 2014, shown in Fig. 4).
The weight of OAE5 consistently exhibited a significant correlation with low-rate FMDLs. OAE5 and C3 differed in the order of the PCs, which was probably due to differences in procedural details. One new finding of the present study is that OAE-related components can partially account for inter-individual variation of low-rate AMDLs and IPD thresholds: OAE5 can account for 17 % of inter-individual variation of IPD, and OAE5 and a few other components (OAE2 and OAE3 that represented oscillation patterns of the spectrum) can explain 16 % of inter-individual variation of low-rate AMDLs.
Correlation Among Psychoacoustic Measures
A significant correlation between low-rate FMDLs and IPD thresholds, as found in the present study, has been reported previously (Strelcyk and Dau 2009). This correlation, together with other earlier findings on the relationship between the performance of monaural and binaural TFS tasks (Hopkins and Moore 2011; Moore et al. 2012), can be interpreted as indicating that binaural TFS processing is partly determined by the efficiency of monaural TFS processing. The present study also found a significant correlation between high-rate FMDLs and high-rate AMDLs. This correlation could be interpreted as reflecting inter-individual variation of sensitivity to amplitude modulation; high-rate FMDLs are considered to rely mainly on the FM-AM conversion process (Moore and Sek 1996; Gilbert and Lorenzi 2006).
A somewhat unexpected finding was that low-rate AMDLs were correlated with IPD thresholds and low-rate FMDLs. The results of a PCA implied that a common factor (i.e., CM1) underlays the three tasks. This was unexpected because it has usually been assumed that AMDLs reflect sensitivity to changes in the envelope of the waveform on the BM, whereas low-rate FMDLs and IPD thresholds reflect sensitivity to TFS.
The peripheral coding mechanism, again, might account for the low-rate AMDL at least partially. Heinz et al. (2001) and Carney (1994) proposed an intensity discrimination model based on level-dependent changes in the neural phase-locking pattern associated with the nonlinear cochlear amplifier: the AN and BM response to tones with frequency below CF lags behind the phases for lower-intensity stimuli and those to tones with frequency above CF leads the phases for lower-intensity stimuli (Anderson et al. 1971; Ruggero et al. 1997). This account is consistent with the notion of a “sluggish” TFS decoding mechanism (Moore and Sek 1996; see also “INTRODUCTION” section).
Given the contribution of the efficiency of temporal coding, what are the sources of inter-individual variation? One can naturally speculate neuronal factors as candidate sources. Recent animals and modeling studies showed that exposures to moderate-level sounds, which do not induce permanent hearing loss, can cause loss of spiral ganglion cells (Maison et al. 2013; Kujawa and Liberman 2009). This leads to undersampling of the supra-threshold sound and degraded quality of encoding both for the temporal envelope and TFS (Lopez-Poveda and Barrios 2013). Indeed, Bharadwaj et al. (2015) suggested that the loss of spiral ganglion cells would result in a large difference in temporal coding among normal-hearing listeners.
The correlation of CM1 with an OAE component observed in the present study implies additional factors that incorporate the BM’s mechanical properties, because the degree of degradation of afferent nerve properties alone cannot explain BM’s mechanical properties, which determine the characteristics of OAE. Detailed mechanical characteristics, e.g., the phase response, can influence temporal processing. For instance, comparison of relative phases of the outputs between two adjacent and distinct regions on the BM has been proposed to serve as physiologically realistic cues for frequency discrimination (Loeb et al. 1983; Carlyon et al. 2012), interaural time difference detection (Shamma 1989), and intensity discrimination (Heinz et al. 2001; Carney 1994).
Relation Between OAEs and Psychoacoustic Performance
OAE5, which has a dip at around 2 kHz, was significantly correlated with the common factor among IPDs, low-rate AMDLs, and low-rate FMDLs (i.e., CM1). Assuming the contribution of TFS cue for low-rate AM detection (see a previous section), this result supports the hypothesis that cochlear mechanical characteristics specifically influence TFS coding.
How are the mechanical characteristics of the BM, as represented by OAE5 (the component with a dip at 2–2.5 kHz), linked to the performance of the three psychoacoustic tasks? OAE5 might reflect the pattern of the irregularities; the swept-tone OAE or CEOAE is considered to be a wave reflected by mechanical irregularities on the BM, such as spatial variations in the number or geometry of OHCs (Zweig and Shera 1995; Choi et al. 2008), and Hilger et al. (1995) reported that the overall CEOAE level is partly determined by the degree of irregularity. The mechanical irregularity profile on the BM could influence the performance of psychoacoustic tasks that require efficient TFS coding. It has been proposed that comparison of relative phases of the outputs between two adjacent and distinct regions on the BM is a physiologically realistic way to extract TFS information for frequency discrimination (Loeb et al. 1983; Carlyon et al. 2012), interaural time difference detection (Shamma 1989), masking (Carney et al. 2002), and intensity discrimination (Heinz et al. 2001; Carney 1994; Colburn et al. 2003). A pattern of mechanical irregularities, which generates a dip at around 2 kHz in OAE spectra as in OAE5, might change the relative phases of the outputs along the BM and might thereby influence the effectiveness of the TFS coding. This in turn would be reflected in low-rate AMDLs and FMDLs and IPD thresholds.
This hypothesis is partly supported by the cochlear model incorporating the impedance irregularity on the BM mechanical characteristics. Certain PCs derived from the simulated and empirical OAE spectra shared similar patterns (OAE2model, OAE4model, and OAE6model versus OAE4, OAE5, and OAE6, respectively). Further, OAE4model, which has a characteristic dip at around 2 kHz as in OAE5, exhibited the highest correlation with the size of fluctuation in the phase response of the BM, which would presumably interfere with TFS coding based on the relative phase of the BM motion (e.g., Carlyon et al. 2012). The present model analyses with the simple assumption did not allow detailed quantitative comparisons between OAE and performance-related TFS coding. Nevertheless, the results generally indicate that irregularity profiles that contribute to an OAE component (with a characteristic dip around a certain frequency as in OAE5 and OAE4model) also influence the phase response of the BM, which is a basis of TFS coding.
There is no physiological evidence that a specific irregularity profile generates a dip at around 2 kHz. Nevertheless, coherent reflection theory (Zweig and Shera 1995), which is the prevailing theory for explaining the generation of OAEs, can provide insights as to what patterns of irregularity generate the characteristic dip at around 2 kHz in OAE spectra. According to this theory, the energy of the reflected wave is enhanced when the spatial frequency (f s) of these irregularity patterns is equal to 2/λ peak , where λ peak is the wavelength of the traveling wave at its peak. In this condition, the reflected waves from the peak are combined in phase (i.e., coherently) and dominate CEOAEs, because the magnitude at the peak is much higher than in the other regions. This theory predicts a characteristic dip at around 2 kHz in OAE spectra when the amount of irregularity is smallest around the spatial frequency of 2/λ peak (2 kHz) (the wavelength of the traveling wave produced by a 2-kHz tone).
Some normal-hearing listeners who exhibit an OAE with a dip at 2 kHz (i.e., OAE5) might have such an irregularity profile by nature. Wright (1984) reported that there are variations in the OHC arrangement, such as the random appearance and disappearance of the third row of OHCs or a missing single OHC, in the human cochlear with normal hearing sensitivity. Those random intrinsic structural variations may have characteristics such that the amount of irregularity is smallest around the spatial frequency of 2/λ peak (2 kHz), presumably by chance. Of course, such an irregularity profile might be generated by a small amount of OHC loss associated with aging or exposures to noise. Nevertheless, the amount of OHC loss might not be so important, because coherent reflection filtering theory and the cochlear model predict that only a specific irregularity pattern influences TFS coding.
With limited existing data, we should reserve the possibility that the observed correlations between the psychoacoustic and OAE measures are not due to a causal relationship between the two but to another factor that influences the two measures. Nevertheless, as described below, we were not successful in attaining compelling evidence for specifying such a factor.
Overall, it is difficult to explain the observed associations between OAE5 and psychoacoustic thresholds in terms of inter-individual differences in audibility or cochlear gain. Pure-tone thresholds at 2 kHz or audiogram-related PCs that have a dip at around 2 kHz (i.e., A5 in Fig. 5) did not correlate with OAE5 and psychoacoustic thresholds. Pure-tone thresholds at 1 kHz, at which the stimuli for the psychoacoustic measures were centered, were generally not correlated with psychoacoustic thresholds and OAE5. Further investigations are needed, however, given the exceptional significant correlation with 2-Hz FMDL and the earlier report by Heise et al. (2009) that AMDLs vary across frequency concomitantly with the microstructure of pure-tone thresholds.
We also examined possible contributions of middle ear factors to the observed association among psychoacoustic thresholds and OAE components. This argument is reasonable considering that both acoustic signals and OAEs are transmitted through the middle ear. Indeed, the inter-individual variation of low-rate AMDLs, high-rate FMDLs, and OAE5 could be partly explained by middle ear-related components (R3 and R4 in Fig. 7). However, no middle ear-related factors exhibited significant correlation with low-rate FMDLs and IPDs. Therefore, it is not likely that middle ear function is a factor that mediates the observed correlation between OAE5 and TFS-related psychoacoustic performance.
SUMMARY AND CONCLUSIONS
The present study demonstrated that the depth of the characteristic dip in swept-tone OAE spectra at 2–2.5 kHz is correlated with a common factor extracted by applying PCA to IPD thresholds, low-rate FMDLs, and low-rate AMDLs (R = 0.54) but not with any factor related to high-rate FMDLs and AMDLs. The results suggest that irregularity along the BM, as well as widely recognized neuronal factors (e.g., Bharadwaj et al. 2015), has an influence on the efficiency of coding of the TFS on the BM and that this influences IPD thresholds, low-rate FMDLs, and low-rate AMDLs.
ACKNOWLEDGMENTS
We are very grateful to Brian C. J. Moore for his helpful comments on an earlier version of the manuscript and Christian Lorenzi for helpful and stimulating discussions. We thank Julie Arenberg Bierer, the associate editor, and two anonymous reviewers for their helpful comments on an earlier version of the manuscript.
COMPLIANCE WITH ETHICAL STANDARDS
Conflict of Interest
We declare that we have no conflict of interest.
Contributor Information
Sho Otsuka, Email: otsuka.s@lab.ntt.co.jp.
Shigeto Furukawa, Email: furukawa.shigeto@lab.ntt.co.jp.
Shimpei Yamagishi, Email: yamagishi@u.ip.titech.ac.jp.
Koich Hirota, Email: k-hirota@h.k.u-tokyo.ac.jp.
Makio Kashino, Email: kashino.makio@lab.ntt.co.jp.
REFERENCES
- Anderson DJ, Rose JE, Hind JE, Brugge JF (1971) Temporal position of discharges in single auditory nerve fibers within the cycle of a sine-wave stimulus: Frequency and intensity effects. J Acoust Soc Am 49:113–11139 [DOI] [PubMed]
- Bharadwaj HM, Masud S, Mehraei G, et al (2015) Individual Differences Reveal Correlates of Hidden Hearing Deficits. J Neurosci 35:2161–2172 [DOI] [PMC free article] [PubMed]
- Bennett CL, Ozdamar O. Swept-tone transient-evoked otoacoustic emissions. J Acoust Soc Am. 2010;128:1833–1844. doi: 10.1121/1.3467769. [DOI] [PubMed] [Google Scholar]
- Buss E, Hall JW, 3rd, Grose JH. Temporal fine-structure cues to speech and pure tone modulation in observers with sensorineural hearing loss. Ear Hear. 2004;25:242–250. doi: 10.1097/01.AUD.0000130796.73809.09. [DOI] [PubMed] [Google Scholar]
- Carlyon RP, Long CJ, Micheyl C. Across-channel timing differences as a potential code for the frequency of pure tones. J Assoc Res Otolaryngol. 2012;13:159–171. doi: 10.1007/s10162-011-0305-0. [DOI] [PMC free article] [PubMed] [Google Scholar]
- Carney LH. Spatio-temporal encoding of sound level: models for normal encoding and recruitment of loudness. Hear Res. 1994;76:31–44. doi: 10.1016/0378-5955(94)90084-1. [DOI] [PubMed] [Google Scholar]
- Carney LH, Heinz MG, Evilsizer ME, Gilkey RH, Colburn HS. Auditory phase opponency: a temporal model for masked detection at low frequencies. Acta Acust- Acust. 2002;88:334–346. [Google Scholar]
- Choi Y-S, Lee S-Y, Parham K, et al. Stimulus-frequency otoacoustic emission: measurements in humans and simulations with an active cochlear model. J Acoust Soc Am. 2008;123:2651–2669. doi: 10.1121/1.2902184. [DOI] [PMC free article] [PubMed] [Google Scholar]
- Colburn HS, Carney LH, Heinz MG (2003) Quantifying the information in auditory-nerve responses for level discrimination. J Assoc Res Otolaryngol 4:294–311 [DOI] [PMC free article] [PubMed]
- Cook RD. Detection of influential observation in linear regression. Technometrics. 1977;19:15–18. [Google Scholar]
- Elliott SJ, Ku EM, Lineton B. A state space model for cochlear mechanics. J Acoust Soc Am. 2007;122:2759–2771. doi: 10.1121/1.2783125. [DOI] [PubMed] [Google Scholar]
- Epp B, Verhey JL, Mauermann M. Modeling cochlear dynamics: interrelation between cochlea mechanics and psychoacoustics. J Acoust Soc Am. 2010;128:1870–1883. doi: 10.1121/1.3479755. [DOI] [PubMed] [Google Scholar]
- Ernst SMA, Moore BCJ. Mechanisms underlying the detection of frequency modulation. J Acoust Soc Am. 2010;128:3642–3648. doi: 10.1121/1.3506350. [DOI] [PubMed] [Google Scholar]
- Feeney MP, Grant IL, Marryott LP. Wideband energy reflectance measurements in adults with middle-ear disorders. J Speech Lang Hear Res. 2003;46:901–911. doi: 10.1044/1092-4388(2003/070). [DOI] [PubMed] [Google Scholar]
- Gilbert G, Lorenzi C. The ability of listeners to use recovered envelope cues from speech fine structure. J Acoust Soc Am. 2006;119:2438–2444. doi: 10.1121/1.2173522. [DOI] [PubMed] [Google Scholar]
- Grose JH, Mamo SK. Processing of temporal fine structure as a function of age. Ear Hear. 2010;31:755–760. doi: 10.1097/AUD.0b013e3181e627e7. [DOI] [PMC free article] [PubMed] [Google Scholar]
- Grose JH, Mamo SK. Frequency modulation detection as a measure of temporal processing: age-related monaural and binaural effects. Hear Res. 2012;294:49–54. doi: 10.1016/j.heares.2012.09.007. [DOI] [PMC free article] [PubMed] [Google Scholar]
- Heinz MG, Colburn HS, Carney LH. Rate and timing cues associated with the cochlear amplifier: level discrimination based on monaural cross-frequency coincidence detection. J Acoust Soc Am. 2001;110:2065–2084. doi: 10.1121/1.1404977. [DOI] [PubMed] [Google Scholar]
- Heise SJ, Mauermann M, Verhey JL. Threshold fine structure affects amplitude modulation perception. J Acoust Soc Am. 2009;125:EL33–EL38. doi: 10.1121/1.3040031. [DOI] [PubMed] [Google Scholar]
- Henning GB. Lateralization of transient signals and types of delay. In: Klinke DR, Hartmann DR, editors. Hear. — Physiol. Bases Psychophys. Berlin Heidelberg: Springer; 1983. pp. 196–201. [Google Scholar]
- Hilger AW, Furness DN, Wilson JP. The possible relationship between transient evoked otoacoustic emissions and organ of Corti irregularities in the guinea pig. Hear Res. 1995;84:1–11. doi: 10.1016/0378-5955(95)00007-Q. [DOI] [PubMed] [Google Scholar]
- Hopkins K, Moore BCJ. The effects of age and cochlear hearing loss on temporal fine structure sensitivity, frequency selectivity, and speech reception in noise. J Acoust Soc Am. 2011;130:334–349. doi: 10.1121/1.3585848. [DOI] [PubMed] [Google Scholar]
- Joris PX, Schreiner CE, Rees A (2004) Neural Processing of Amplitude-Modulated Sounds. Physiol Rev 84:541–577 [DOI] [PubMed]
- Kalluri R, Shera CA (2013) Measuring stimulus-frequency otoacoustic emissions using swept tones. J Acoust Soc Am 134:356–368 [DOI] [PMC free article] [PubMed]
- Keefe DH. Double-evoked otoacoustic emissions. I Measurement theory and nonlinear coherence. J Acoust Soc Am. 1998;103:3489–3498. doi: 10.1121/1.423058. [DOI] [PubMed] [Google Scholar]
- Keefe DH, Ling R, Bulen JC. Method to measure acoustic impedance and reflection coefficient. J Acoust Soc Am. 1992;91:470–485. doi: 10.1121/1.402733. [DOI] [PubMed] [Google Scholar]
- Kemp DT (1978) Stimulated acoustic emissions from within the human auditory system. J Acoust Soc Am 64:1386–1391 [DOI] [PubMed]
- Kohlrausch A, Fassel R, Dau T. The influence of carrier level and frequency on modulation and beat-detection thresholds for sinusoidal carriers. J Acoust Soc Am. 2000;108:723–734. doi: 10.1121/1.429605. [DOI] [PubMed] [Google Scholar]
- Kujawa SG, Liberman MC (2009) Adding insult to injury: Cochlear nerve degeneration after “Temporary” noise-induced hearing loss. J Neurosci 29:14077–14085 [DOI] [PMC free article] [PubMed]
- Ku EM, Elliott SJ, Lineton B. Limit cycle oscillations in a nonlinear state space model of the human cochlea. J Acoust Soc Am. 2009;126:739–750. doi: 10.1121/1.3158861. [DOI] [PubMed] [Google Scholar]
- Lachenbruch PA, Mickey MR. Estimation of error rates in discriminant analysis. Technometrics. 1968;10:1–11. doi: 10.1080/00401706.1968.10490530. [DOI] [Google Scholar]
- Levitt H. Transformed up-down methods in psychoacoustics. J Acoust Soc Am. 1971;49:467–477. doi: 10.1121/1.1912375. [DOI] [PubMed] [Google Scholar]
- Lineton B, Lutman ME. Modeling the effect of suppression on the periodicity of stimulus frequency otoacoustic emissions. J Acoust Soc Am. 2003;114:859–870. doi: 10.1121/1.1582175. [DOI] [PubMed] [Google Scholar]
- Loeb GE, White MW, Merzenich MM. Spatial cross-correlation. Biol Cybern. 1983;47:149–163. doi: 10.1007/BF00337005. [DOI] [PubMed] [Google Scholar]
- Lopez-Poveda EA, Barrios P (2013) Perception of stochastically undersampled sound waveforms: a model of auditory deafferentation. Front Neurosci 7:124 [DOI] [PMC free article] [PubMed]
- Maison SF, Usubuchi H, Liberman MC (2013) Efferent feedback minimizes cochlear neuropathy from moderate noise exposure. J Neurosci 33:5542–5552 [DOI] [PMC free article] [PubMed]
- Moore BCJ, Sek A (1995) Effects of carrier frequency, modulation rate, and modulation waveform on the detection of modulation and the discrimination of modulation type (amplitude modulation versus frequency modulation). J Acoust Soc Am 97:2468–2478 [DOI] [PubMed]
- Moore BCJ, Sek A. Detection of frequency modulation at low modulation rates: evidence for a mechanism based on phase locking. J Acoust Soc Am. 1996;100:2320–2331. doi: 10.1121/1.417941. [DOI] [PubMed] [Google Scholar]
- Moore BCJ, Vickers DA, Mehta A. The effects of age on temporal fine structure sensitivity in monaural and binaural conditions. Int J Audiol. 2012;51:715–721. doi: 10.3109/14992027.2012.690079. [DOI] [PubMed] [Google Scholar]
- Morise M, Irino T, Banno H (2007) Warped-TSP: An acoustic measurement signal robust to background noise and harmonic distortion. Electron Comm Jpn Pt III 90:18–26
- Neely ST, Kim DO. A model for active elements in cochlear biomechanics. J Acoust Soc Am. 1986;79:1472–1480. doi: 10.1121/1.393674. [DOI] [PubMed] [Google Scholar]
- Otsuka S, Furukawa S, Yamagishi S, et al. Interindividual variation of sensitivity to frequency modulation: its relation with click-evoked and distortion product otoacoustic emissions. J Assoc Res Otolaryngol. 2014;15:175–186. doi: 10.1007/s10162-013-0439-3. [DOI] [PMC free article] [PubMed] [Google Scholar]
- Oxenham AJ, Shera CA (2003) Estimates of human cochlear tuning at low levels using forward and Simultaneous Masking. J Assoc Res Otolaryngol 4:541–554 [DOI] [PMC free article] [PubMed]
- Ruggero MA, Rich NC, Recio A, et al (1997) Basilar-membrane responses to tones at the base of the chinchilla cochlea. J Acoust Soc Am 101:2151–2163 [DOI] [PMC free article] [PubMed]
- Sek A, Moore BCJ (1995) Frequency discrimination as a function of frequency, measured in several ways. J Acoust Soc Am 97:2479–2486. [DOI] [PubMed]
- Schairer KS, Fitzpatrick D, Keefe DH. Input-output functions for stimulus-frequency otoacoustic emissions in normal-hearing adult ears. J Acoust Soc Am. 2003;114:944–966. doi: 10.1121/1.1592799. [DOI] [PubMed] [Google Scholar]
- Shamma SA. Stereausis: binaural processing without neural delays. J Acoust Soc Am. 1989;86:989–1006. doi: 10.1121/1.398734. [DOI] [PubMed] [Google Scholar]
- Siegel JH, Hirohata ET. Sound calibration and distortion product otoacoustic emissions at high frequencies. Hear Res. 1994;80:146–152. doi: 10.1016/0378-5955(94)90106-6. [DOI] [PubMed] [Google Scholar]
- Sisto R, Moleti A. On the large-scale spectral structure of otoacoustic emissions. J Acoust Soc Am. 2005;117:1234–1240. doi: 10.1121/1.1853208. [DOI] [PubMed] [Google Scholar]
- Strelcyk O, Dau T. Relations between frequency selectivity, temporal fine-structure processing, and speech reception in impaired hearing. J Acoust Soc Am. 2009;125:3328–3345. doi: 10.1121/1.3097469. [DOI] [PubMed] [Google Scholar]
- Tognola G, Grandori F, Ravazzani P. Time-frequency distributions of click-evoked otoacoustic emissions. Hear Res. 1997;106:112–122. doi: 10.1016/S0378-5955(97)00007-5. [DOI] [PubMed] [Google Scholar]
- Verhulst S, Dau T, Shera CA. Nonlinear time-domain cochlear model for transient stimulation and human otoacoustic emission. J Acoust Soc Am. 2012;132:3842–3848. doi: 10.1121/1.4763989. [DOI] [PMC free article] [PubMed] [Google Scholar]
- Wit HP, van Dijk P, Avan P. Wavelet analysis of real ear and synthesized click evoked otoacoustic emissions. Hear Res. 1994;73:141–147. doi: 10.1016/0378-5955(94)90228-3. [DOI] [PubMed] [Google Scholar]
- Wright A (1984) Dimensions of the cochlear stereocilia in man and the guinea pig. Hear Res 13:89–98 [DOI] [PubMed]
- Zweig G, Shera CA. The origin of periodicity in the spectrum of evoked otoacoustic emissions. J Acoust Soc Am. 1995;98:2018–2047. doi: 10.1121/1.413320. [DOI] [PubMed] [Google Scholar]


