Abstract
The auditory brainstem response (ABR) is an evoked potential that reflects the responses to sound by brainstem neural centers. The binaural interaction component (BIC) is obtained by subtracting the sum of the monaural ABR responses from the binaural response. Its latency and amplitude change in response to variations in binaural cues. The BIC is thus thought to reflect the activity of binaural nuclei and is used to non-invasively test binaural processing. However, any conclusions are limited by a lack of knowledge of the relevant processes at the level of individual neurons. The aim of this study was to characterize the ABR and BIC in the barn owl, an animal where the ITD-processing neural circuits are known in great detail. We recorded ABR responses to chirps and to 1 and 4 kHz tones from anesthetized barn owls. General characteristics of the barn owl ABR were similar to those observed in other bird species. The most prominent peak of the BIC was associated with nucleus laminaris and is thus likely to reflect the known processes of ITD computation in this nucleus. However, the properties of the BIC were very similar to previously published mammalian data and did not reveal any specific diagnostic features. For example, the polarity of the BIC was negative, which indicates a smaller response to binaural stimulation than predicted by the sum of monaural responses. This is contrary to previous predictions for an excitatory-excitatory system such as nucleus laminaris. Similarly, the change in BIC latency with varying ITD was not distinguishable from mammalian data. Contrary to previous predictions, this behavior appears unrelated to the known underlying neural delay-line circuitry. In conclusion, the generation of the BIC is currently inadequately understood and common assumptions about the BIC need to be reconsidered when interpreting such measurements.
Keywords: Binaural interaction component, Barn owl, Binaural processing, Auditory brainstem response, Interaural time differences
Introduction
The auditory brainstem response (ABR) is an evoked potential that reflects the summed responses to sound by brainstem neural centers. It consists of a series of waves, which represent the activity of successive nuclei of the ascending auditory pathway (Huang and Buchwald 1978). ABR measurements are technically simple and non-invasive. Both the amplitudes and latencies of its different waves are used to evaluate different aspects of hearing in humans and other animals. The binaural interaction component (BIC) is derived by subtracting the sum of both monaural ABRs from the ABR obtained with binaural stimulation (Dobie and Berlin 1979) and is assumed to reflect binaural processing (Jones and Van der Poel 1990). The BIC is an attractive tool to probe binaural processing and to detect disturbances in binaural functionality in a non-invasive way (Furst et al. 1990).
In guinea pigs (Dobie and Berlin 1979; Goksoy et al. 2005), cats (Ungan et al. 1997), gerbils (Laumen et al. 2016b), and humans (Riedel and Kollmeier 2002a, b), only specific ABR waves (wave V in humans and wave IV in other mammals) have BIC waves associated with them. All BICs reported thus far reflect a response to binaural stimulation with a smaller amplitude than the sum of monaural responses. However, there is no consensus regarding the generator of the BIC in mammals (review in Laumen et al. 2016a).
The superior olivary complex (SOC) is the first site in the ascending auditory pathway where binaural processing takes place. Neurons in the medial superior olive (MSO) with low best frequencies are sensitive to interaural time differences (ITD). They receive predominantly excitatory input from both ears and fire maximally upon coincidence detection between those inputs (Goldberg and Brown 1968, 1969). Additionally, well-timed glycinergic inhibition was suggested to play a key role in tuning MSO cells to specific ITDs (Brand et al. 2002; Pecka et al. 2008; Grothe et al. 2010; Myoga et al. 2014). Other studies suggested that inhibition in MSO serves to narrow the window for coincidence detection (Roberts et al. 2013) or to improve the dynamic range of these neurons (van der Heijden et al. 2013). The lateral superior olive (LSO) contains mainly neurons that are sensitive to interaural level differences (ILD; Goldberg and Brown 1968, 1969; Tollin 2003) and to the ITD of envelopes of amplitude-modulated sounds (Joris and Yin 1995). These neurons are excitatory-inhibitory (EI), which means that they receive excitatory inputs from the ipsilateral ear and inhibitory inputs from the contralateral ear, firing minimally upon coincidence detection (Joris and Yin 1995). Either the MSO or LSO, or both, could be the source of the BIC.
The barn owl (Tyto alba) is a well-studied animal model for sound localization. Both anatomy and physiology of the neural circuits involved are known in great detail (review in Konishi 2003). Nucleus laminaris (NL, the first site of ITD processing in birds) consists of neuron arrays receiving input from systematically arranged axonal delay lines, very similar to the classic Jeffress model (Jeffress 1948). Coincidence detectors in barn owl NL receive excitatory inputs from both ears (EE) and fire maximally when they coincide in time (Carr and Konishi 1990). Although cells in NL are known to receive GABAergic inhibition from the superior olivary nucleus, there is a strong evidence that these inhibitory projections sharpen ITD selectivity and serve as a gain control, maintaining ITD-selective modulation at higher sound pressure levels (review in Ohmori 2014). Thus, inhibition does not play a significant role in shaping the principal binaural response of NL neurons. The posterior part of the dorsal lateral lemniscus (LLDp, formerly VLVp) is the functional equivalent of the mammalian LSO in the barn owl. Neurons in the LLDp are inhibited by ipsilateral stimulation and excited by contralateral stimulation (IE, the reverse of LSO) (Moiseff and Konishi 1983). Importantly, LLDp neurons show no sensitivity to ITD (Moiseff and Konishi 1983), which may be related to the poor representation of best frequencies below approximately 3 kHz (Manley et al. 1988). The only site besides NL that shows sensitivity to ITD, the anterior part of the dorsal lateral lemniscus (LLDa), receives its only known input from NL (Takahashi and Konishi 1988), and also responds in an EE fashion (Moiseff and Konishi 1983). The barn owl should thus represent a comparatively simple case for correlating the characteristics of the underlying neural circuitry and the resulting BIC. The aim of the present study was to examine the ABR and associated BIC, in response to variations in ITD, in the barn owl.
Methods
Experimental Animals and Preparation
We report ABR data from nine adult European barn owls (T. alba) aged between 6 months and 4 years. Two additional animals were used for compound action potential (CAP) and cochlear microphonic (CM) recordings. All protocols and procedures were approved by the authorities of Lower Saxony, Germany (permit No. AZ 33.9-42502-04-14/1595). Animals were anesthetized with an initial dose of ketamine (10 mg/kg) and xylazine (3 mg/kg) via intramuscular injection. Smaller doses of ketamine and xylazine were administered periodically to maintain anesthesia. The depth of anesthesia was constantly monitored via electrocardiogram (EKG) recordings using intramuscular needle electrodes in a wing and in the contralateral leg. Cloacal temperature was monitored and maintained at 39 °C, using a homeothermic blanket system (Harvard Apparatus).
For ABR recordings, a small cut was made in the scalp to expose the bone, and an 18-gauge needle was inserted through the outer skull into the middle-ear cavity to provide a vent that avoids the buildup of negative pressure under anesthesia (Larsen et al. 1997). The cannula was left in place for the duration of the experiment. During the recordings, the animal’s head was fixed in position by a custom-made beak holder attached to a stereotaxic frame (Kopf Instruments, Tujunga, California, USA). After finishing the recordings, the cannula was removed, and the skin wound was sealed with tissue glue. The animal was given a non-steroidal antiphlogistic agent (meloxicam, 0.2 mg/kg) and left to recover in a quiet box before being returned to its aviary.
For CAP and CM recordings, the animal’s head was more firmly held by cementing the skull to a metal plate connected to the stereotaxic frame. The neck muscles were retracted and the middle ear cavity was accessed dorsally via an opening in the parietal bone. After the experiment, the animal was euthanized with an overdose of pentobarbital and perfused transcardially with 4 % paraformaldehyde.
Recordings and Calibration
All recordings were performed inside a double-walled, sound-attenuating chamber (Industrial Acoustics Corporation, Winchester, UK). Closed, custom-made sound systems were inserted into both ear canals for controlled stimulation. These systems consisted of small Etymotic earphones (ER-2 by Etymotic Research, Illinois, USA) coupled to the hollow ear bars of the stereotaxic holder and miniature microphones (Knowles FG-23329). The miniature microphones were previously calibrated using a Brüel and Kjaer microphone (4134; Naerum, Denmark) as the reference. Sound pressure levels (dB SPL) were then individually calibrated for each ear.
In the case of ABR recordings, two platinum needle electrodes (Grass Technologies, West Warwick, Rhode Island, USA) were placed under the skin: an active electrode on the vertex and a reference on the neck midline. For CAP and CM recordings, a silver-wire electrode with a small pellet melted at the tip was placed in contact with the round window. In both cases, signals were amplified 10,000 times, using a DAM 80 amplifier (World Precision Instruments, Florida, USA) and band-pass filtered between 0.1 and 10 kHz. Calibration, stimulus generation, and recording were handled by a Hammerfall DSP Multiface II sound card (RME Audio, Haimhausen, Germany) driven by custom MATLAB (The Mathworks, Inc., Natick, Massachussets, USA) scripts (OnlineABR, created by Rainer Beutelmann). The sampling rates for stimuli and recordings were 48 kHz.
Stimulus Characteristics
Cochlear responses at the round window were measured using pure tones at 1, 2, 4, and 8 kHz, presented separately to the ipsilateral and contralateral ear. Stimuli were 100 ms in duration with 1 ms onset/offset cosine ramps. Interstimulus intervals averaged 30 ms with a 10 ms standard deviation. Each measurement was averaged over 100 repetitions. Levels ranged from 10 to 70 dB SPL in 5 dB steps.
Auditory brainstem responses were measured using chirps. Chirps are known to elicit larger responses than clicks because they provide near-synchronous stimulation of the entire cochlea. The responses elicited by clicks are dominated by the earlier responses of the high-frequency regions (Riedel and Kollmeier 2002b). We created a chirp for the barn owl using the procedure described in Fobel and Dau (2004) and the group delay data for the barn owl auditory nerve from Köppl (1997a). The values corresponding to variables a and c in Fobel and Dau’s equation were −0.706 and 0.205, respectively, in our chirp. Pure tones of 1 and 4 kHz were also used for ITD tests and the associated threshold measurements. Tones were 20 ms in duration with 1 ms onset/offset cosine ramps. For the chirps, the recording interval started 4 ms before stimulus onset and had a total duration of 15 ms. In the case of tone stimuli, the recording interval started 4 ms before stimulus onset and had a total duration of 35 ms. Interstimulus intervals averaged 30 ms with a 10 ms standard deviation.
Recordings for each stimulus type consisted of two tests. First, a threshold test was performed that recorded left monaural, right monaural, and binaural responses from 10 to 60 dB SPL in 5 dB steps. Combinations of different conditions were presented in random order and repeated at least 300 times. The threshold was determined visually using the binaural responses. Monaural thresholds merely served as sanity checks and were not used any further. After the threshold test, the stimuli were presented at different ITDs, at a level 10 dB above the binaural threshold. Tested ITDs were 0 and ±62.5, 125, 182.5, 500, and 1000 μs. An ITD of 375 μs was also tested, but only for the right-leading ITD as a result of an experimental error. To obtain symmetrical effects from stimulation of the left and right ears on the ABR (see Ungan et al. 1997), stimuli were shifted by half of the total ITD in opposite directions in each ear. Combinations of different conditions were presented in random order and repeated at least 500 times.
Data Analysis
For both CAP and CM, the raw recordings for each condition were averaged according to the procedure proposed by Riedel et al. (2001) and Granzow et al. (2001). Details on the signal processing are presented in Beutelmann et al. (2015).
The amplitude of the CAP in the averaged trace was defined as the difference between the first negative deflection (N1) and the following most prominent positive peak. The amplitude of the CM was estimated subsequent to converting the time-domain grand average to the frequency domain by measuring the peak at the corresponding stimulus frequency. The crosstalk was estimated by comparing the ipsi- and contralaterally-evoked CM responses at each specific frequency and level.
ABR traces were analyzed with a custom-written Matlab script (ABRanalyser by Rainer Beutelmann) that automatically detected local maxima and minima in the displayed traces. For each ITD and presentation level, peaks were selected by taking the amplitude relative to the baseline and latencies were estimated based on the leading stimulus onset. From these data, the variation in latency with ITD was calculated by subtracting the latency at 0 μs ITD from the latency at each of the tested ITDs. The normalized amplitude was calculated by dividing the amplitude at each specific ITD by the amplitude at 0 μs ITD. The BIC was derived by subtracting the sum of the two monaural ABRs from the binaural response. When the tested ITD was different from 0 μs, the monaural ABR traces were shifted in time before summation to compensate for the delay introduced (see previous section). The BIC components were detected and measured with the same methods as the ABR.
Results
CAP and CM Recordings
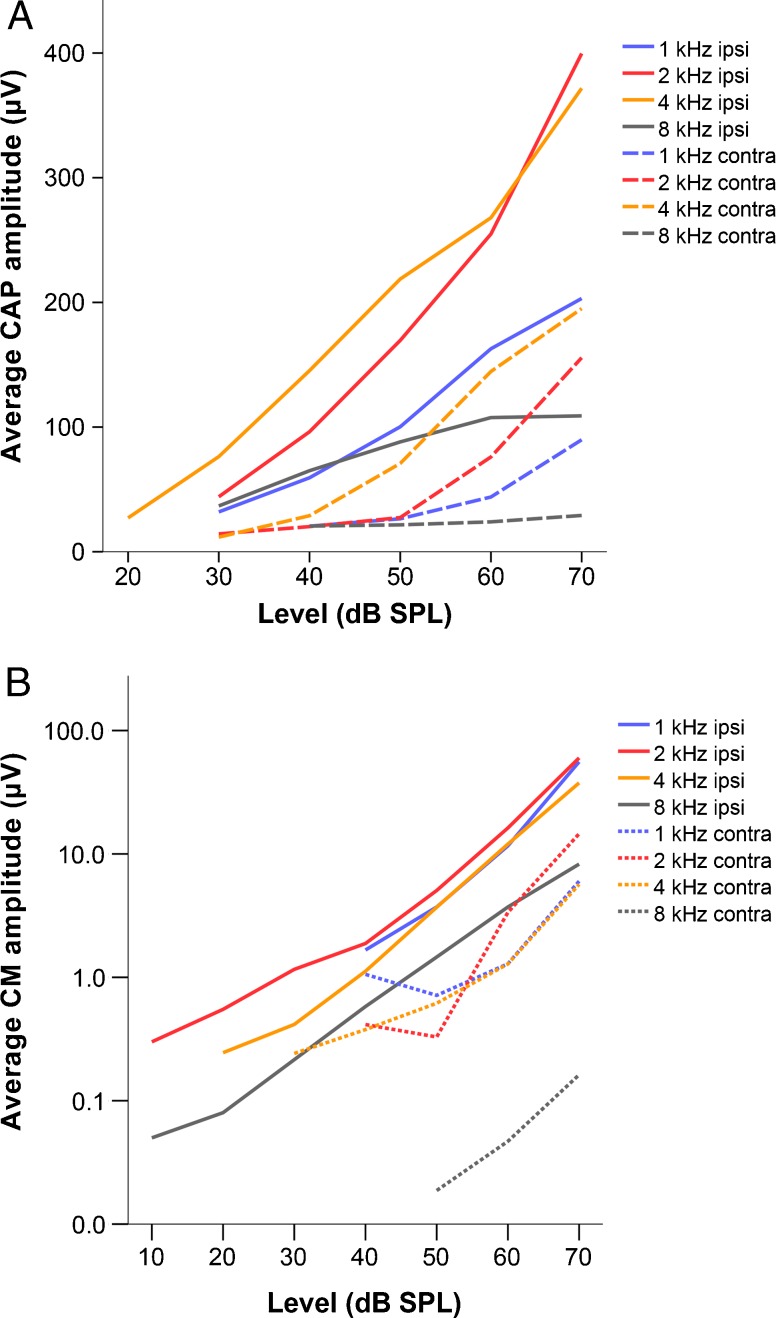
We recorded CAP and CM responses at 1, 2, 4, and 8 kHz and at levels ranging from 10 to 70 dB SPL. Both CAP and CM amplitude increased with increasing sound level (Fig. 1A and B). Peak CAP amplitudes were higher in response to 2 and 4 kHz than at 1 and 8 kHz, while the CM peak amplitude was similar at all frequencies except for 8 kHz.
FIG. 1.
Average amplitude (n = 2) in μV of the CAP (panel A, linear scale) and the CM (panel B, logarithmic scale) at different stimulus levels expressed in dB SPL. Each line on the graphs represents a different stimulus frequency. Solid and dashed lines represent responses to ipsi- and contralateral stimulation, respectively.
Crosstalk Analysis
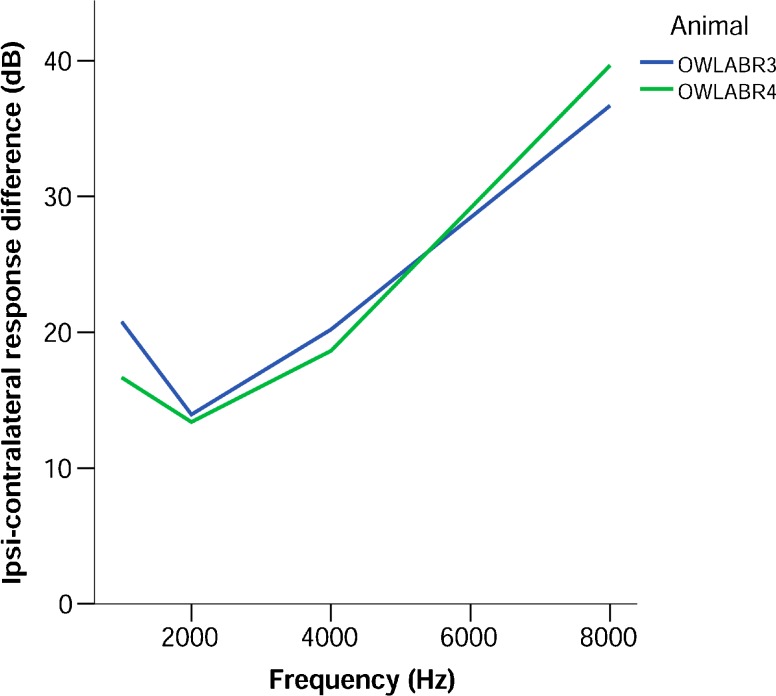
There was a consistent CM and a CAP in response to contralateral stimulation. Figure 2 shows the difference between contra- and ipsilaterally evoked cochlear microphonic at 60 dB SPL. This level was chosen because it was well above threshold and within the linear range for both ipsi- and contralateral stimulation. At 1, 2, and 4 kHz, contralateral responses had between 10 and 20 dB lower amplitudes than ipsilateral responses. At 8 kHz, this crosstalk was reduced, with differences of almost 40 dB between ipsi- and contralaterally evoked responses. In order to minimize acoustic crosstalk, we used sound levels of no more than 10 dB above threshold for recordings that were used to derive a BIC.
FIG. 2.
Difference between the ipsi- and contralateral response amplitudes of the cochlear microphonic (expressed in dB) at different stimulation frequencies, for the two experimental animals used for round window recordings. The presentation level was 60 dB SPL.
ABR Characterization in Response to Chirps
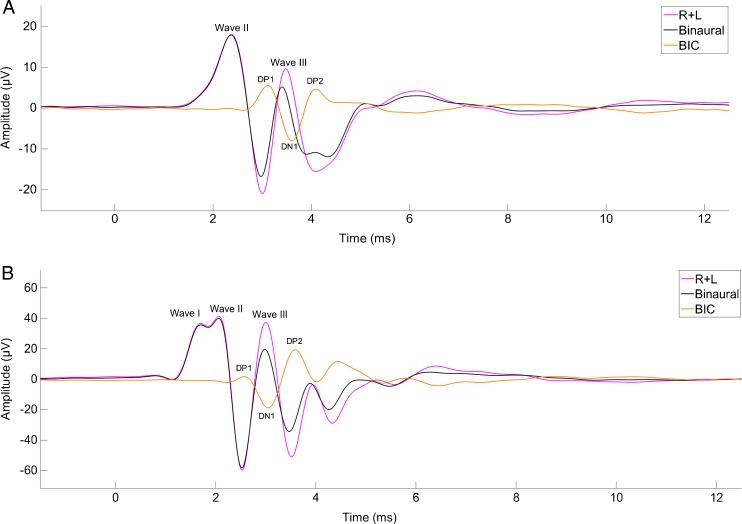
At 10 dB above threshold, the ABR showed two prominent peaks within the first 5 ms after stimulation, with a large negative deflection between the peaks (Fig. 3A). The delay to the first of these peaks ranged from 0.92 to 2.81 ms with an average latency of 1.96 ms for the range of levels tested. The delay to the second peak ranged from 1.35 to 4.04 ms, with an average latency of 2.82 ms. The average amplitude at 10 dB above threshold ranged from 6.91 to 26.19 μV, with an average of 19.54 μV, for the first peak and from −1.43 to 11.60 μV, with an average of 6.21 μV, for the second peak.
FIG. 3.
Panel A shows an example of a typical barn owl ABR trace in response to a chirp stimulus 10 dB above threshold. ABR amplitude (in μV) is shown as a function of time (in ms) after stimulus onset. The different lines represent the sum of the monaural responses, the binaural response, and the binaural interaction component (BIC), as explained in the legend. Panel B shows an example of a trace in response to chirp stimulation 50 dB above threshold.
A third peak (Fig. 3B) appeared before the other two in some recordings, but on most occasions, it appeared at levels that exceeded the crosstalk threshold (Table 1). We designated this lowest-latency peak appearing at higher levels as wave I, and the subsequent ones as waves II and III. The latter two were the waves characterized, because wave I did not appear consistently at the levels used for testing. We did not observe any other consistent peaks beyond these three.
TABLE 1.
Threshold (in dB SPL) for binaural chirp stimuli of the individual animals used for ABR recordings, and the stimulus level at which wave I first appeared
| Animal | Threshold (dB SPL) | Appearance of wave I (dB SPL) |
|---|---|---|
| 5 | 10 | 10 |
| 6 | 5 | 45 |
| 7 | 10 | 15 |
| 8 | 10 | 55 |
| 9 | 5 | 35 |
| 10 | 10 | 40 |
| 11 | 15 | 55 |
| 12 | 10 | 55 |
| 13 | 5 | 30 |
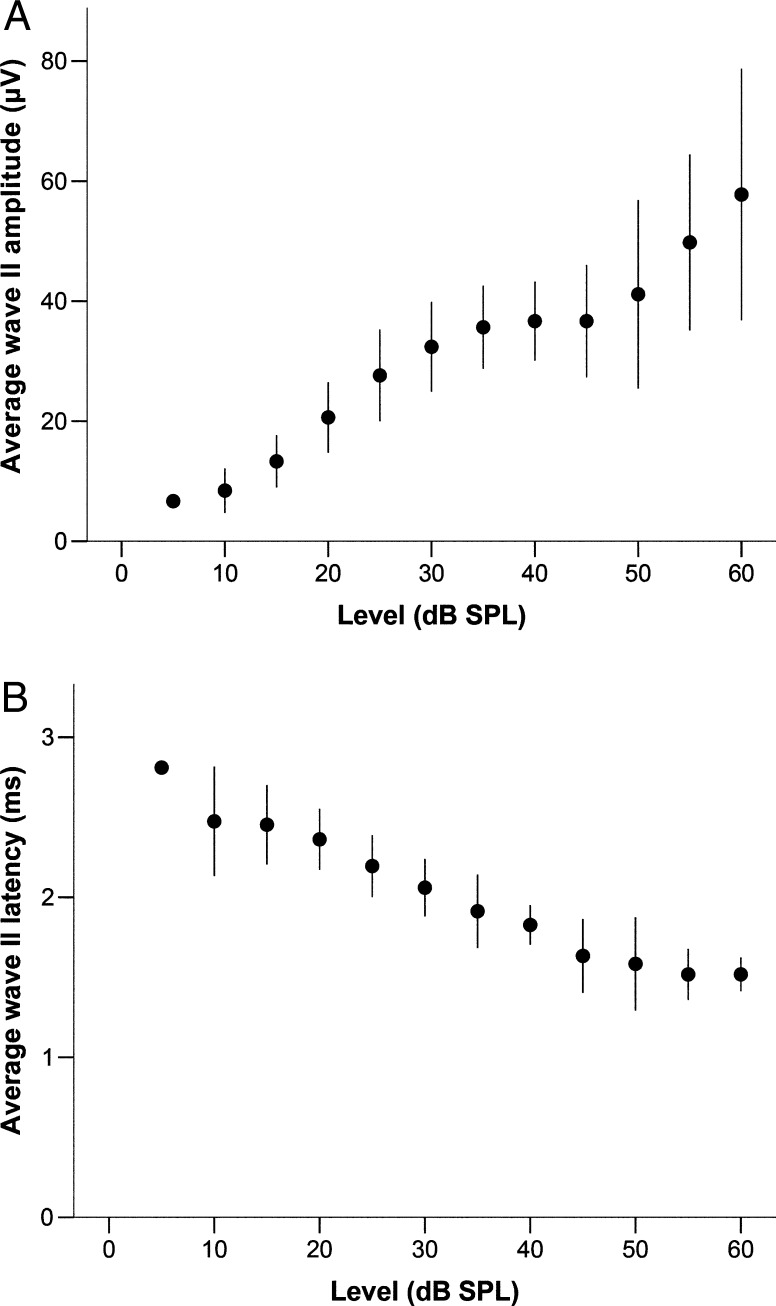
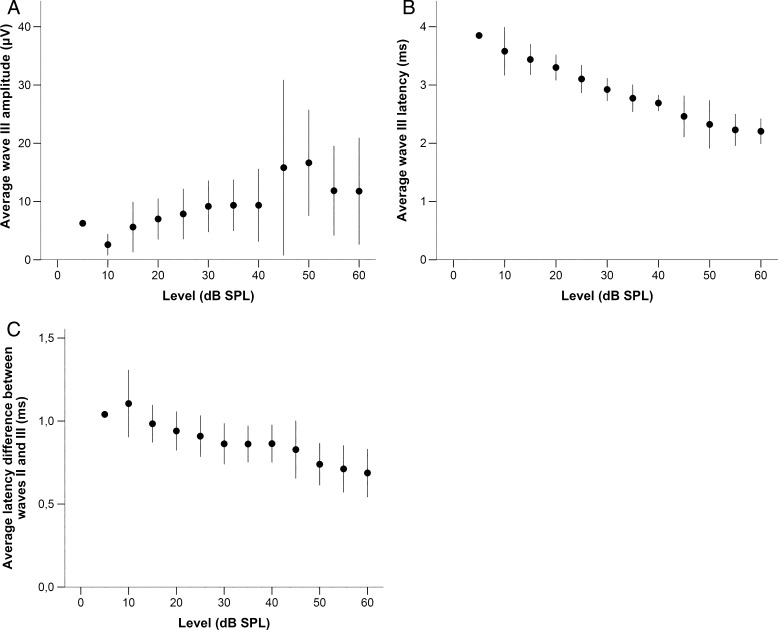
Waves II and III increased in amplitude with sound level, although the correlation for wave III was weaker (Figs. 4A and 5A; Spearman’s ρ (90) = 0.786 and 0.463, respectively; p < 0.001 for both). Their latencies decreased with increasing stimulus level (Figs. 4B and 5B, Spearman’s ρ (90) = −0.888 and −0.905, respectively; p < 0.001 for both). In addition, the relative latency between wave II and wave III decreased with increasing stimulus level (Fig. 5C, Spearman’s Rho = −0.619, p < 0.001).
FIG. 4.
Panel A shows the average amplitude of wave II in response to chirps, expressed in μV, as a function of stimulus level in dB SPL (n = 1 for 5 dB SPL; n = 9 for all other levels). Panel B shows the average latency for the same data. Error bars represent a range of ±one standard deviation.
FIG. 5.
Panel A shows the average amplitude of wave III in response to chirps, expressed in μV, as a function of stimulus level in dB SPL (n = 1 for 5 dB SPL; n = 9 for all other levels). Panel B shows the average latency for the same data. Panel C shows the average difference in latency (n = 9) between wave II and III (in ms), as a function of stimulus level in dB SPL. Error bars represent a range of ±one standard deviation.
BIC Characterization in Response to Chirps
The main component of the BIC was a negative deflection that coincided in time with wave III when tested at 0 μs ITD (Fig. 3). This negative deflection was sometimes accompanied by two small positive deflections on either side, although they did not consistently appear. We used the terminology established by Dobie and Berlin (1979) to name the different waves. The positive deflections were termed DP1 and DP2, and the negative deflection was termed DN1 (see Fig. 3).
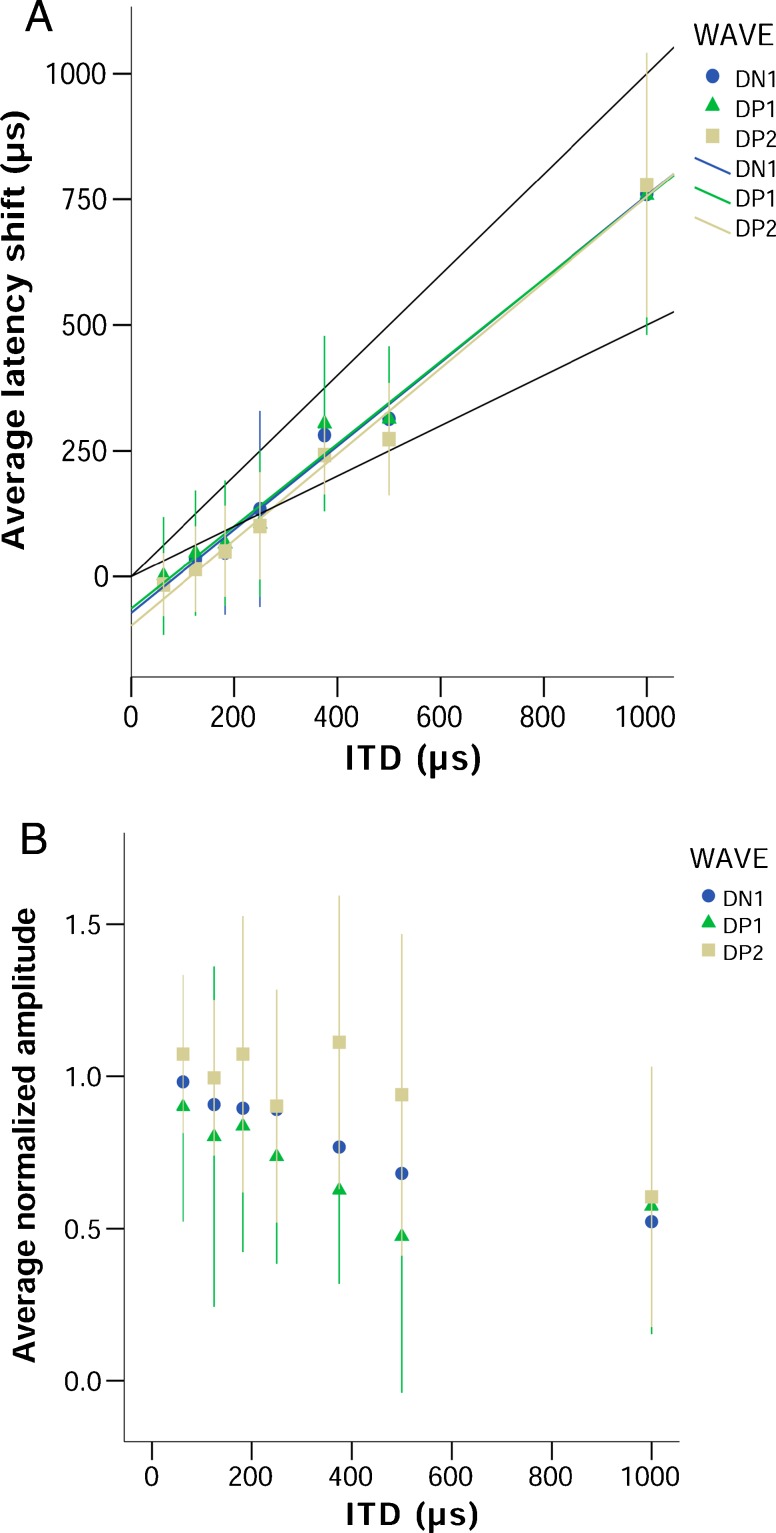
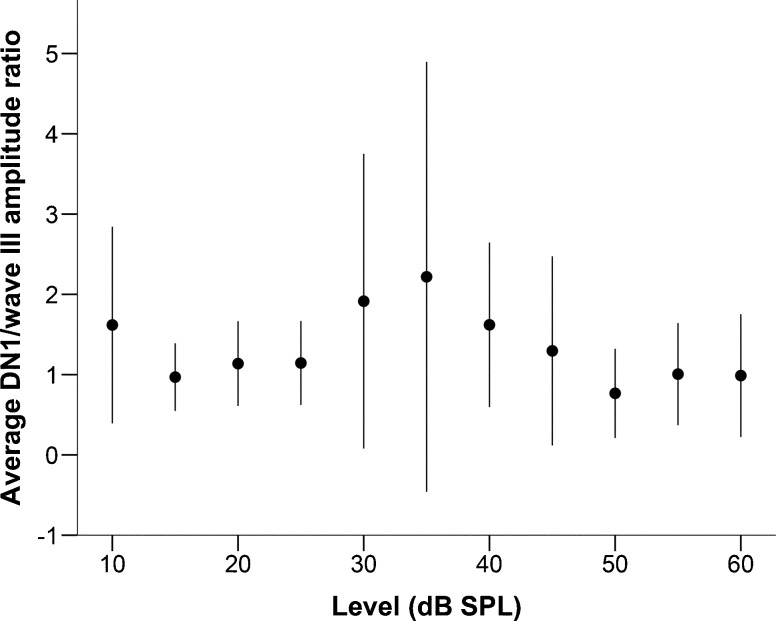
Latencies for DP1, DP2, and DN1 increased with increasing ITD in a linear manner (Fig. 6A, DN1 R 2 (113) = 0.991, DP1 R 2 (112) = 0.984, DP2 R 2 (114) = 0.989; p < 0.001 for all). Normalized amplitude for all three components of the BIC tended to decrease with increasing ITD, down to 50 to 60 % of the amplitude at 0 μs ITD for ITDs of 1000 μs. Amplitudes for DN1 consistently decreased with increasing ITD, while DP1 and DP2 showed high variability at the lower ITDs before decreasing at the higher ITDs (Fig. 6B). The ratio of the DN1 and wave III amplitudes was independent of stimulus level (Fig. 7).
FIG. 6.
Behavior of the BIC in response to chirps at 10 dB above threshold. Panel A shows the average (n = 17) latency shift of the different peaks of the BIC (in μs, relative to the latency of the equivalent peak at 0 μs ITD), as a function of stimulus ITD (in μs). The upper black line represents ΔT = ITD, the lower black line represents ΔT = ITD/2. Panel B shows the average normalized amplitude of the BIC (as a fraction of the amplitude at 0 μs ITD), as a function of ITD (in μs). Error bars represent a range of ±one standard deviation.
FIG. 7.
Average ratio (n = 9) of the amplitudes of DN1 of the BIC and ABR wave III, as a function of the chirp level in dB SPL. Error bars represent a range of ±one standard deviation.
BIC in Response to Tones
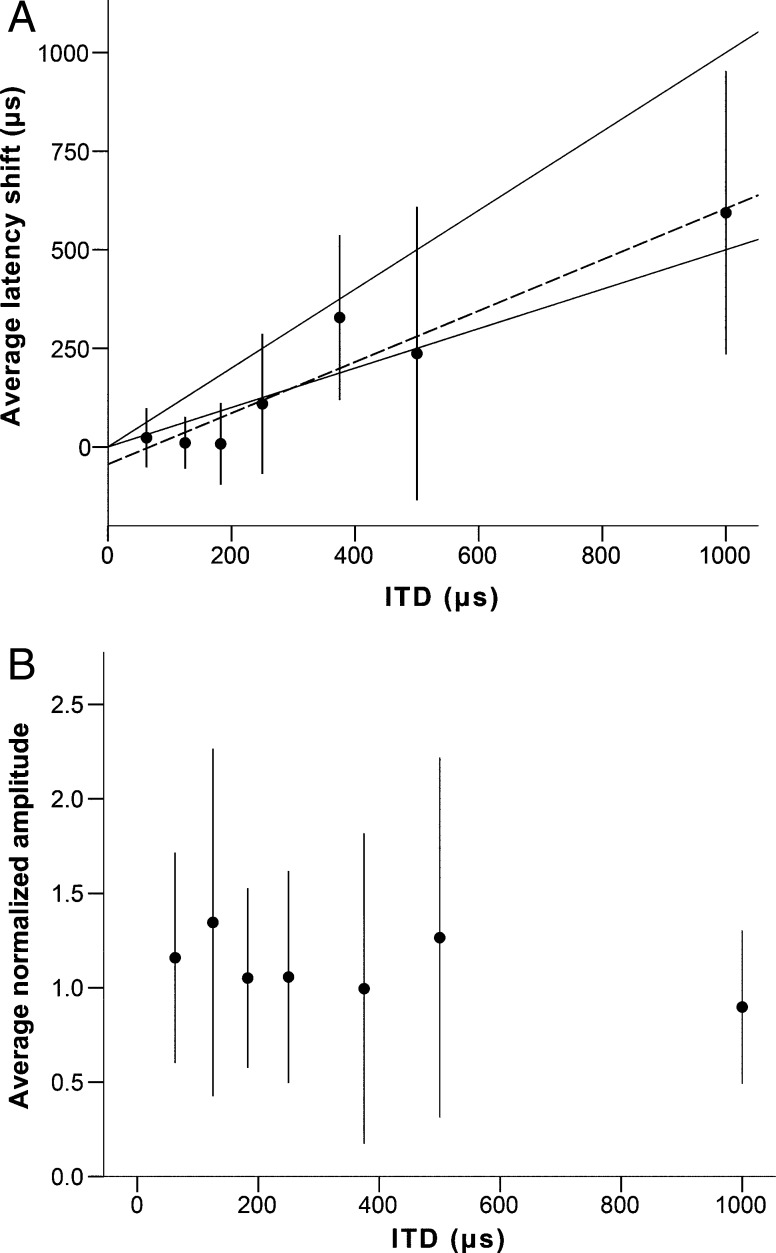
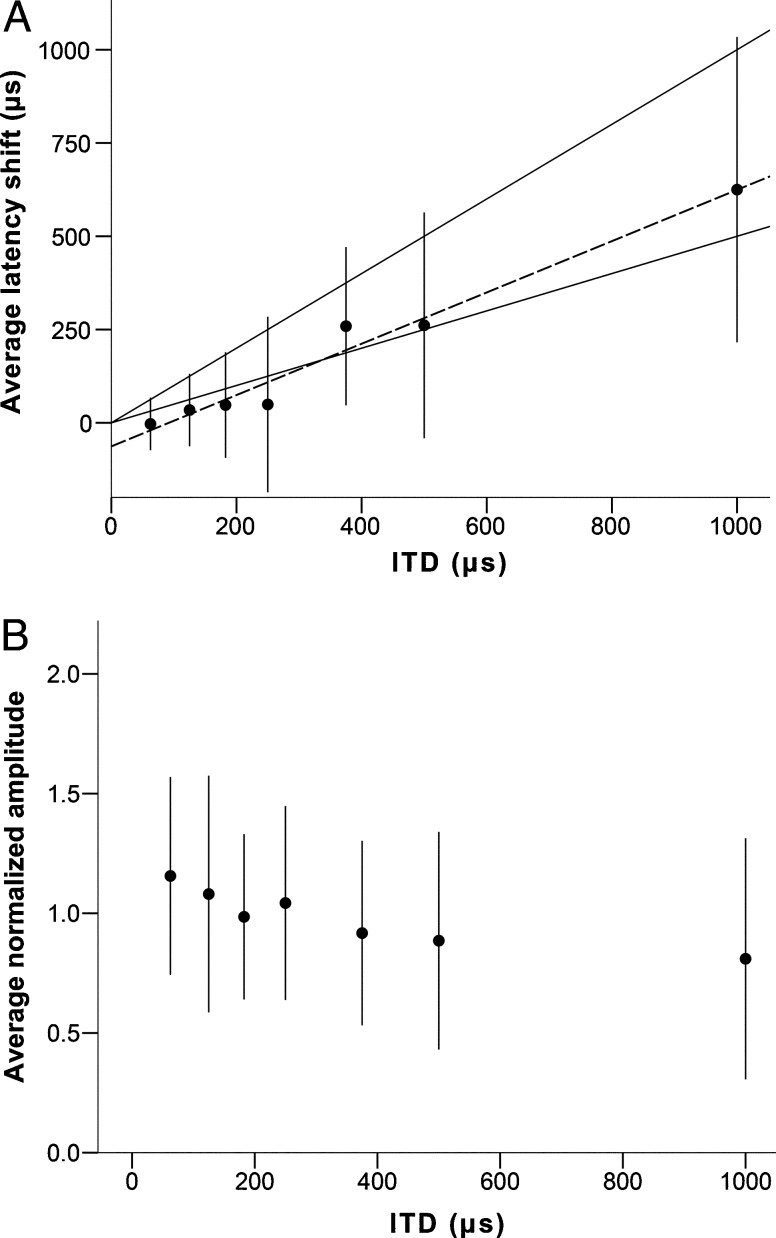
In addition to the chirp recordings, the results of recordings with 4 kHz pure tones (seven animals) and 1 kHz pure tones (three animals) are reported. The ABR waveform evoked by tones was similar to that evoked by chirps, but was smaller in amplitude. Average amplitudes for wave II at 10 dB above threshold were 4.02 μV for 1 kHz tones and 4.05 μV for 4 kHz tones. For wave III, average amplitudes at 10 dB above threshold were 0.5 μV for 1 kHz tones and 3.87 μV for 4 kHz tones. Latency increased linearly with ITD (1 kHz R 2 (36) = 0.914, 4 kHz R 2 (85) = 0.971; p < 0.001 for both), as with chirps (Figs. 8A and 9A). The normalized amplitude of the DN1 BIC wave evoked by 1 kHz was very variable and showed no consistent change with ITD (Fig. 8B). The normalized amplitude of the DN1 BIC wave evoked by 4 kHz tones was larger than the amplitude at 0 μs ITD for ITDs up to ±250 μs (Fig. 9B). Amplitude decreased slowly down to 80 % of the amplitude at 0 μs ITD for ITDs of ±1000 μs. The DP1 and DP2 peaks showed a very large variability in response to tones, and in many cases, they could not be reliably separated from the noise. For this reason, results for these two peaks are not shown for tones.
FIG. 8.
Behavior of the BIC in response to 1 kHz tones at 10 dB above threshold. Panel A shows the average (n = 7) latency shift of the DN1 peak of the BIC, relative to the same peak at 0 μs ITD (in μs), as a function of stimulus ITD (in μs). The upper solid black line represents ΔT = ITD, the lower solid black line represents ΔT = ITD/2. Panel B shows the average normalized amplitude of the BIC (as a fraction of the amplitude at 0 μs ITD), as a function of ITD (in μs). Error bars represent a range of ±one standard deviation.
FIG. 9.
Behavior of the BIC in response to 4 kHz tones at 10 dB above threshold. Panel A shows the average (n = 13) latency shift of the DN1 peak of the BIC, relative to the same peak at 0 μs ITD (in μs), as a function of stimulus ITD (in μs). The upper solid black line represents ΔT = ITD, the lower solid black line represents ΔT = ITD/2. Panel B shows the average normalized amplitude of the BIC (as a fraction of the amplitude at 0 μs ITD), as a function of ITD (in μs). Error bars represent a range of ±one standard deviation.
Discussion
The Specifics of CAP and ABR Recordings in Birds, Allocation of Waves
The results of the round window recordings (CAP and CM, Fig. 1) were consistent with previous measurements in the adult barn owl (Köppl and Gleich 2007). Our values for interaural canal attenuation (15–20 dB at lower frequencies, Fig. 2) are slightly higher but comparable to the values that Calford and Piddington (1988) estimated for the closely related grass owl (Tyto longimembris; 13 dB). The ABR of the barn owl was similar to those recorded in other bird species (Brittan-Powell et al. 2002, 2005), with two prominent positive waves appearing in the first 10 ms after stimulus onset. In response to higher-level chirps, the first wave appeared to separate into two waves. The latency of wave III (3 to 4 ms) was consistent with response latencies recorded from NL single units (Carr and Konishi 1990; Köppl 1997b). Thus, the waves corresponding to responses of the auditory nerve and cochlear nucleus should occur before it. Previous studies report slightly different latencies for auditory nerve and the cochlear nucleus magnocellularis (Köppl 1997b): 1–1.5 ms and 1.5–2.5 ms, respectively. These measurements were obtained with high-level clicks and the latencies are similar to the latencies seen in our chirp responses at high levels (Figs. 4 and 5) for waves I and II. A possible explanation for the absence of wave I at lower levels is that latencies for auditory nerve and cochlear nucleus are initially similar but auditory-nerve latency advances faster with increasing level, which will result in two distinct peaks appearing at higher levels. Wave III amplitude showed a weak correlation with stimulus level when compared with wave II, while the correlation between latency and stimulus level was similarly strong for both waves. NL was shown to have a mechanism for gain control (Peña et al. 1996) that prevents saturation of cellular responses and preserves sensitivity to ITD at high stimulus levels. The insensitivity of wave III’s amplitude to sound level could be a consequence of that, reinforcing the association between wave III and NL.
BIC in Response to Chirps
The BIC in the barn owl consisted of three closely associated peaks, a positive peak (DP1) followed by a negative peak (DN1) and another positive peak (DP2). In contrast to DN1, DP1 and DP2 showed a larger variance and did not appear consistently throughout the recordings. This is similar to cats, where a less prominent positive component was observed after DN1 (Ungan et al. 1997). Although we show the data for all three peaks, we consider DN1 the most representative. Preliminary studies had also reported a negative BIC for the barn owl (Calvo and Moiseff 1992, 1993). DN1 was associated with ABR wave III and was sensitive to changes in ITD which reinforces the above conclusion that wave III reflects activity in NL. NL is the first binaural center where ITDs are processed (Carr and Konishi 1990). Our data thus imply that an EE-based system is compatible with a negative BIC. Although this has indeed been suggested before (Gaumond and Psaltikidou 1991), the present data do not fulfill salient predictions of that model. Specifically, the amplitude ratio of the BIC and its corresponding ABR wave was predicted to decrease monotonically with increasing stimulus level. In contrast to this, the BIC to wave III ratio in the current study was independent of stimulus level (Fig. 7).
The latency of the DN1 component of the BIC increased linearly with ITD. For a given ITD, the change in latency fell between the value expected for EE systems receiving delay-line inputs from both sides, as in the classic Jeffress model (ΔT = ITD/2, Ungan et al. 1997), and the value expected for EE systems receiving neural delays from only one side (ΔT = ITD, Ungan et al. 1997), such as observed in the chicken (Young and Rubel 1983; Overholt et al. 1992). This is consistent with the specifics of the barn owl ITD computing system. The owl’s NL is a known case of hyperplasia (Kubke et al. 2004). Axons arriving from nucleus magnocellularis to the border of NL show a similar morphology to that of other archosaurs, with delay lines from contralateral only. However, once inside NL, these primary axons interdigitate in a countercurrent pattern, creating many redundant arrays with delay lines from both sides (McColgan et al. 2014). Such a succession of single-sided and double delay lines would be expected to show an intermediate behavior. The amplitude of DN1 decreased monotonically with increasing ITD, which is consistent with data from mammalian studies.
BIC in Response to Tones
The BIC measured with 1 and 4 kHz tones behaved similarly to each other and to chirps in response to changes in ITD. This was unexpected. Low frequencies (below 3 kHz) are located in a small caudolateral region of the owl’s NL that is not as hypertrophied as the high-frequency parts. There is evidence for a topographic gradient of best ITD and an EE-type delay line system (Palanca-Castan and Köppl 2015). However, the low-frequency region appears to lack the specialized double-delay secondary stage of delay lines described in the previous section (Carr and Köppl 2004). The BIC recordings were clearly not sensitive enough to reveal any significant difference that might be correlated with these known differences across the tonotopic gradient in NL.
Evidence for the Origin of the BIC
The main binaural cues for sound localization—ITD and ILD—are thought to be processed in the mammalian MSO and LSO, respectively, (review in Grothe et al. 2010). Since the BIC is affected by changing binaural cues (Riedel and Kollmeier 2002b; Ungan et al. 1997; Goksoy et al. 2005), it is assumed to be generated by the SOC itself (McPherson and Starr 1993) or by fibers running from the SOC to the lateral lemniscus (LL) (Jones and Van der Poel 1990). However, there is an ongoing argument about which of the two nuclei—MSO or LSO—is the main generator of the BIC. It appears relevant in this context to distinguish between BIC in response to varying ITD and ILD. So far, the effect of varying ITD has received more attention than similar effects of ILD. Here, we also specifically probed the behavior of the BIC in response to varying ITD and argue that the dominant source must be the NL (see Introduction). We now briefly summarize the main evidence for different neural origins of the BIC in mammals (for a more comprehensive review, see Laumen et al. 2016a) and re-evaluate it in the light of our findings in the barn owl. The evidence falls along three main lines of argument:
The predominantly negative polarity of the BIC has been interpreted as indicating an underlying EI system, which in turn suggests the LSO, and excludes the MSO, as the main generator of the BIC—even when only ITD is varied (Wada and Starr 1989; Ungan et al. 1997; Riedel and Kollmeier 2002a; Ungan and Yagcioglu 2002; Goksoy et al. 2005). This is plausible, as it is well known that at least low-frequency neurons in LSO are ITD-sensitive (Joris and Yin 1995; Tollin and Yin 2005). Furthermore, Ungan and Yagcioglu (2002) compared ABR and simultaneous measurements of auditory field potentials near the LL fiber tracts in the cat and concluded that the BIC was generated by EI cells. Their main argument was an asymmetry in the local field responses between ipsi- and contralaterally leading stimuli. Contrary to that, both the present ABR data from the barn owl and early measurements of local field potentials in cat MSO (Wernick and Starr 1968) found negative BIC in response to varying ITD. These findings strongly suggest that the simple assumption of an EI interaction as the basis of a negative BIC needs to be reconsidered. The fact that it remains presently unexplained how an EE interaction can produce a negative BIC rather highlights an inadequate understanding of its generation.
For most mammalian data, the increase in latency of the BIC with increasing ITD was not compatible with the predictions for a classical EE response, fed by delay-line inputs. Real BIC data typically fall somewhere in between the predicted patterns for either the classic double-delay-line Jeffress model (ΔT = ITD) or the modified single-delay line model (ΔT = ITD/2) (Laumen et al. 2016a). This has been cited as evidence against the MSO as the source (Ungan et al. 1997), an interpretation that must now be discarded as outdated since axonal delay lines arguably do not exist in the mammalian MSO (Karino et al. 2011). However, the owl BIC behaved very similarly. Although this was expected in the particular case of the owl (see above), we are thus faced with the overall finding that, regardless of species and known differences in the relevant binaural brainstem circuits, all BIC data so far showed the same latency changes with varying ITD. Again, this highlights an inadequate understanding of BIC generation and questions the suitability of the BIC as a tool to differentiate between potential types of neural circuitry that achieve sound lateralization.
Lesion studies might be expected to provide the most direct evidence for the sources contributing to the BIC. Lesions to the trapezoid body (TB) and the SOC affect the BIC severely and thus confirmed its principal source in the SOC (Wada and Starr 1983a, b, c, 1989; Zaaroor and Starr 1991; Pratt et al. 1998; Melcher 1996). However, there is no agreement as to the relative contributions of LSO vs. MSO. In a careful study, lesioning at several sites in the auditory brainstem of the cat, Melcher (1996) concluded that her data favored MSO as a generator and excluded the LSO. Contrary to that, Zaaroor and Starr (1991) argued that the BIC amplitude loss is directly correlated with the extent of lesions in the LSO.
The prediction of a positive BIC from an EE system assumes that the BIC is a direct reflection of single-unit firing. However, the generation of evoked potentials is clearly more complex. For example, Goldwyn et al. (2014) showed that the MSO local field potential, termed neurophonic, undergoes a spatial contraction when stimulation is by two coincident excitatory inputs, and that the spiking of nearby neurons that would fire maximally under these conditions probably make a negligible contribution to the field potential. The authors suggested that a similar effect could account for a negative BIC in the ABR. Furthermore, the generators of evoked potentials recorded with the same protocol need not be the same in different species. For example, the NL neurophonic in the barn owl is likely to be generated by the incoming nucleus magnocellularis axons and their synaptic potentials (Kuokkanen et al. 2010, 2013) while in the chicken, the most probable generator are postsynaptic currents within NL cells, as in cat MSO (Köppl and Carr 2008; Goldwyn et al. 2014). This is an indication that a given neural structure like NL or MSO is plastic and can vary between animals with different ecological niches and sound localization requirements. The natural variation of MSO structure and function within mammals (Grothe 2000) implies possible variation in the sources of evoked potentials as well.
Although it is likely that ITD processing mechanisms are fundamentally different in birds and mammals (Grothe et al. 2010; Grothe and Pecka 2014), the generation of the BIC is not sufficiently understood to distinguish different mechanisms, either between species or across the tonotopic gradient. A better insight into how single-unit and circuit-level activity translates into the characteristics of far-field potentials such as the ABR is required before the BIC can be used as a tool to reach accurate conclusions about binaural processing in the brainstem.
Acknowledgments
Supported by the Deutsche Forschungsgemeinschaft (CRC/TRR31 “Active Hearing” and Cluster of Excellence “Hearing4All”). We thank Rainer Beutelmann for his technical assistance. Georg Klump provided invaluable input early in the project.
Compliance with Ethical Standards
Conflict of Interest
The authors declare that they have no conflict of interest.
Contributor Information
Nicolas Palanca-Castan, Phone: +39 0441 798 3785, Email: nicolas.palanca@uni-oldenburg.de.
Geneviève Laumen, Email: genevieve.laumen@uni-oldenburg.de.
Darrin Reed, Email: dkreed@bu.edu.
Christine Köppl, Email: christine.koeppl@uni-oldenburg.de.
References
- Beutelmann R, Laumen G, Tollin D, Klump GM. Amplitude and phase equalization of stimuli for click evoked auditory brainstem responses. J Acoust Soc Am. 2015;137:EL71–EL77. doi: 10.1121/1.4903921. [DOI] [PMC free article] [PubMed] [Google Scholar]
- Brand A, Behrend O, Marquardt T, et al. Precise inhibition is essential for microsecond interaural time difference coding. Nature. 2002;417:543–547. doi: 10.1038/417543a. [DOI] [PubMed] [Google Scholar]
- Brittan-Powell EF, Dooling RJ, Gleich O. Auditory brainstem responses in adult budgerigars (Melopsittacus undulatus) J Acoust Soc Am. 2002;112:999. doi: 10.1121/1.1494807. [DOI] [PubMed] [Google Scholar]
- Brittan-Powell EF, Lohr B, Hahn DC, Dooling RJ. Auditory brainstem responses in the eastern screech owl: an estimate of auditory thresholds. J Acoust Soc Am. 2005;118:314. doi: 10.1121/1.1928767. [DOI] [PubMed] [Google Scholar]
- Calford MB, Piddington RW. Avian interaural canal enhances interaural delay. J Comp Physiol A. 1988;162:503–510. doi: 10.1007/BF00612515. [DOI] [Google Scholar]
- Calvo C, Moiseff A. Neural correlates of interaural time processing in the auditory evoked potentials of the barn owl. Soc Neurosci Abstr. 1992;18:149. [Google Scholar]
- Calvo C, Moiseff A. Monitoring of the binaural interaction in the immature barn owl. Soc Neurosci Abstr. 1993;19:531. [Google Scholar]
- Carr CE, Konishi M. A circuit for detection of interaural time differences in the brain stem of the barn owl. J Neurosci. 1990;10:3227–3246. doi: 10.1523/JNEUROSCI.10-10-03227.1990. [DOI] [PMC free article] [PubMed] [Google Scholar]
- Carr CE, Köppl C. Coding interaural time differences at low best frequencies in the barn owl. J Physiol. 2004;98:99–112. doi: 10.1016/j.jphysparis.2004.03.003. [DOI] [PubMed] [Google Scholar]
- Dobie RA, Berlin CI. Binaural interaction in brainstem-evoked responses. Arch Otolaryngol - Head Neck Surg. 1979;105:391–398. doi: 10.1001/archotol.1979.00790190017004. [DOI] [PubMed] [Google Scholar]
- Fobel O, Dau T. Searching for the optimal stimulus eliciting auditory brainstem responses in humans. J Acoust Soc Am. 2004;116:2213–2222. doi: 10.1121/1.1787523. [DOI] [PubMed] [Google Scholar]
- Furst M, Eyal S, Korczyn AD. Prediction of binaural click lateralization by brainstem auditory evoked potentials. Hear Res. 1990;49:347–359. doi: 10.1016/0378-5955(90)90113-4. [DOI] [PubMed] [Google Scholar]
- Gaumond RP, Psaltikidou M. Models for the generation of the binaural difference response. J Acoust Soc Am. 1991;89:454–456. doi: 10.1121/1.400482. [DOI] [PubMed] [Google Scholar]
- Goksoy C, Demirtas S, Yagcioglu S, Ungan P. Interaural delay-dependent changes in the binaural interaction component of the Guinea pig brainstem responses. Brain Res. 2005;1054:183–191. doi: 10.1016/j.brainres.2005.06.083. [DOI] [PubMed] [Google Scholar]
- Goldberg JM, Brown PB. Functional organization of the dog superior olivary complex: an anatomical and electrophysiological study. J Neurophysiol. 1968;31:639–656. doi: 10.1152/jn.1968.31.4.639. [DOI] [PubMed] [Google Scholar]
- Goldberg JM, Brown PB. Response of binaural neurons of dog superior olivary complex to dichotic tonal stimuli: some physiological mechanisms of sound localization. J Neurophysiol. 1969;32:613–636. doi: 10.1152/jn.1969.32.4.613. [DOI] [PubMed] [Google Scholar]
- Goldwyn JH, Mc Laughlin M, Verschooten E, et al. A model of the medial superior olive explains spatiotemporal features of local field potentials. J Neurosci. 2014;34:11705–11722. doi: 10.1523/JNEUROSCI.0175-14.2014. [DOI] [PMC free article] [PubMed] [Google Scholar]
- Granzow M, Riedel H, Kollmeier B. Single-sweep-bades methods to improve the quality of auditory brain stem responses part I: optimized linear filtering. Z Audiol. 2001;40:32–44. doi: 10.3109/00206090109073098. [DOI] [Google Scholar]
- Grothe B. The evolution of temporal processing in the medial superior olive, an auditory brainstem structure. Prog Neurobiol. 2000;61:581–610. doi: 10.1016/S0301-0082(99)00068-4. [DOI] [PubMed] [Google Scholar]
- Grothe B, Pecka M. The natural history of sound localization in mammals: a story of neuronal inhibition. Front Neural Circuits. 2014;8:1–19. doi: 10.3389/fncir.2014.00116. [DOI] [PMC free article] [PubMed] [Google Scholar]
- Grothe B, Pecka M, McAlpine D. Mechanisms of sound localization in mammals. Physiol Rev. 2010;90:983–1012. doi: 10.1152/physrev.00026.2009. [DOI] [PubMed] [Google Scholar]
- Huang CM, Buchwald JS. Factors that affect the amplitudes and latencies of the vertex short latency acoustic responses in the cat. Electroencephalogr Clin Neurophysiol. 1978;44:179–186. doi: 10.1016/0013-4694(78)90264-X. [DOI] [PubMed] [Google Scholar]
- Jeffress LA. A place theory of sound localization. J Comp Physiol Psychol. 1948;41:35–39. doi: 10.1037/h0061495. [DOI] [PubMed] [Google Scholar]
- Jones SJ, Van der Poel JC. Binaural interaction in the brain-stem auditory evoked potential: evidence for a delay line coincidence detection mechanism. Electroencephalogr Clin Neurophysiol Potentials Sect. 1990;77:214–224. doi: 10.1016/0168-5597(90)90040-K. [DOI] [PubMed] [Google Scholar]
- Joris PX, Yin TC. Envelope coding in the lateral superior olive. I Sensitivity to interaural time differences J Neurophysiol. 1995;73:1043–1062. doi: 10.1152/jn.1995.73.3.1043. [DOI] [PubMed] [Google Scholar]
- Karino S, Smith PH, Yin TC, et al. Axonal branching patterns as sources of delay in the mammalian auditory brainstem: a re-examination. J Neurosci. 2011;31:3016–3031. doi: 10.1523/JNEUROSCI.5175-10.2011. [DOI] [PMC free article] [PubMed] [Google Scholar]
- Konishi M. Coding of auditory space. Annu Rev Neurosci. 2003;26:31–55. doi: 10.1146/annurev.neuro.26.041002.131123. [DOI] [PubMed] [Google Scholar]
- Köppl C. Phase locking to high frequencies in the auditory nerve and cochlear nucleus magnocellularis of the barn owl, Tyto alba. J Neurosci. 1997;17:3312–3321. doi: 10.1523/JNEUROSCI.17-09-03312.1997. [DOI] [PMC free article] [PubMed] [Google Scholar]
- Köppl C. Frequency tuning and spontaneous activity in the auditory nerve and cochlear nucleus magnocellularis of the barn owl Tyto alba. J Neurophysiol. 1997;77:364–377. doi: 10.1152/jn.1997.77.1.364. [DOI] [PubMed] [Google Scholar]
- Köppl C, Carr CE. Maps of interaural time difference in the chicken’s brainstem nucleus laminaris. Biol Cybern. 2008;98:541–559. doi: 10.1007/s00422-008-0220-6. [DOI] [PMC free article] [PubMed] [Google Scholar]
- Köppl C, Gleich O. Evoked cochlear potentials in the barn owl. J Comp Physiol A Neuroethol Sensory, Neural, Behav Physiol. 2007;193:601–612. doi: 10.1007/s00359-007-0215-0. [DOI] [PubMed] [Google Scholar]
- Kubke MF, Massoglia DP, Carr CE. Bigger brains or bigger nuclei? Regulating the size of auditory structures in birds. Brain Behav Evol. 2004;63:169–180. doi: 10.1159/000076242. [DOI] [PMC free article] [PubMed] [Google Scholar]
- Kuokkanen PT, Wagner H, Ashida G, et al. On the origin of the extracellular field potential in the nucleus laminaris of the barn owl (Tyto alba) J Neurophysiol. 2010;104:2274–2290. doi: 10.1152/jn.00395.2010. [DOI] [PMC free article] [PubMed] [Google Scholar]
- Kuokkanen PT, Ashida G, Carr CE, et al. Linear summation in the barn owl’s brainstem underlies responses to interaural time differences. J Neurophysiol. 2013;110:117–130. doi: 10.1152/jn.00410.2012. [DOI] [PMC free article] [PubMed] [Google Scholar]
- Larsen O, Dooling R, Ryals BM. Roles of intracranial air pressure in bird audition. In: Lewis ER, Long GR, Lyon RF, Narins PM, Steele CR, Hecht-Poinar E, editors. Diversity in auditory mechanics. Singapore: World Scientific; 1997. pp. 11–17. [Google Scholar]
- Laumen G, Ferber AT, Klump GM, Tollin DJ. The physiological basis and clinical use of the binaural interaction component of the auditory brainstem response. Ear Hear doi. 2016 doi: 10.1097/AUD.0000000000000301. [DOI] [PMC free article] [PubMed] [Google Scholar]
- Laumen G, Tollin DJ, Beutelmann R, Klump GM. Aging effects on the binaural interaction component of the auditory brainstem response in the Mongolian gerbil: effects of interaural time and level differences. Hear Res. 2016;337:46–58. doi: 10.1016/j.heares.2016.04.009. [DOI] [PMC free article] [PubMed] [Google Scholar]
- Manley GA, Köppl C, Konishi M. A neural map of interaural intensity differences in the brain stem of the barn owl. J Neurosci. 1988;8:2665–2676. doi: 10.1523/JNEUROSCI.08-08-02665.1988. [DOI] [PMC free article] [PubMed] [Google Scholar]
- McColgan T, Shah S, Koppl C, et al. A functional circuit model of interaural time difference processing. J Neurophysiol. 2014;112:2850–2864. doi: 10.1152/jn.00484.2014. [DOI] [PMC free article] [PubMed] [Google Scholar]
- McPherson DL, Starr A. Binaural interaction in auditory evoked potentials: brainstem, middle- and long-latency components. Hear Res. 1993;66:91–98. doi: 10.1016/0378-5955(93)90263-Z. [DOI] [PubMed] [Google Scholar]
- Melcher JR. Cellular generators of the binaural difference potential in cat. Hear Res. 1996;95:144–160. doi: 10.1016/0378-5955(96)00032-9. [DOI] [PubMed] [Google Scholar]
- Moiseff A, Konishi M. Binaural characteristics of units in the owl’s brainstem auditory pathway: precursors of restricted spatial receptive fields. J Neurosci. 1983;3:2553–2562. doi: 10.1523/JNEUROSCI.03-12-02553.1983. [DOI] [PMC free article] [PubMed] [Google Scholar]
- Myoga MH, Lehnert S, Leibold C, Felmy F, Grothe B. Glycinergic inhibition tunes coincidence detection in the auditory brainstem. Nat Commun. 2014;5:3790. doi: 10.1038/ncomms4790. [DOI] [PMC free article] [PubMed] [Google Scholar]
- Ohmori H. Neuronal specializations for the processing of interaural difference cues in the chick. Front Neural Circuits. 2014;8:47. doi: 10.3389/fncir.2014.00047. [DOI] [PMC free article] [PubMed] [Google Scholar]
- Overholt EM, Rubel EW, Hyson RL. A circuit for coding interaural time differences in the chick brainstem. J Neurosci. 1992;12:1698–1708. doi: 10.1523/JNEUROSCI.12-05-01698.1992. [DOI] [PMC free article] [PubMed] [Google Scholar]
- Palanca-Castan N, Köppl C. In vivo recordings from low-frequency nucleus laminaris in the barn owl. Brain Behav Evol. 2015;85:271–286. doi: 10.1159/000433513. [DOI] [PubMed] [Google Scholar]
- Pecka M, Brand A, Behrend O, Grothe B. Interaural time difference processing in the mammalian medial superior olive: the role of glycinergic inhibition. J Neurosci. 2008;28:6914–6925. doi: 10.1523/JNEUROSCI.1660-08.2008. [DOI] [PMC free article] [PubMed] [Google Scholar]
- Peña JL, Viete S, Albeck Y, Konishi M. Tolerance to sound intensity of binaural coincidence detection in the nucleus laminaris of the owl. J Neurosci. 1996;16:7046–7054. doi: 10.1523/JNEUROSCI.16-21-07046.1996. [DOI] [PMC free article] [PubMed] [Google Scholar]
- Pratt H, Polyakov A, Aharonson V, et al. Effects of localized pontine lesions on auditory brain-stem evoked potentials and binaural processing in humans. Electroencephalogr Clin Neurophysiol. 1998;108:511–520. doi: 10.1016/S0168-5597(98)00029-X. [DOI] [PubMed] [Google Scholar]
- Riedel H, Kollmeier B. Auditory brain stem responses evoked by lateralized clicks: is lateralization extracted in the human brain stem? Hear Res. 2002;163:12–26. doi: 10.1016/S0378-5955(01)00362-8. [DOI] [PubMed] [Google Scholar]
- Riedel H, Kollmeier B. Comparison of binaural auditory brainstem responses and the binaural difference potential evoked by chirps and clicks. Hear Res. 2002;169:85–96. doi: 10.1016/S0378-5955(02)00342-8. [DOI] [PubMed] [Google Scholar]
- Riedel H, Granzow M, Kollmeier B. Single-sweep-based methods to improve the quality of auditory brain stem responses part II: averaging methods. Zeitschrift für Audiol. 2001;40:62–85. [Google Scholar]
- Roberts MT, Seeman SC, Golding NL. A mechanistic understanding of the role of feedforward inhibition in the mammalian sound localization circuitry. Neuron. 2013;78:923–935. doi: 10.1016/j.neuron.2013.04.022. [DOI] [PMC free article] [PubMed] [Google Scholar]
- Takahashi TT, Konishi M. Projections of nucleus angularis and nucleus laminaris to the lateral lemniscal nuclear complex of the barn owl. J Comp Neurol. 1988;274:212–238. doi: 10.1002/cne.902740207. [DOI] [PubMed] [Google Scholar]
- Tollin DJ. The lateral superior olive: a functional role in sound source localization. Neuroscientist. 2003;9:127–143. doi: 10.1177/1073858403252228. [DOI] [PubMed] [Google Scholar]
- Tollin DJ, Yin TCT. Interaural phase and level difference sensitivity in low-frequency neurons in the lateral superior olive. J Neurosci. 2005;25:10648–10657. doi: 10.1523/JNEUROSCI.1609-05.2005. [DOI] [PMC free article] [PubMed] [Google Scholar]
- Ungan P, Yagcioglu S. Origin of the binaural interaction component in wave P4 of the short-latency auditory evoked potentials in the cat: evaluation of serial depth recordings from the brainstem. Hear Res. 2002;167:81–101. doi: 10.1016/S0378-5955(02)00351-9. [DOI] [PubMed] [Google Scholar]
- Ungan P, Yagcioglu S, Özmen B. Interaural delay-dependent changes in the binaural difference potential in cat auditory brainstem response: implications about the origin of the binaural interaction component. Hear Res. 1997;106:66–82. doi: 10.1016/S0378-5955(97)00003-8. [DOI] [PubMed] [Google Scholar]
- van der Heijden M, Lorteije JAM, Plauška A, et al. Directional hearing by linear summation of binaural inputs at the medial superior olive. Neuron. 2013;78:936–948. doi: 10.1016/j.neuron.2013.04.028. [DOI] [PMC free article] [PubMed] [Google Scholar]
- Wada S, Starr A (1989) Anatomical bases of binaural interaction in auditory brainstem responses from guinea pig [DOI] [PubMed]
- Wada SI, Starr A. Generation of auditory brain stem responses (ABRs). I. Effects of injection of a local anesthetic (procaine HCI) into the trapezoid body of Guinea pigs and cat. Electroencephalogr Clin Neurophysiol. 1983;56:326–339. doi: 10.1016/0013-4694(83)90259-6. [DOI] [PubMed] [Google Scholar]
- Wada SI, Starr A. Generation of auditory brain stem responses (ABRs). III. Effects of lesions of the superior olive, lateral lemniscus and inferior colliculus on the ABR in Guinea pig. Electroencephalogr Clin Neurophysiol. 1983;56:352–366. doi: 10.1016/0013-4694(83)90261-4. [DOI] [PubMed] [Google Scholar]
- Wada SI, Starr A. Generation of auditory brain stem responses (ABRs). II. Effects of surgical section of the trapezoid body on the ABR in Guinea pigs and cat. Electroencephalogr Clin Neurophysiol. 1983;56:340–351. doi: 10.1016/0013-4694(83)90260-2. [DOI] [PubMed] [Google Scholar]
- Wernick JS, Starr A. Binaural interaction in the superior olivary complex of the cat: an analysis of field potentials evoked by binaural-beat stimuli. J Neurophysiol. 1968;31:428–441. doi: 10.1152/jn.1968.31.3.428. [DOI] [PubMed] [Google Scholar]
- Young SR, Rubel EW. Frequency-specific projections of individual neurons in chick brainstem auditory nuclei. J Neurosci. 1983;3:1373–1378. doi: 10.1523/JNEUROSCI.03-07-01373.1983. [DOI] [PMC free article] [PubMed] [Google Scholar]
- Zaaroor M, Starr A. Auditory brain-stem evoked potentials in cat after kainic acid induced neuronal loss. I. Superior olivary complex. Electroencephalogr Clin Neurophysiol. 1991;80:422–435. doi: 10.1016/0168-5597(91)90091-B. [DOI] [PubMed] [Google Scholar]


