Abstract
Aims:
To study the correlation between dyspnea, radiological findings, and pulmonary function tests (PFTs) in patients with sequelae of pulmonary tuberculosis (TB).
Materials and Methods:
Clinical history, chest computed tomography (CT), and PFT of patients with post-TB sequelae were recorded. Dyspnea was graded according to the Modified Medical Research Council (mMRC) scale. CT scans were analyzed for fibrosis, cavitation, bronchiectasis, consolidation, nodules, and aspergilloma. Semi-quantitative analysis was done for these abnormalities. Scores were added to obtain a total morphological score (TMS). The lungs were also divided into three zones and scores added to obtain the total lung score (TLS). Spirometry was done for forced vital capacity (FVC), forced expiratory volume in 1 s (FEV1), and FEV1/FVC.
Results:
Dyspnea was present in 58/101 patients. A total of 22/58 patients had mMRC Grade 1, and 17/58 patients had Grades 2 and 3 dyspnea each. There was a significant difference in median fibrosis, bronchiectasis, nodules (P < 0.01) scores, TMS, and TLS (P < 0.0001) between dyspnea and nondyspnea groups. Significant correlations were obtained between grades of dyspnea and fibrosis (r = 0.34, P = 0.006), bronchiectasis (r = 0.35, P = 0.004), nodule (r = 0.24, P = 0.016) scores, TMS (r = 0.398, P = 0.000), and TLS (r = 0.35, P = 0.0003). PFTs were impaired in 78/101 (77.2%) patients. Restrictive defect was most common in 39.6% followed by mixed in 34.7%. There was a negative but statistically insignificant trend between PFT and fibrosis, bronchiectasis, nodule scores, TMS, and TLS. However, there were significant differences in median fibrosis, cavitation, and bronchiectasis scores in patients with normal, mild to moderate, and severe respiratory defects. No difference was seen in TMS and TLS according to the severity of the respiratory defect.
Conclusion:
Both fibrosis and bronchiectasis correlated with dyspnea and with PFT. However, this correlation was not linear. The overall extent of radiological abnormalities correlated only with dyspnea but not with PFT.
KEY WORDS: Computed tomography, dyspnea, posttubercular sequelae, pulmonary function test, pulmonary tuberculosis, radiological-functional correlation
INTRODUCTION
Tuberculosis (TB) is a global public health problem, with a worldwide prevalence of 11.0 million and an annual incidence of 9.0 million in 2013. India remains the highest contributor to the global disease burden, accounting for 24% of global cases and an estimated incidence of 2.0 million cases in 2013.[1] Despite adequate pharmacologic treatment, the disease while healing produces fibrosis, cavitation, and calcification leaving permanent sequelae in the lungs.[2,3,4] For a significant proportion of patients, these morphologic sequelae continue to be a source of respiratory symptoms and compromised pulmonary function for rest of their life. Such patients present with varying severity of dyspnea, hemoptysis, pulmonary artery hypertension (PAH), or recurrent secondary infections; and are often treated with antitubercular therapy repeatedly.[5,6,7,8] Hence, sequelae of pulmonary TB constitute a large burden on the public health system.
Previous studies have shown that patients with pulmonary TB often have impaired lung spirometry parameters at the time of presentation; and while ventilatory function improves with treatment, a significant residual deficit remains even after complete microbiological cure.[7,9,10,11] This residual deficit leads to impaired quality of life and long-term morbidity and mortality in these successfully treated patients.[12,13] Furthermore, it has been shown that the chronic pulmonary impairment increases incrementally with the number of previous episodes of TB.[14]
Post-TB sequelae can have diverse radiological manifestations involving pulmonary parenchyma, airways, vasculature, pleura, and mediastinum. The spectrum of these manifestations includes: (a) Parenchymal lesions such as tuberculoma, thin-walled cavity, fibrosis, end-stage lung destruction, aspergilloma, and scar carcinoma; (b) airway lesions such as bronchiectasis, tracheobronchial stenosis, and broncholithiasis; (c) vascular lesions such as pulmonary or bronchial arteritis and thrombosis, bronchial artery dilatation, and Rasmussen aneurysm; (d) mediastinal lesions such as lymph node calcification, esophago-mediastinal or esophago-bronchial fistula, constrictive pericarditis, and fibrosing mediastinitis; (e) pleural lesions such as chronic empyema, fibrothorax, bronchopleural fistula, and pneumothorax; and (f) chest wall lesions such as rib TB, tuberculous spondylitis, and malignancy associated with chronic empyema.[2,3] Thus, functional impairment in post-TB sequelae can be secondary to more than one of these diverse morphologic changes. The literature regarding the type of functional defect in post-TB sequelae is similarly heterogeneous; with some studies concluding that airflow obstruction is more common,[15,16,17,18,19] while in others, restrictive and mixed restrictive-obstructive defects were more common.[8,11,20]
While most studies on functional impairment have focussed on patients with active TB or at the completion of 6 months of antitubercular therapy, similar data on patients with post-TB sequelae are lacking. The current literature lacks a definite correlation between morphological changes as observed on computed tomography (CT), the severity of radiological findings, and severity of clinical symptoms. Thus, the purpose of our study was to correlate the severity of dyspnea with radiological findings and pulmonary function tests (PFTs).
MATERIALS AND METHODS
This was a prospective cross-sectional study and the study group comprised patients with the previous history of TB, who presented to the hospital with any respiratory symptom such as dyspnea, cough, or hemoptysis. The patients were diagnosed to have pulmonary TB in the past if sputum was acid-fast Bacilli positive or if they had at least 3 of the following four criteria: (1) A tuberculin skin test with 5 tuberculin units purified protein derivative showing area of induration more than 10 mm; (2) clinical symptoms suggestive of pulmonary TB for example, fever, cough, sputum, hemoptysis, weight loss, and anorexia; (3) radiographic findings compatible with pulmonary TB such as miliary disease, consolidation, cavitatary lesions, ill-defined parenchymal infiltrates, hilar, or mediastinal lymphadenopathy; and (4) response to antitubercular treatment. Patients <12 years of age were excluded. The study was approved by the Institutional Ethics Committee, and informed consent was taken from all patients.
For all patients with post-TB sequelae with respiratory symptoms, the clinical details, CT findings, and the PFTs were recorded at the time of presentation.
Clinical evaluation
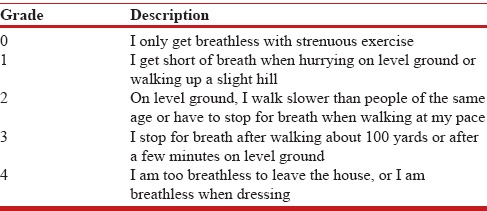
The patients were questioned regarding the presence and duration of following symptoms (a) dyspnea, (b) cough, and (c) hemoptysis. The duration of these symptoms was recorded as less or more than 6 months. Patients were asked to grade the severity of dyspnea according to the Modified Medical Research Council (mMrc) grading [Table 1].[21] The mMRC scale is a good index of the quality of life in patients with chronic obstructive pulmonary disease (COPD) and other respiratory disorders and correlates well with functional impairment.[21,22] Smoking history was noted, and patients categorized as current smokers, previous smokers (those having quit 6 months prior or earlier), and nonsmokers.
Table 1.
Modified Medical Research Council grading of dyspnea
Multidetector computer tomography evaluation
CT scans of the thorax were obtained in supine position from apices to lung bases in full inspiration after intravenous injection of 50–60 ml nonionic iodinated contrast on either 40 slices (Somatom Sensation 40) or 256-slice (definition flash) CT scanners (Siemens, Erlangen, Germany). Images were acquired at collimation of 40 × 1.2 mm (on Somatom Sensation 40) and 128 × 1.2 mm (on definition flash CT scanner). Image reconstruction was carried out on SYNGO 2006A workstation (Somatom Sensation 40) or Syngo.via platform (Definition Flash). Axial images were reconstructed using a slice thickness of 5 mm and 5 mm reconstruction increment and viewed at standard mediastinal window and lung window settings. High-resolution CT images were also reconstructed at 1 mm slice thickness and 10 mm increment using a sharp (bone) kernel (B80).
All CT scans were analyzed by one radiologist with 15 years' experience in chest imaging to avoid inter-reader variation. The reader was blinded to clinical details, PFT scores, type and severity of respiratory defect, and evaluated the CT scans for the presence of morphological abnormalities such as (a) fibrosis, (b) cavitation, (c) bronchiectasis, (d) consolidation, (e) nodules, and (f) aspergilloma.
Semi-quantitative analysis was done for each of these abnormalities using a visual estimation of the extent of abnormality present expressed regarding percentage of each lung involvement as shown in Table 2. The lungs were divided into three zones – Upper zone defined as the area above the carina, middle zone: Between the carina and inferior pulmonary veins, and lower zone: Below the level of the inferior pulmonary veins [Figure 1]. Radiological involvement of zones by disease was also scored as shown in Table 2.
Table 2.
Computed tomography scoring system according to percentage of lung involvement
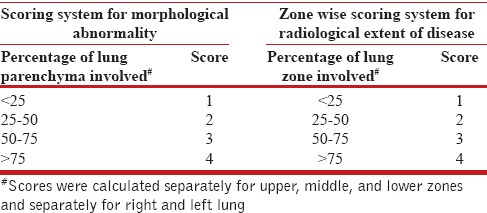
Figure 1.
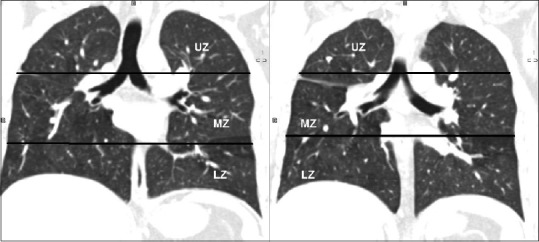
Zonal division of lungs. Computed tomography coronal reformatted images show the division of lungs into upper, middle and lower zones. Upper zone was defined as area above the carina, middle zone as area between carina and junction of inferior pulmonary veins with left atrium and lower zone as the area below the second line. UZ: Upper zone, LN: Lower zone, MZ: Middle zone
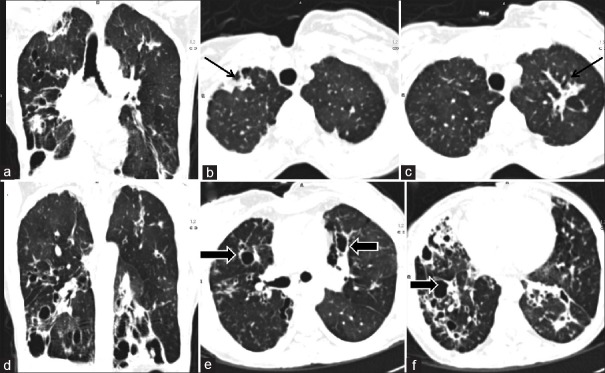
Thus, for each of these morphological findings, the score was 0 if findings were absent, and the maximum score was 8 for both lungs. The sum of these scores for six abnormalities was added to obtain a total morphological score (TMS) with 0 being minimum and 48 being maximum possible obtainable score [Figure 2]. The scores of the six lung zones were added to obtain a single score named total lung score (TLS). Normal lungs had a TLS of 0 while the maximum possible TLS was 24 [Figure 3].
Figure 2.
Scoring for morphological abnormalities. Computed tomography images of a 35-year-old lady. Computed tomography images show fibrosis in bilateral upper zone (black arrows b and c) and fibro bronchiectatic changes in bilateral middle zone and lower zone (block arrows e and f). The extent of abnormalities is better appreciated on coronal reformatted images (a and d). The fibrosis score for right and left lung was 2 and 2 respectively, bronchiectasis score for right and left lung was 3 and 2 and cavitation score for right and left lung was 1 and 0. There were no nodules, consolidation and aspergilloma thus giving an overall total morphological score of 10
Figure 3.

Calculation of total lung score computed tomography images of the same patient shown in Figure 2. There was <25% involvement of right upper zone (black arrow) and <50% involvement of left upper zone (black block arrow) with fibrosis. Thus upper zone score for right and left lungs was 1 and 2 respectively. The middle zone score for right lung was 4 (>75% involvement) and left lung was 3 (50–75%) (white block arrow, d). Both lower zone showed more than 75% involvement with fibro bronchiectatic changes (block arrows e and f) and scores were 4 each. Thus overall total lung score for this patient was 18
In addition, the transverse diameter of the main pulmonary artery (MPa) was recorded. A cut-off value of 29 mm was termed as pulmonary artery dilatation and served as a radiological indicator of PAH.[23]
Pulmonary function test evaluation
PFTs were measured using the FLOWHANDDY ZAN 100 USB machine (Germany). The results were reported as absolute volumes in liters as well as the percentage predicted of normal based on regression equations for the laboratory. The spirometer measurements were done for forced vital capacity (FVC), forced expiratory volume in 1 s (FEV1), FEV1/FVC, peak expiratory flow rate, and forced expiratory flow 25–75%. The type of ventilatory defect was classified as normal, obstructive, restrictive and mixed as per FEV1/FVC-based criteria, and the severity of pulmonary function impairment was classified as per the FEV1-based criteria recommended by the European Respiratory Society and the American Thoracic Society.[24] For data analyses, patients were further grouped into three categories according to the FEV1p scores into normal (FEV1p >80%), mild to moderate ventilatory defect (FEV1p 60–79%), and moderately severe to very severe defect (FEV1p <60%), and the CT scores were compared across these groups. Both PFT and imaging were done within ten days of each other.
Statistical analysis
Group data were expressed as median (range). Data were analyzed using Stata software (version 11.2, Stata Corp, College Station, TX, USA). Continuous variables were compared by Wilcoxon rank-sum test and Kruskal–Wallis test. Correlation coefficients were calculated using Spearman's rank method. P < 0.05 were considered significant.
RESULTS
A total of 105 patients with the previous history of TB and respiratory symptoms were initially recruited. Four patients were excluded from the final analysis because CT scan in three patients showed severe emphysematous changes secondary to COPD rather than post-TB sequelae and in one patient, CT showed respiratory bronchiolitis-interstitial lung disease secondary to smoking. Thus, the dyspnea severity, CT findings, and PFT findings were analyzed in 101 patients.
There were 72 males and 29 females with a median age of 38 years (range 18–65 years). A total of 77/101 (76.2%) patients were nonsmokers while 24/101 (23.7%) patients were either smokers or ex-smokers. Of 101 patients, dyspnea was present in 58/101 (57.4%) while 77/101 (76.2%) patients had cough, and 92/101 (91.1%) patients had hemoptysis. A total of 38/58 (65.5%) patients with dyspnea had this symptom for more than 6 months duration. The distribution of dyspnea severity is shown in Figure 4.
Figure 4.
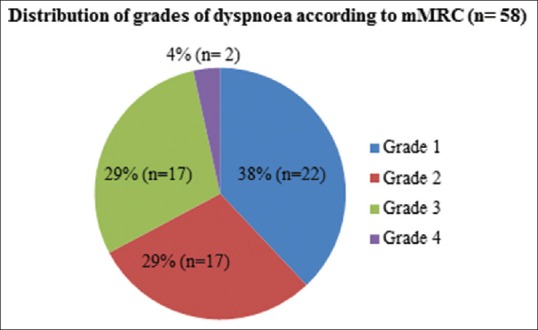
Distribution of grades of dyspnea according to Modified Medical Research Council
Computed tomography analysis and clinical and computed tomography correlation
CT scores were compared between the patients with dyspnea and those without. The median scores for individual morphological abnormalities, TMS, and TLS for overall population, dyspnea and nondyspnea group are shown in Table 3. There was a significant difference in the median scores for fibrosis, bronchiectasis, and nodules between dyspnea and nondyspnea groups. The difference in TMS and TLS between two groups was also highly significant with P < 0.0005 [Table 3]. However, the maximum TMS even in patients with dyspnea was only 16, against a maximum obtainable score of 48. This is because of the low-nodule score and absent consolidation and aspergillomas scores in overall population. The maximum TLS score in dyspnea group was 20, and nondyspnea group was 19 against a maximum obtainable score of 24.
Table 3.
Median scores of computed tomography findings in overall population, dyspnea and nondyspnea group
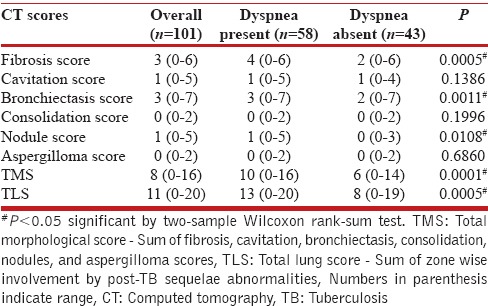
Of 101 patients, 27 patients had either the right or left side lung scores of 10 and above (implying more than 50% involvement of at least two zones). A total of 11/27 belonged to nondyspnea group and 16 to dyspnea group, suggesting that asymmetric or predominantly unilateral lung involvement was seen in both groups [Figure 5].
Figure 5.
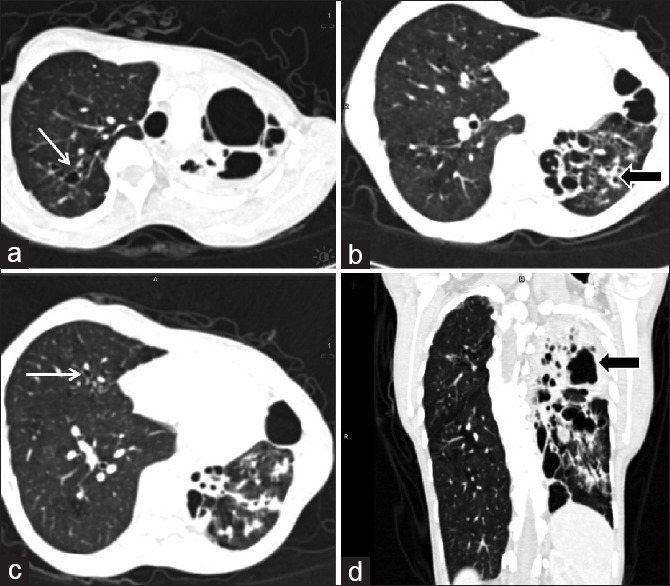
Unilateral involvement of lung computed tomography images of a 34-year-old lady with Grade 3 dyspnea. Computed tomography images show < 25% involvement of right lung with minimal bronchiectasis (white arrow a and c) while left lung shows near complete involvement with involvement of all three zones (black arrow b and d). Thus the right lung zonal score was 1 while left lung zonal score was 12 (4 for each zone) and total lung score was 13. The right lung also shows compensatory hyperinflation and mosaic attenuation suggestive of small airway disease
Statistical significant correlations were obtained between grades of dyspnea and fibrosis score (r = 0.34, P = 0.006), bronchiectasis score (r = 0.35, P = 0.004), nodules score (r = 0.24, P = 0.016), TMS (r = 0.398, P = 0.000), and TLS (r = 0.35, P = 0.0003) using Spearman's rank method.
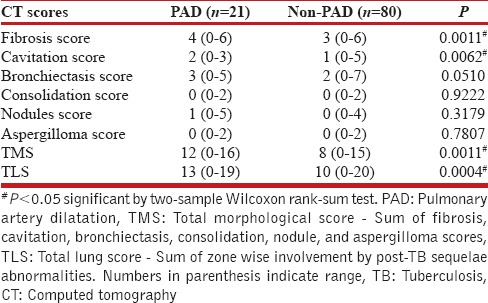
The mean ± standard deviation MPa diameter was 24.9 ± 4 mm (range 1.8–3.5 cm). Using a previously described value of 29 mm, 21 out of 101 patients had pulmonary artery dilatation with 15 having dyspnea, and 6 without dyspnea. The median age of patients with pulmonary artery dilatation and likely to develop PAH was 34.5 years (range 16–70 years). The median scores for patients with or without pulmonary artery dilatation are shown in Table 4.
Table 4.
Median scores of computed tomography findings in patients with pulmonary artery dilatation and without nonpulmonary artery dilatation
Pulmonary function test analysis and correlation with computed tomography
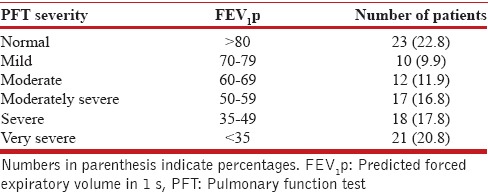
The PFTs were impaired in 78/101 (77.2%) patients while 23 patients presented with normal ventilation without any defect. The most common type of abnormality noted was a restrictive defect, observed in 40/101 (39.6%) patients, followed by a mixed restrictive-obstructive defect (34.7%). Only 3 out of 101 patients presented with a purely obstructive defect. The distribution of severity of spirometric abnormalities has been shown in Table 5. More than half of the patients (55.4%) presented with moderately severe to very severe defects (FEV1p <60%).
Table 5.
Severity of ventilatory defect in patients with posttuberculosis sequelae
On comparing CT scores with FEV1p and FVC, fibrosis, bronchiectasis, nodule scores, TMS, and TLS showed negative correlation; i.e., as CT scores increased, FEV1p and FVC decreased, but the trend was not statistically significant for any of these radiological parameters.
Patients were further grouped into three categories according to the FEV1p scores into normal, mild to moderate ventilatory defect (FEV1p 60–79%), and moderately severe to very severe defect FEV1p <60%, and the CT scores were compared across these groups. The median CT scores according to the severity of defects are shown in Table 6.
Table 6.
Median scores of computed tomography findings according to severity of ventilatory defect

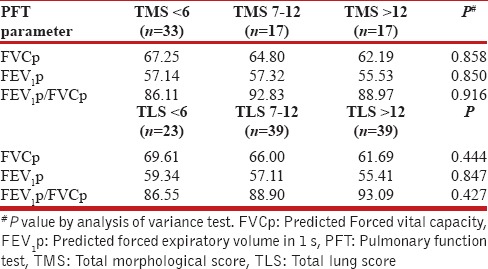
We also analyzed the PFT values according to grouped TMS and TLS scores. While there was a decrease in mean FVC1p with increasing TMS and TLS, the trend was not significant. Similarly, the mean FEV1p decreased with increasing TLS, but the correlation was not significant [Table 7].
Table 7.
Pulmonary function test parameters in grouped total morphological score and total lung score
DISCUSSION
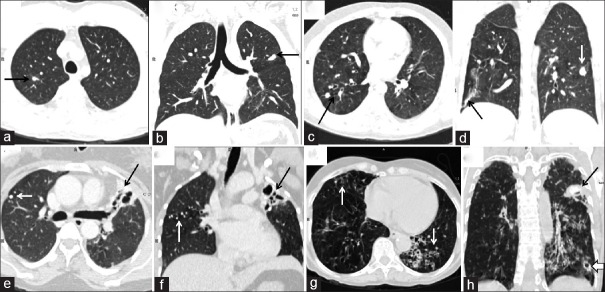
The most prevalent imaging findings in our study were fibrosis and bronchiectasis; both of which are common sequelae of pulmonary TB. Mycobacterium tuberculosis microorganism is known to spread via the endobronchial route and produce a chronic granulomatous reaction in airways and lung parenchyma which while healing leads to fibrosis and bronchiectasis.[2] Moreover, these radiological findings also had clinical significance as the fibrosis and bronchiectasis scores were significantly different in patients with or without dyspnea and also showed significant correlation with grades of dyspnea [Figure 6]. Thus, the morphologic lung damage contributed to the clinical symptoms. Nodule score was also significantly higher in patients with dyspnea than those without dyspnea and showed significant positive correlation with dyspnea grades. As centrilobular nodules are considered to represent either active infection or can be seen in airway disease,[2] they may have been contributory to the dyspnea in these patients. Both TMS (sum of all morphological findings) and TLS (sum of the radiological extent of disease) were significantly higher in patients with dyspnea suggestive of radiologic-clinical correlation. The maximum TLS was 20 while the median TLS was 11 against a maximum of 24 suggesting that one patient had more than 80% (20/24) involvement of lungs by the radiologic sequelae of TB while about 50% (11/24) involvement by post-TB sequelae was most common in overall population.
Figure 6.
Increase in total morphological score and total lung score with severity of dyspnea. Computed tomography images of four different patients with increasing dyspnea. (a and b) Grade 1 dyspnea total morphological score: 2 total lung score: 2. Calcified nodules in both upper zone (black arrows). (c and d) Grade 2 dyspnea total morphological score: 5 total lung score: 6. Fibrobronchiectasis in both lower zone (black arrows) and consolidation in left middle zone (white arrow, d). (e and f) Grade 3 dyspnea total morphological score: 11 total lung score: 11. Calcified nodules in right upper zone and middle zone (white arrow, e), fibro bronchiectatic changes in left upper zone (black arrow, f). (g and h) Grade 4 dyspnea total morphological score: 12 total lung score: 13. Bronchiectasis in both lower zone, peribronchial thickening (white arrows, g), consolidation in left upper zone (black arrow, h) and cavity with perilesional consolidation in left lower zone (block arrow, h). While there was an overall positive trend between lung scores and dyspnea severity but the trend was not directly linear or directly proportional
Pulmonary artery dilatation (MPa diameter >29 mm) was seen in 20.7% of patients and was radiologically labeled as likely to have PAH. Dyspnea was present in 70% of these patients (15/21). The median age of patients with pulmonary artery dilatation was only 34.5 years. This is comparable to the median age of 43 years in a study on PAH in patients with post-TB-sequelae by Ahmed et al.[25] Thus, patients developing PAH as sequelae of TB are younger than patients developing PAH secondary to chronic obstructive airway disease (median age 66 years).[26] In our study, there were significant differences in the median TMS and TLS in patients with or without pulmonary artery dilatation. Among radiological findings, the median fibrosis and cavitation scores differed significantly between both groups. This is in agreement with the study by Ahmed et al.[25] in which fibrocavitary disease was seen in 50% of patients with PAH due to PTB sequelae. Development of PAH in post-TB sequelae has been attributed to both structural lung damage and repeated secondary infections. The structural lung damage produced by the microorganism in the form of fibrosis and bronchiectasis leads to impaired gas exchange and ventilation while the presence of cavities predisposes to recurrent secondary infections and continued lung damage leading to PAH.[25,27] It is important to identify PAH as a consequence of PTB as it may be reversible in early stages or may be preventable with adequate pharmacologic therapy and also contributes to the overall mortality and morbidity in these patients.[27]
Impaired PFTs were seen in 77.2% of patients with restrictive defect being most common (39.6%), followed by mixed restrictive-obstructive (34.7%) while obstructive defects were seen in only 2.8% cases. In a previous study by de Vallière and Barker,[9] which assessed residual lung damage after completion of treatment for multidrug-resistant TB (MDR-TB), abnormal PFT was found in 94% (31/33) of patients with restrictive defect in 42%, mixed defect in 39%, and obstructive defect in 12%. Singla et al.[11] also analyzed PFTs after completion of tubercular therapy in MDR-TB patients and found abnormal spirometric values in 96% patients with predominantly mixed type of defect 66% patients while 19% had pure restriction and 11% had a pure obstruction. However, in another study by Plit et al.,[10] which assessed the change in PFT during TB treatment and residual disease after treatment, 46% of patients had abnormal spirometry after treatment completion, and obstructive defect was seen in 28% while restrictive defect was seen in 24%. Obstructive defects were also more common in studies by Akkara et al.[8] and Menezes et al.[16] Thus, while abnormal spirometric values are common even after successful completion of TB treatment, the type of defect is variable due to variation in disease extent and patient selection criteria.
The predominant mixed or restrictive pattern of ventilatory defect has been attributed to the dual effect on ventilation and perfusion by the microorganism. In patients with previous history of TB, the airways are structurally abnormal which leads to reflex vasoconstriction and hypoxemia. Second, the microorganism also directly induces arteritis and thrombosis which impairs perfusion.[2,28] Patients with post-TB sequelae also have other abnormalities such as pleural thickening, parenchymal fibrosis, and atelectasis which contribute to the predominantly mixed to the restrictive pattern of abnormality rather than pure airflow obstruction.[2]
Although we observed a negative trend in FEV1p and FVC with increasing fibrosis, bronchiectasis, nodule scores, TMS and TLS, the trend was not statistically significant for the overall population. On the other hand, statistically significant difference was noted in median fibrosis, cavitation, and bronchiectasis scores when compared across grouped FEV1p scores [Table 6]. Patients with a severe defect (FEV1p <60%) had significantly higher scores for these three radiological findings as compared to patients with mild to moderate defect (FEV1p between 60% and 79%) and normal ventilation (FEV1p >80%). However, paradoxical though statistically insignificant decrease was noted in TMS and TLS with increasing ventilatory defect. The decrease in TMS can be explained by the variable presence of consolidation, nodules, and aspergillomas in patients and no or marginal contribution of these individual scores to overall TMS. Hence, we calculated a modified TMS comprising fibrosis, cavitation, and bronchiectasis scores, and significant increase was seen in modified TMS with increasing severity of ventilatory defect. Thus, fibrocavitary changes and bronchiectasis were seen to show functional correlation.
TLS was the sum of overall radiological extent of abnormalities. Although the TLS was higher in patients with normal ventilation as compared to patients with impaired ventilation, the difference was not significant. Both FVCp and FEV1p showed a negative trend with increasing TLS, but this trend was also not significant. Similarly, the negative trend in FVCp with increasing TMS was not significant. Thus, the overall extent of radiological abnormalities did not correlate with the severity of ventilatory defect and the individual functional parameters. This can be explained by the heterogeneous spectrum of post-TB sequelae in the form of fibroparenchymal, airway, vascular, and pleural changes which are not reflected directly by individual PFT parameters. There are some limitations of our study. First, selection bias could be present as only patients who came to the hospital were evaluated. The patients were symptomatic either for dyspnea, cough, or hemoptysis. Thus, the radiological – clinical – functional correlation demonstrated here may not apply to the general population with asymptomatic post-TB sequelae patients. Second, we did a cross-sectional analysis, comparing CT with PFTs at a single time point. PFTs parameters can be variable and are affected by patients' age, respiratory effort, and respiratory symptoms at the time of testing. Thus, further studies should include PFT testing at multiple time points (at least 3 sittings) to obtain mean PFT parameters which should then be compared with CT to minimize variability and give a more representative evaluation. Third, we did not separately analyze the CT findings, dyspnea severity, and PFTs of patients who were smokers or ex-smokers. Smoking is an independent cause for chronic airflow obstruction and can affect PFT parameters. However, this may not have been a significant confounding factor in our study because less than one-fourth patients had a history of smoking and obstructive defect was seen in only three patients. Furthermore, the reversibility of airway obstruction with bronchodilator therapy and diffusing capacity of the lung; the capacity of the lungs to transfer carbon monoxide was not assessed, and this may have affected the functional analysis.
CONCLUSION
This study correlated dyspnea, radiologic abnormalities, and spirometry in patients with post-TB-sequelae. Both fibrosis and bronchiectasis correlated with the presence and severity of dyspnea and with the severity of the respiratory defect. This correlation was however not linear. The overall extent of radiological abnormalities correlated only with presence and severity of dyspnea but not with PFT parameters, which can be due to the heterogeneity of radiological involvement in post-TB-sequelae.
Financial support and sponsorship
Funded by All India Institute of Medical Sciences, New Delhi, India.
Conflicts of interest
There are no conflicts of interest.
REFERENCES
- 1.WHO Global Tuberculosis Report. 2014. [Last accessed on 2015 Apr 02]. Available from: http://www.who.int/tb/publications/global_report/en/
- 2.Kim HY, Song KS, Goo JM, Lee JS, Lee KS, Lim TH. Thoracic sequelae and complications of tuberculosis. Radiographics. 2001;21:839–58. doi: 10.1148/radiographics.21.4.g01jl06839. [DOI] [PubMed] [Google Scholar]
- 3.Im JG, Itoh H, Shim YS, Lee JH, Ahn J, Han MC, et al. Pulmonary tuberculosis: CT findings – Early active disease and sequential change with antituberculous therapy. Radiology. 1993;186:653–60. doi: 10.1148/radiology.186.3.8430169. [DOI] [PubMed] [Google Scholar]
- 4.Winer-Muram HT, Rubin SA. Thoracic complications of tuberculosis. J Thorac Imaging. 1990;5:46–63. doi: 10.1097/00005382-199004000-00008. [DOI] [PubMed] [Google Scholar]
- 5.Vecino M, Pasipanodya JG, Slocum P, Bae S, Munguia G, Miller T, et al. Evidence for chronic lung impairment in patients treated for pulmonary tuberculosis. J Infect Public Health. 2011;4:244–52. doi: 10.1016/j.jiph.2011.08.005. [DOI] [PubMed] [Google Scholar]
- 6.Pasipanodya JG, McNabb SJ, Hilsenrath P, Bae S, Lykens K, Vecino E, et al. Pulmonary impairment after tuberculosis and its contribution to TB burden. BMC Public Health. 2010;10:259. doi: 10.1186/1471-2458-10-259. [DOI] [PMC free article] [PubMed] [Google Scholar]
- 7.Pasipanodya JG, Miller TL, Vecino M, Munguia G, Garmon R, Bae S, et al. Pulmonary impairment after tuberculosis. Chest. 2007;131:1817–24. doi: 10.1378/chest.06-2949. [DOI] [PubMed] [Google Scholar]
- 8.Akkara SA, Shah AD, Adalja M, Akkara AG, Rathi A, Shah DN. Pulmonary tuberculosis: The day after. Int J Tuberc Lung Dis. 2013;17:810–3. doi: 10.5588/ijtld.12.0317. [DOI] [PubMed] [Google Scholar]
- 9.de Vallière S, Barker RD. Residual lung damage after completion of treatment for multidrug-resistant tuberculosis. Int J Tuberc Lung Dis. 2004;8:767–71. [PubMed] [Google Scholar]
- 10.Plit ML, Anderson R, Van Rensburg CE, Page-Shipp L, Blott JA, Fresen JL, et al. Influence of antimicrobial chemotherapy on spirometric parameters and pro-inflammatory indices in severe pulmonary tuberculosis. Eur Respir J. 1998;12:351–6. doi: 10.1183/09031936.98.12020351. [DOI] [PubMed] [Google Scholar]
- 11.Singla N, Singla R, Fernandes S, Behera D. Post treatment sequelae of multi-drug resistant tuberculosis patients. Indian J Tuberc. 2009;56:206–12. [PubMed] [Google Scholar]
- 12.Ralph AP, Kenangalem E, Waramori G, Pontororing GJ, Sandjaja, Tjitra E, et al. High morbidity during treatment and residual pulmonary disability in pulmonary tuberculosis: Under-recognised phenomena. PLoS One. 2013;8:e80302. doi: 10.1371/journal.pone.0080302. doi: 10.1371/journal.pone.0080302. eCollection 2013. [DOI] [PMC free article] [PubMed] [Google Scholar]
- 13.Maguire GP, Anstey NM, Ardian M, Waramori G, Tjitra E, Kenangalem E, et al. Pulmonary tuberculosis, impaired lung function, disability and quality of life in a high-burden setting. Int J Tuberc Lung Dis. 2009;13:1500–6. [PubMed] [Google Scholar]
- 14.Hnizdo E, Singh T, Churchyard G. Chronic pulmonary function impairment caused by initial and recurrent pulmonary tuberculosis following treatment. Thorax. 2000;55:32–8. doi: 10.1136/thorax.55.1.32. [DOI] [PMC free article] [PubMed] [Google Scholar]
- 15.Snider GL, Doctor L, Demas TA, Shaw AR. Obstructive airway disease in patients with treated pulmonary tuberculosis. Am Rev Respir Dis. 1971;103:625–40. doi: 10.1164/arrd.1971.103.5.625. [DOI] [PubMed] [Google Scholar]
- 16.Menezes AM, Hallal PC, Perez-Padilla R, Jardim JR, Muiño A, Lopez MV, et al. Tuberculosis and airflow obstruction: Evidence from the PLATINO study in Latin America. Eur Respir J. 2007;30:1180–5. doi: 10.1183/09031936.00083507. [DOI] [PubMed] [Google Scholar]
- 17.Lee SW, Kim YS, Kim DS, Oh YM, Lee SD. The risk of obstructive lung disease by previous pulmonary tuberculosis in a country with intermediate burden of tuberculosis. J Korean Med Sci. 2011;26:268–73. doi: 10.3346/jkms.2011.26.2.268. [DOI] [PMC free article] [PubMed] [Google Scholar]
- 18.Jung KH, Kim SJ, Shin C, Kim JH. The considerable, often neglected, impact of pulmonary tuberculosis on the prevalence of COPD. Am J Respir Crit Care Med. 2008;178:431. doi: 10.1164/ajrccm.178.4.431. [DOI] [PubMed] [Google Scholar]
- 19.Baig IM, Saeed W, Khalil KF. Post-tuberculous chronic obstructive pulmonary disease. J Coll Physicians Surg Pak. 2010;20:542–4. [PubMed] [Google Scholar]
- 20.Apostu M, Mihaescu T. Respiratory functional changes in pulmonary tuberculosis. Pneumologia. 2013;62:148–57. [PubMed] [Google Scholar]
- 21.Guidelines for the MMRC Dyspnea Scale. [Last accessed on 2015 Apr 02]. Available from: http://www.copd.about.com/od/copdbasics/a/MMRCdyspneascale.htm .
- 22.Hsu KY, Lin JR, Lin MS, Chen W, Chen YJ, Yan YH. The modified medical research council dyspnoea scale is a good indicator of health-related quality of life in patients with chronic obstructive pulmonary disease. Singapore Med J. 2013;54:321–7. doi: 10.11622/smedj.2013125. [DOI] [PubMed] [Google Scholar]
- 23.Corson N, Armato SG, 3rd, Labby ZE, Straus C, Starkey A, Gomberg-Maitland M. CT-based pulmonary artery measurements for the assessment of pulmonary hypertension. Acad Radiol. 2014;21:523–30. doi: 10.1016/j.acra.2013.12.015. [DOI] [PMC free article] [PubMed] [Google Scholar]
- 24.Pellegrino R, Viegi G, Brusasco V, Crapo RO, Burgos F, Casaburi R, et al. Interpretative strategies for lung function tests. Eur Respir J. 2005;26:948–68. doi: 10.1183/09031936.05.00035205. [DOI] [PubMed] [Google Scholar]
- 25.Ahmed AE, Ibrahim AS, Elshafie SM. Pulmonary hypertension in patients with treated pulmonary tuberculosis: Analysis of 14 consecutive cases. Clin Med Insights Circ Respir Pulm Med. 2011;5:1–5. doi: 10.4137/CCRPM.S6437. [DOI] [PMC free article] [PubMed] [Google Scholar]
- 26.Scharf SM, Iqbal M, Keller C, Criner G, Lee S, Fessler HE. National Emphysema Treatment Trial (NETT) Group. Hemodynamic characterization of patients with severe emphysema. Am J Respir Crit Care Med. 2002;166:314–22. doi: 10.1164/rccm.2107027. [DOI] [PubMed] [Google Scholar]
- 27.Kapoor SC. Pathogenesis of cor pulmonale in pulmonary tuberculosis. Indian J Tuberc. 1986;33:167–70. [Google Scholar]
- 28.Long R, Maycher B, Dhar A, Manfreda J, Hershfield E, Anthonisen N. Pulmonary tuberculosis treated with directly observed therapy: Serial changes in lung structure and function. Chest. 1998;113:933–43. doi: 10.1378/chest.113.4.933. [DOI] [PubMed] [Google Scholar]


