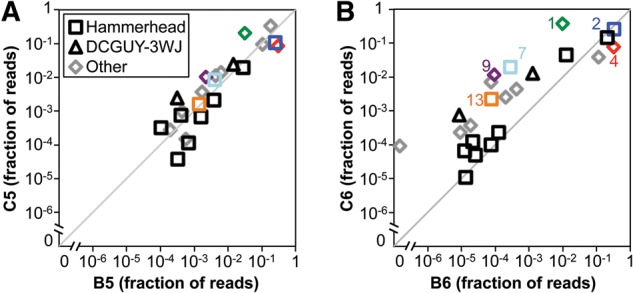
FIGURE 5.

The most abundant sequence families are present at similar abundances in the evolved populations. The fractional read abundances of sequence families within two populations are plotted against each other. The 20 most abundant sequence families within both populations are shown. Families with sequences that contain the hammerhead ribozyme motif are plotted as squares, those containing the DCGUY-3WJ motif are plotted as triangles, and all other families are plotted as diamonds. Families 1, 2, 4, 7, 9, and 13 are labeled and color-coded as in Figure 4. (A) Fractional abundances in the [−]clay and [+]clay evolved populations after five rounds of evolution, B5 and C5, respectively. (B) Fractional abundances in the [−]clay and [+]clay populations after six rounds of evolution, B6 and C6, respectively.
