Supplemental Digital Content is available in the text.
Keywords: critical care; nosocomial infections; pneumonia, ventilator associated; public health surveillance; ventilators, mechanical
Abstract
Objective:
Ventilator-associated event surveillance was introduced in the National Healthcare Safety Network in 2013, replacing surveillance for ventilator-associated pneumonia in adult inpatient locations. We determined incidence rates and characteristics of ventilator-associated events reported to the National Healthcare Safety Network.
Design, Setting, and Patients:
We analyzed data reported from U.S. healthcare facilities for ventilator-associated events that occurred in 2014, the first year during which ventilator-associated event surveillance definitions were stable. We used negative binomial regression modeling to identify healthcare facility and inpatient location characteristics associated with ventilator-associated events. We calculated ventilator-associated event incidence rates, rate distributions, and ventilator utilization ratios in critical care and noncritical care locations and described event characteristics.
Measurements and Main Results:
A total of 1,824 healthcare facilities reported 32,772 location months of ventilator-associated event surveillance data to the National Healthcare Safety Network in 2014. Critical care unit pooled mean ventilator-associated event incidence rates ranged from 2.00 to 11.79 per 1,000 ventilator days, whereas noncritical care unit rates ranged from 0 to 14.86 per 1,000 ventilator days. The pooled mean proportion of ventilator-associated events defined as infection-related varied from 15.38% to 47.62% in critical care units. Pooled mean ventilator utilization ratios in critical care units ranged from 0.24 to 0.47.
Conclusions:
We found substantial variability in ventilator-associated event incidence, proportions of ventilator-associated events characterized as infection-related, and ventilator utilization within and among location types. More work is needed to understand the preventable fraction of ventilator-associated events and identify patient care strategies that reduce ventilator-associated events.
Ventilator-associated pneumonia (VAP) has long been recognized as a patient safety threat. The Centers for Disease Control and Prevention (CDC) began conducting VAP surveillance in U.S. healthcare facilities in the 1970s: first in the National Nosocomial Infections Surveillance system (NNIS) and then in the National Healthcare Safety Network (NHSN) from 2006 to the present. NNIS and NHSN VAP surveillance definitions and methods were developed for use by hospitals in internal quality improvement efforts, years before the advent of state healthcare-associated infection (HAI) public reporting mandates and federal pay-for-reporting and -performance programs. Public reporting and federal incentive programs highlighted the limitations of VAP diagnostic criteria (1, 2), spurring development of a more objective and potentially automatable approach to public health surveillance for ventilator-associated conditions (VAC) and complications. This approach, termed “ventilator-associated event” (VAE) surveillance, was designed to capture an array of noninfection- and infection-related events in patients receiving mechanical ventilation and was implemented in NHSN in January 2013 for use in adult patients (3). VAE definitions were not designed to replace VAP as a clinical entity nor to be used in the clinical care of individual patients, and some studies, not surprisingly, have shown that there is poor correlation between VAEs and events detected by traditional VAP definitions (https://shea.confex.com/shea/2011/webprogram/Paper4111.html) (4–7).
Between 2013 and 2014, based on feedback from NHSN users and input from an expert working group, several changes to the VAE definitions were made. The first full year of surveillance using stable definitions occurred in 2014. We analyzed VAE data reported to NHSN according to the surveillance protocol to determine incidence rates and describe event characteristics.
MATERIALS AND METHODS
Data Source and Definitions
We analyzed VAE data reported to NHSN with event dates in 2014, using data reported through May 2015. Users are able to update their NHSN data at any time, and analyses of datasets from later months may yield slightly different results. In 2014, participation in VAE surveillance was limited to adult inpatient locations in acute care hospitals, long-term acute care hospitals (LTACHs), and inpatient rehabilitation facilities, and surveillance was voluntary. Among states, only Pennsylvania had a VAE reporting mandate, and VAE was not included in federal pay-for-reporting or -performance programs. We included VAEs and denominator data from locations that reported both numerator and denominator data during at least 1 month of 2014 in accordance with the NHSN surveillance protocol. This project was determined to be nonresearch public health surveillance by CDC.
Incidence and Event Characteristics
VAE surveillance definitions identify three syndromes: VAC, infection-related ventilator-associated complications (IVAC), and possible or probable ventilator-associated pneumonias (PoVAP or PrVAP; combined in 2015 into a single possible VAP [PVAP] definition) (Supplemental Material, Supplemental Digital Content 1, http://links.lww.com/CCM/B934). We determined rates of overall VAE (i.e., all events meeting at least the VAC definition) and IVAC-plus (i.e., all events meeting at least the IVAC definition) per 1,000 ventilator days. Data were analyzed in SAS version 9.3 (SAS Institute, Cary, NC). VAE rates were first stratified based on NHSN inpatient location type (http://www.cdc.gov/nhsn/PDFs/pscManual/15LocationsDescriptions_current.pdf), which has been a standard approach for reporting NHSN device-associated event data (8). To determine whether these location types should be further stratified, we used negative binomial regression modeling to explore additional variables, including facility medical school affiliation and postgraduate medical training program type (for cardiac, medical, medical-surgical, cardiothoracic surgical, and surgical ICUs) and unit bed size (for medical-surgical ICUs without major teaching affiliations). Facility medical training program types are defined in NHSN documentation (http://www.cdc.gov/nhsn/pdfs/pscmanual/16psckeyterms_current.pdf). The final model was selected based on parsimony and goodness of fit using the Akaike Information Criterion, Bayesian Information Criterion, and R2 statistics; multiple comparison-adjusted p values less than 0.05 were considered statistically significant. For location type strata with greater than or equal to five units reporting VAE data in 2014, we calculated pooled mean overall VAE and IVAC-plus incidence rates and ventilator utilization ratios (VURs, total number of ventilator days divided by the total number of patient days). We calculated overall VAE and IVAC-plus rate distributions and VUR distributions for location type strata with greater than or equal to 20 units reporting greater than or equal to 50 ventilator days (or ≥ 50 patient days, for VUR) in 2014.
Characteristics of VAEs, including patient age, sex, proportions of patients with VAE who died, and times to events, were determined. Differences in time to event medians and distributions were tested for statistical significance using Mood median test and Kuiper empirical distribution function. We also described the pathogens reported for PoVAP and PrVAP, including methicillin-resistant Staphylococcus aureus (MRSA) and selected carbapenem-resistant Gram-negative bacteria (Supplemental Material, Supplemental Digital Content 1, http://links.lww.com/CCM/B934).
RESULTS
Healthcare Facilities and Locations
In 2014, 3,207 units in 1,824 healthcare facilities submitted 32,772 adult location months of VAE data. Facilities participating in VAE surveillance were general acute care hospitals (1,588; 87.06%), LTACHs (110; 6.03%), critical access (69; 3.78%), military (27; 1.48%), and surgical hospitals (10; 0.55%). Twenty hospitals (1.10%) were other types. Common location types were medical/surgical (1,478; 46.09%), medical (383; 11.94%), and surgical cardiothoracic critical care units (232; 7.23%).
VAE and IVAC-Plus Incidence
VAE and IVAC-plus rates were calculated for noncritical care and critical care location types. Based on modeling results (Supplemental Material, Supplemental Digital Content 1, http://links.lww.com/CCM/B934), medical, medical-surgical, and surgical critical care units were further stratified according to academic affiliation (major teaching affiliation vs other or no affiliation), and medical-surgical critical care units with nonmajor teaching affiliations were further stratified by unit bed size (> 15 vs ≤ 15 beds) (Tables 1 and 2).
TABLE 1.
Overall Ventilator-Associated Event Incidence Rates, by Healthcare Facility Location Type, 2014
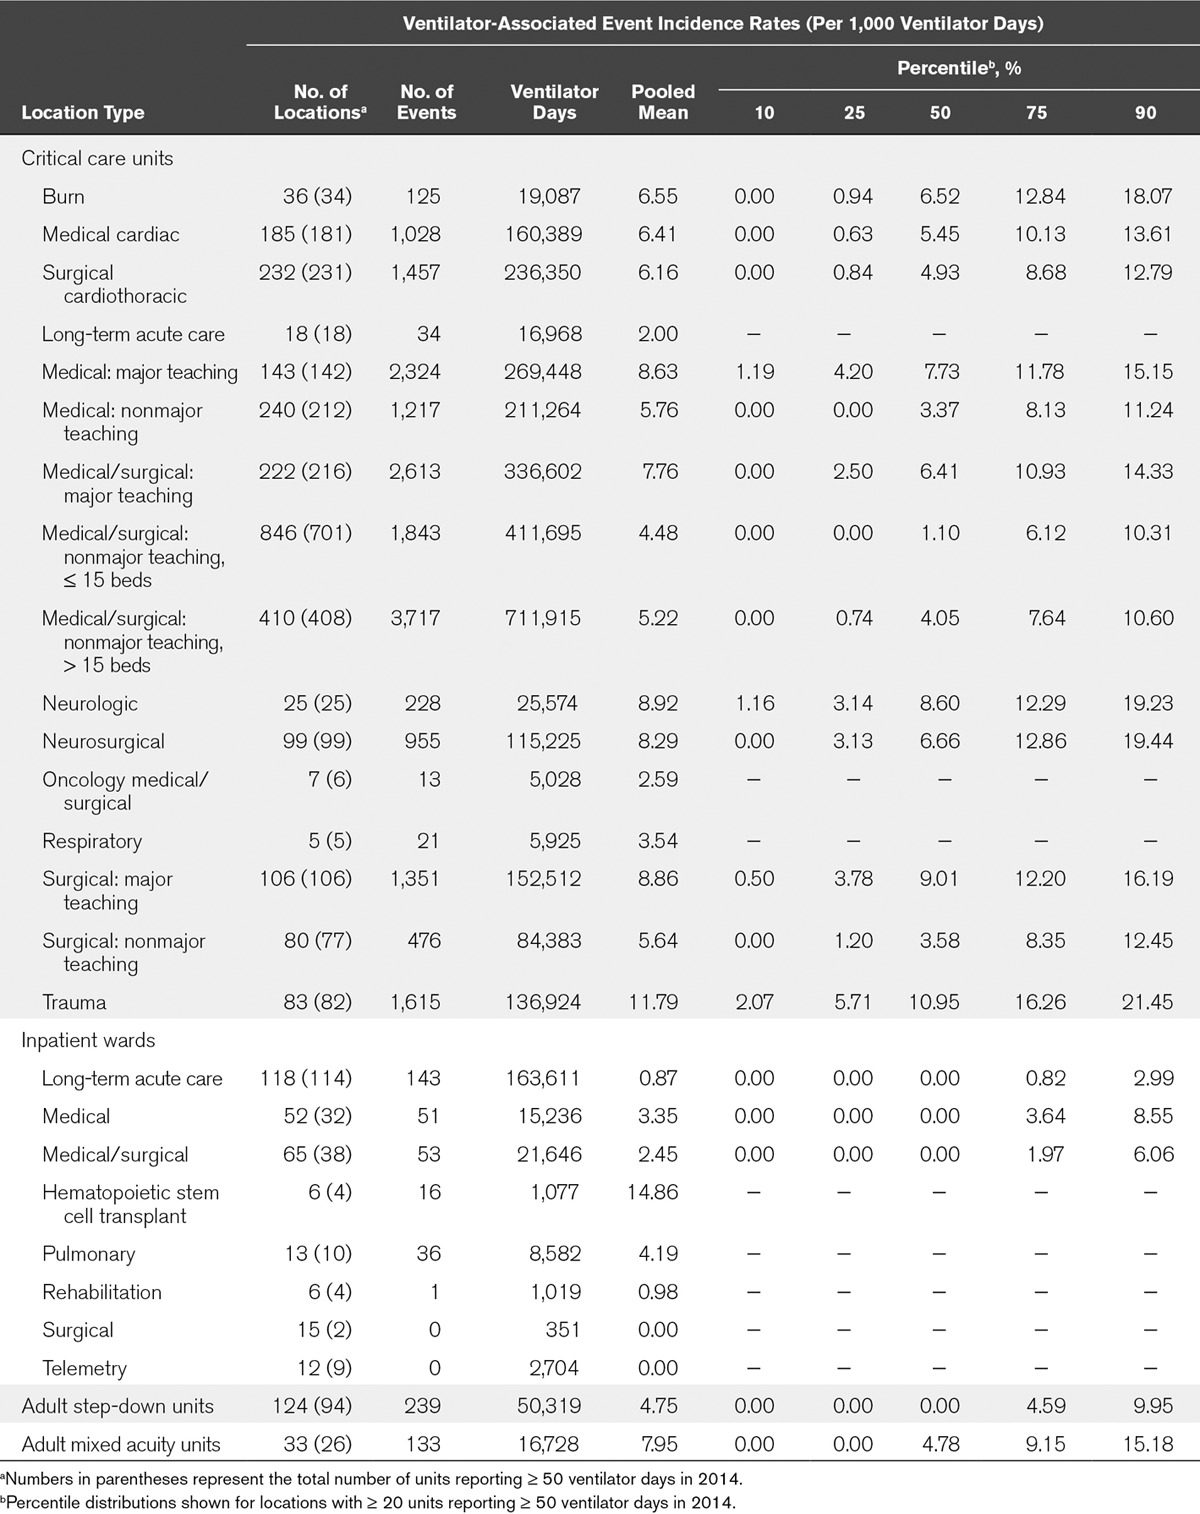
TABLE 2.
Incidence Rates of Events Meeting the Infection-Related Ventilator-Associated Complications, Possible Ventilator-Associated Pneumonia, or Probable Ventilator-Associated Pneumonia Definitions (Infection-Related Ventilator-Associated Complication-Plus), by Healthcare Facility Location Type, 2014
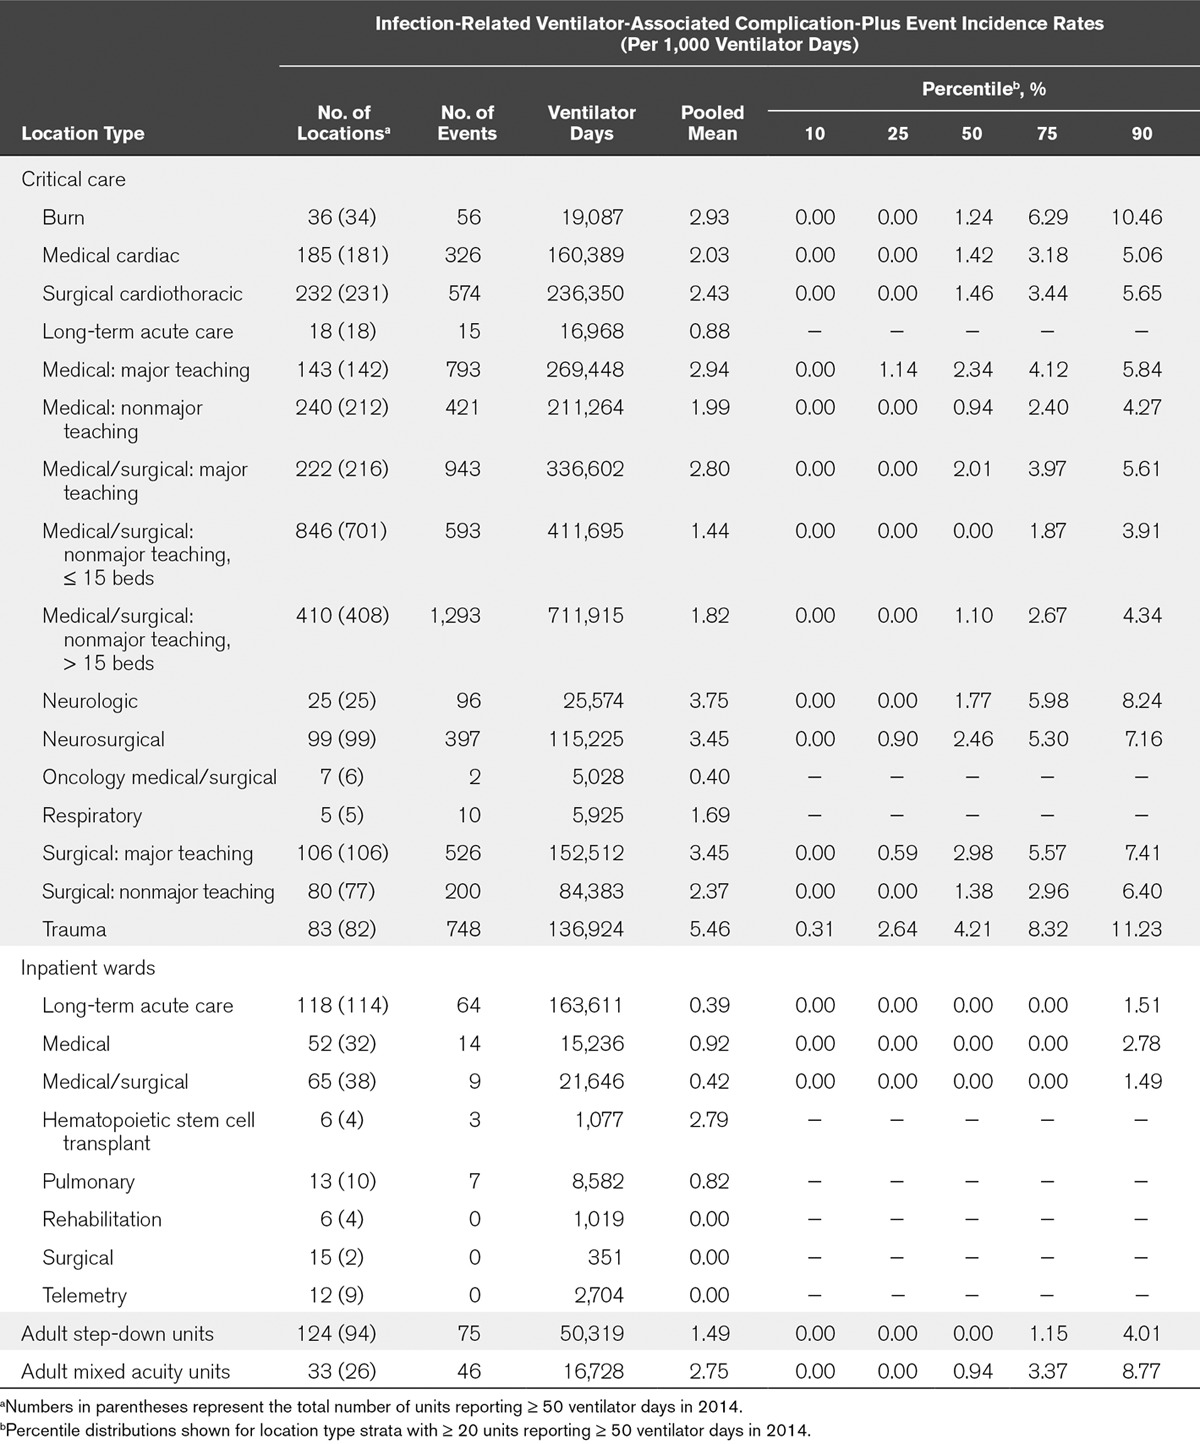
Among critical care units, locations with the highest pooled mean rates per 1,000 ventilator days were trauma (11.79) and neurology (8.92) critical care units. Locations with the lowest rates per 1,000 ventilator days were LTACH (2.00) and oncology medical-surgical (2.59) critical care units. Among noncritical care units, the highest rates were in hematopoietic stem cell transplant (14.86) and mixed acuity units (7.95), whereas the lowest rates were in surgical and telemetry wards (with no reported VAEs). IVAC-plus rates largely mirrored overall VAE rates (Table 2).
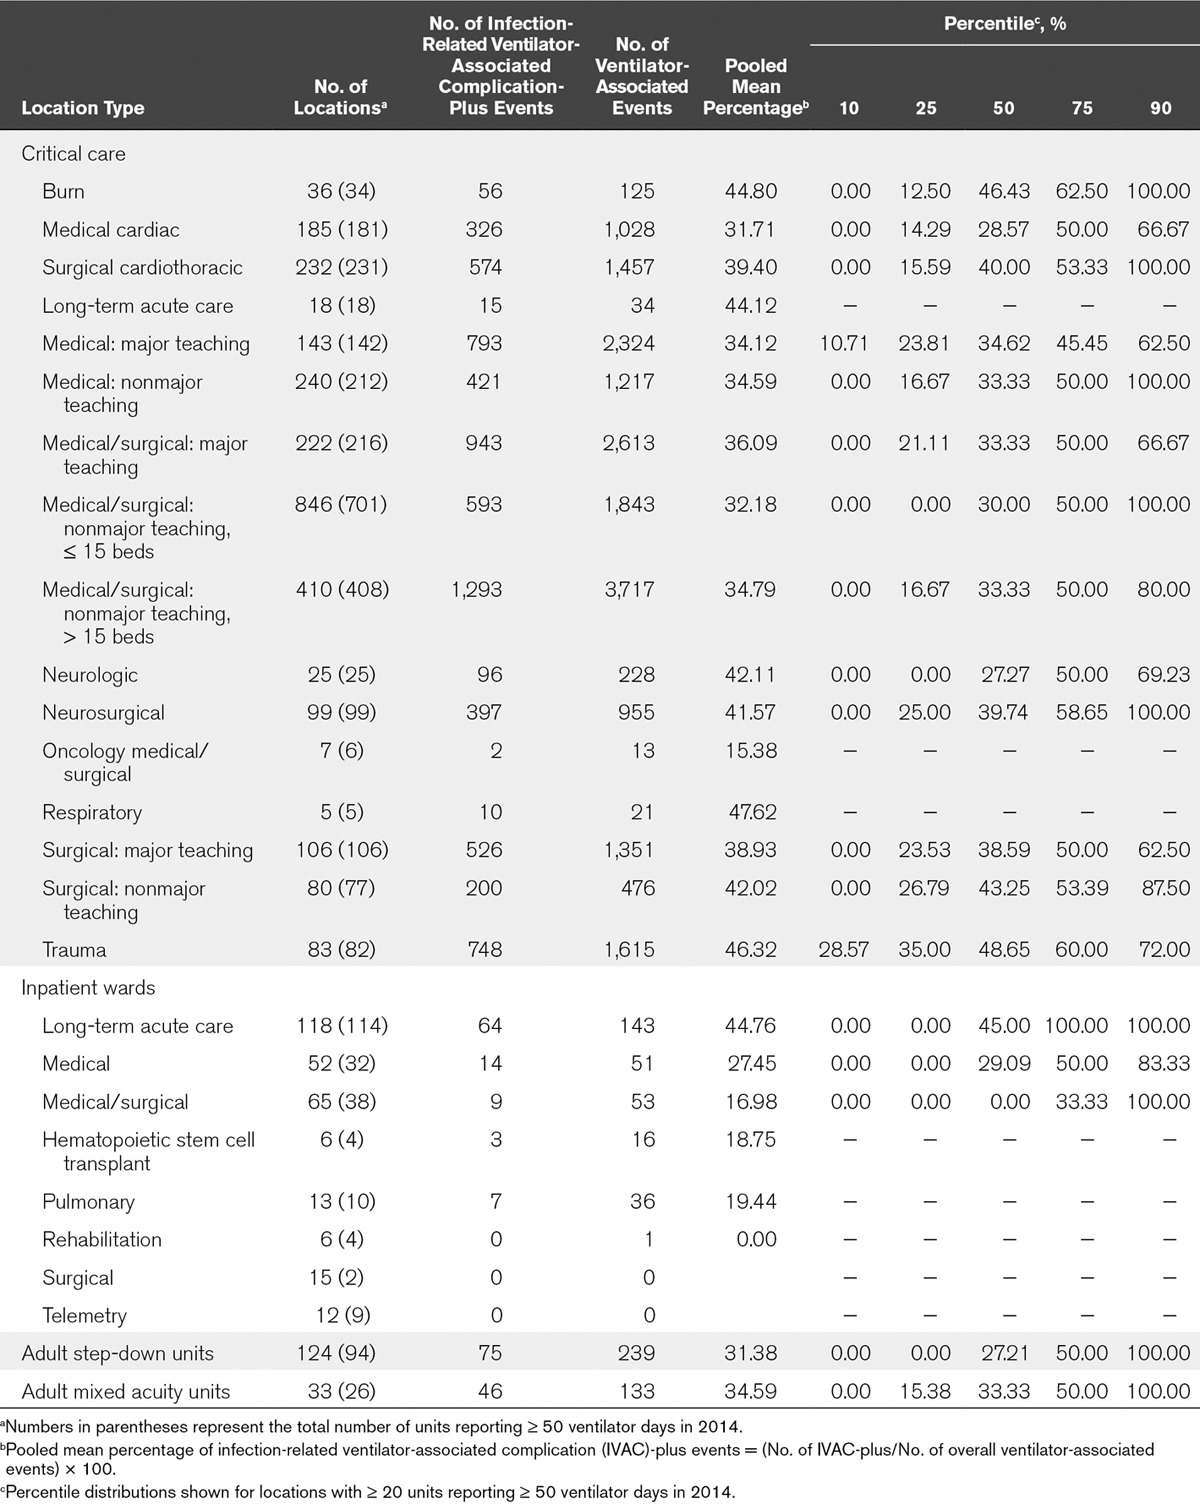
The proportion of VAEs that were IVAC-plus varied among and within location types (Table 3). Among critical care location types, those with the highest proportion of IVAC-plus events were respiratory critical care units, where the pooled mean percentage was 47.62%. By contrast, the critical care locations with the lowest proportion of IVAC-plus events (15.38%) were oncology medical-surgical critical care units. Within individual location types, the proportion of IVAC-plus events varied widely: for example, from 0% in some medical critical care units to 100% in others.
TABLE 3.
Percentages of Ventilator-Associated Events Comprised of Infection-Related Ventilator-Associated Complication-Plus Events, by Healthcare Facility Location Type, 2014
Ventilator Utilization
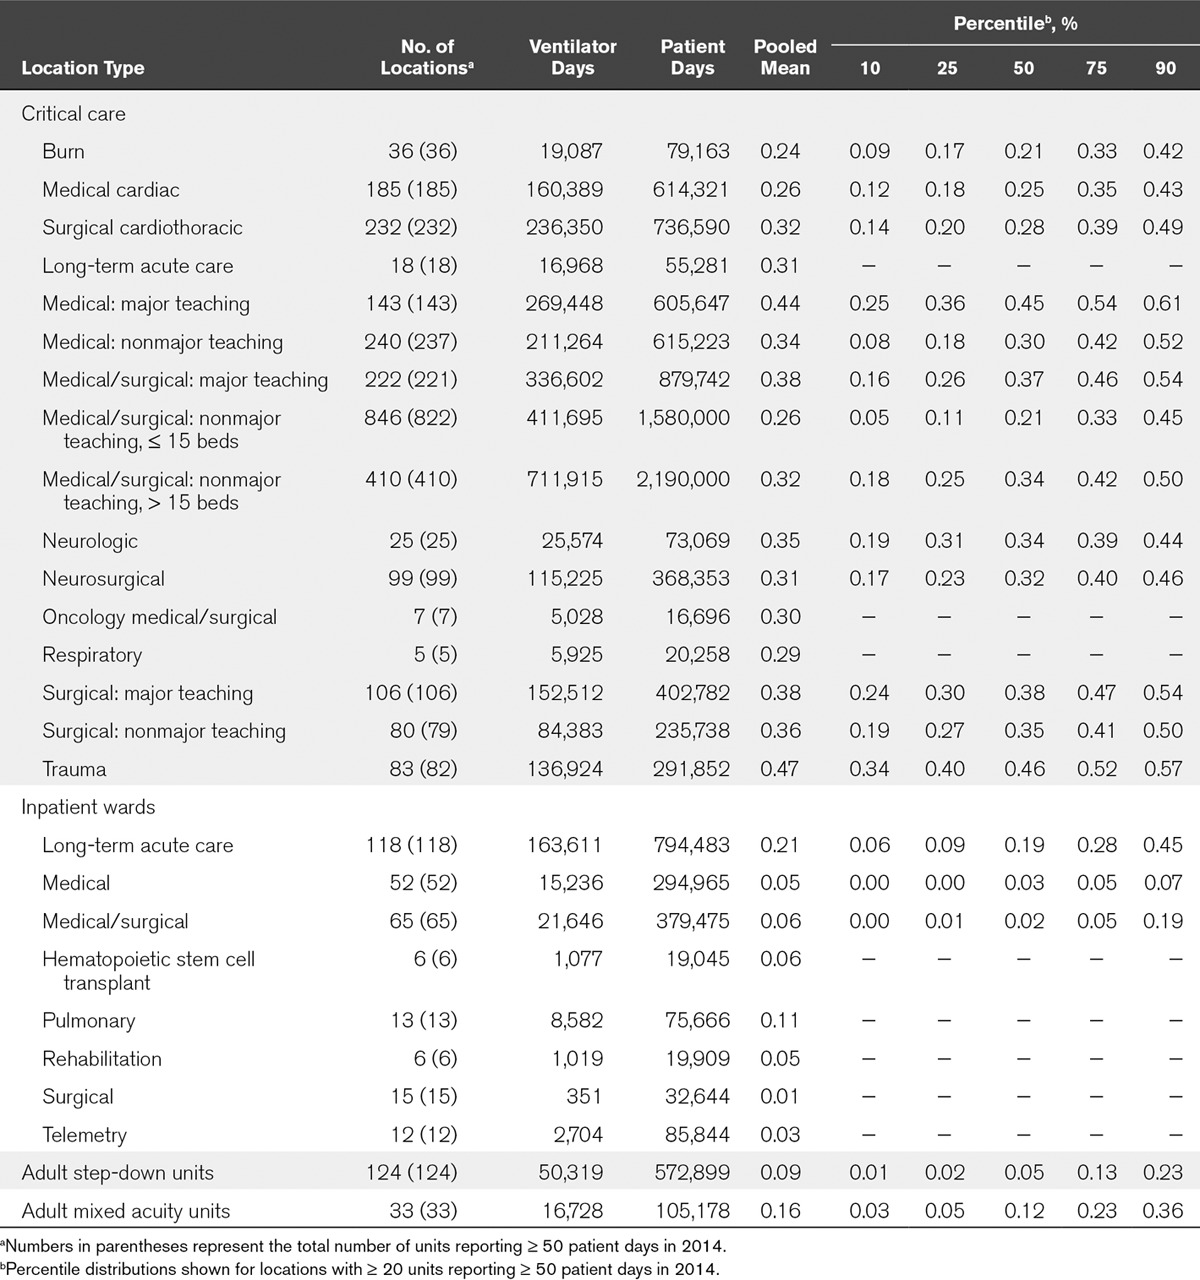
Ventilator utilization also varied widely (Table 4). In critical care units, the pooled mean VUR was highest in trauma (0.47) and lowest in burn critical care units (0.24). Not surprisingly, pooled mean VURs were lower in noncritical care locations, ranging from 0.01 in surgical wards to 0.21 in LTACH wards.
TABLE 4.
Ventilator Utilization Ratios, by Healthcare Facility Location Type, 2014
Event Characteristics
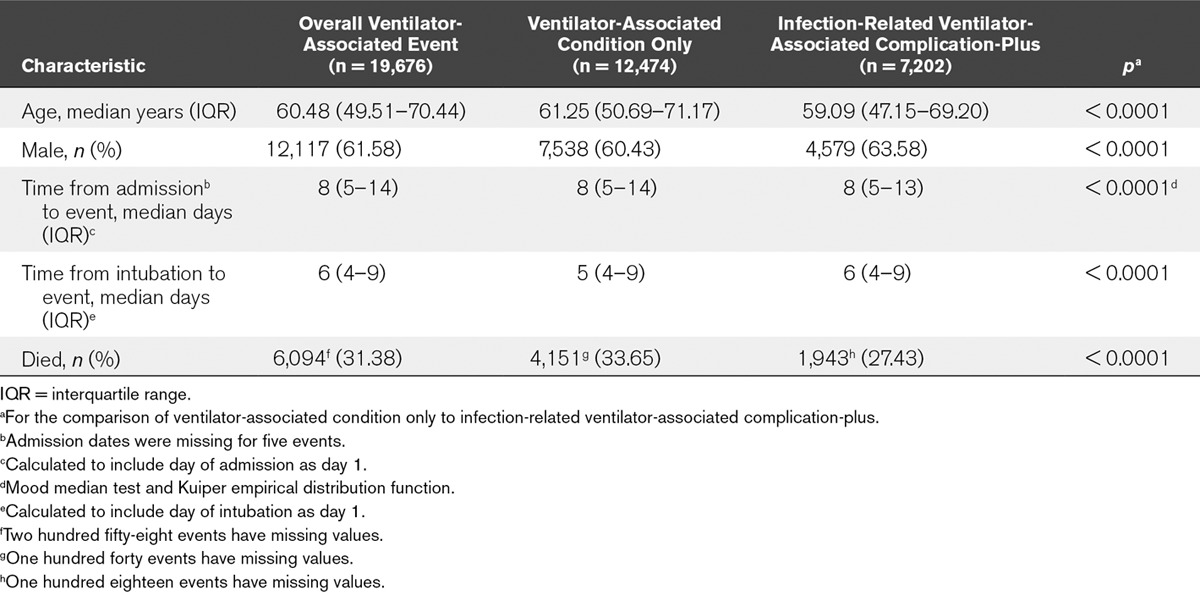
Of 19,714 VAEs, 19,689 were from location types with greater than or equal to five units reporting data and 25 were from location types with less than five units reporting data. Thirty-eight events were excluded because of errors in reported mechanical ventilation initiation or event dates. Among the remaining 19,676 VAEs, 12,474 (63.4%) were VACs, 4,002 (20.3%) were IVACs, and 3,200 (16.3%) were PoVAPs or PrVAPs.
Mortality among patients with VAEs was high, with approximately 31% dying during their hospitalizations (Table 5). Patients with VAC only were significantly older, less likely to be male and more likely to die during their hospitalizations than patients with IVAC-plus. Patients with VAC only tended to have event onset dates earlier in mechanical ventilation than patients with IVAC-plus. Approximately 36% of VAEs had onset dates on days 3 or 4 of mechanical ventilation. Overall, 15,458 VAEs (78.6%) had onset dates on or after ventilator day or hospital day 5.
TABLE 5.
Characteristics of Patients With Ventilator-Associated Events, 2014
Among the 3,200 PoVAP and PrVAP events, 3,151 pathogens were reported for 2,517 events (78.7%). Common pathogens were S. aureus (892; 28.3%), Pseudomonas aeruginosa (412; 13.1%), Klebsiella pneumoniae (249; 7.9%), Escherichia coli (188; 6.0%), and untypeable Haemophilus influenzae (147; 4.7%). Among 826 tested S. aureus isolates, 308 (37.3%) were reported to be MRSA. Among 331 tested P. aeruginosa isolates, 103 (31.1%) were reported to be carbapenem resistant. Among 171 tested K. pneumoniae and 142 tested E. coli isolates, 24 (14.0%) and 0, respectively, were reported to be carbapenem resistant.
DISCUSSION
This is the first national report of VAE rates and characteristics. VAE incidence, proportions of VAEs defined as infection-related, and ventilator utilization varied within and among inpatient location types. Furthermore, VAEs occurred in patients with substantial inpatient mortality. The pathogen profile of VAEs defined as PoVAP or PrVAP was similar to previously reported traditional VAP pathogen profiles. Methicillin resistance among VAE S. aureus isolates was lower than previously reported for VAP (https://shea.confex.com/shea/2011/webprogram/Paper4109.html), and carbapenem resistance in selected Gram-negative pathogens was high: 31% in P. aeruginosa and 14% in K. pneumoniae. We did not determine whether laboratories were using revised carbapenem breakpoints for Enterobacteriaceae.
Studies have shown that most VAEs are due to pneumonia, pulmonary edema, atelectasis, and acute respiratory distress syndrome (7, 9, 10). Data suggest that some of these conditions may be prevented (11, 12), so it stands to reason that VAEs may also be prevented. Still, there is a paucity of published evidence establishing VAE preventability. This is VAE’s most important limitation, and additional studies are needed. Boyer et al (7) evaluated 67 events meeting modified VAE definitions and found that most were due to the conditions above; 25 (37.3%) were deemed preventable. In a matched case-control analysis, Lewis et al (13) identified care-related factors associated with VAC, including positive fluid balance and mandatory mechanical ventilation modes, and with IVAC, including receipt of benzodiazepines before intubation. Multiple recent studies have evaluated approaches to preventing VAEs, some with promising results. In two of these (14, 15), VAC and IVAC definitions were retrospectively applied to patients in the study datasets to evaluate the impact of the intervention on VAE rates. Analysis of data from a study of the impact of adherence to VAP prevention guidelines on VAP rates in Canadian ICUs showed that increased adherence was associated with lower VAC but not lower IVAC rates (14). Analysis of data from a multicenter clinical trial of a β-type natriuretic peptide-driven fluid management strategy to prevent VAP showed that VAP and VAC occurred less frequently among patients randomized to the fluid management strategy (15). Another study, the CDC Prevention Epicenters’ Wake Up and Breathe Collaborative (16), evaluated the preventability of VAEs through improving compliance with daily, paired spontaneous awakening and breathing trials (SATs and SBTs). This study showed that increases in SAT and SBT performance were associated with a decrease in the risk of overall VAE (odds ratio [OR], 0.63; 95% CI, 0.42–0.97) and IVAC (OR, 0.35; 95% CI, 0.17–0.71) per episode of mechanical ventilation (16). Notably, no change in VAE risk was observed when data were analyzed per ventilator day, possibly because the intervention successfully reduced patients’ exposure to mechanical ventilation (16). These findings led CDC to make an optional VAE denominator—episodes of mechanical ventilation—available for NHSN users to report beginning in 2015 (17). Although these studies suggest that VAEs are preventable, investigators for a single-center clinical trial of subglottic suctioning for prevention of VAP retrospectively applied the VAC and IVAC definitions to study subjects and found no difference in VAC or IVAC prevalence in the study groups (18). More work is needed to determine the extent to which VAEs can be prevented through implementation of evidence-based practices that reduce the occurrence of clinical events most commonly associated with VAEs. This is particularly important because VAE is now included in the Centers for Medicare & Medicaid Services Long Term Care Hospital Quality Reporting Program (http://www.cdc.gov/nhsn/pdfs/cms/ltac/ltch_vae_guidance.pdf).
A limitation of surveillance definitions in general, including VAE, is that because they rely on criteria that are objective and feasible to assess across healthcare facilities, they are imperfect proxies for the clinical conditions they attempt to identify. In one study, 12% of VACs and 6% of IVACs had no associated clinical condition (19), whereas in another, 31% of VACs had no discernible cause identified in the medical record, although some of these patients were being treated with antimicrobial drugs and/or furosemide around the time of the VAC (9). NHSN users have expressed concerns that because VAE definitions are met through sustained increases in positive end-expiratory pressure (PEEP) or Fio2 ventilator settings, patients can have VAEs without corresponding clinically important events, particularly in instances in which the PEEP has been increased to allow for a concomitant Fio2 reduction. We are exploring modifications to the definitions that address this issue. Users may also object when an event meeting the VAC definition goes on to meet IVAC because of a change in antimicrobial treatment from a broad-spectrum regimen to one that is appropriately tailored to the results of diagnostic testing. In these cases, we have instructed users that an IVAC is not a worse or more serious surveillance event than a VAC—it merely identifies the VAE as one that is potentially infectious in nature. Presumably, the antimicrobial regimen change occurred because the providers believed that they were treating an infection, and so reporting the event as an IVAC rather than a VAC is appropriate and in keeping with the intent of the definitions. Modifications could be considered to allow users to enter data into NHSN about the antimicrobial treatment that led to an IVAC determination, to inform antimicrobial stewardship activities. Indeed, French investigators who evaluated 3,028 ICU patients for modified VAC and IVAC events found that VAC and IVAC rates were highly correlated with antibiotic use (20).
We have presented VAE rate data in various inpatient location type strata, similar to the approach utilized for reporting other NHSN device-associated event rates (8). In the future, it will be important to consider whether patient-level complexity and severity of illness indicators can be incorporated into NHSN. Although collecting and reporting such indicators could mean additional burden on the NHSN user, maximizing opportunities to automate data collection from electronic health records (EHR) can mitigate this burden, and such information may improve risk adjustment, the validity of VAE rate comparisons, and the usefulness of the data for improving patient safety.
In addition, as more facilities develop approaches to electronically detect VAEs, it is critical for CDC to continue to provide guidance and a means of validating electronic methods to ensure NHSN data quality. Investigators have shown that VAE detection is susceptible to seemingly minor differences in the implementation of electronic algorithms (19). CDC continues to develop tools for healthcare facilities and EHR vendors to use in validating their own electronic VAE algorithms (21).
Despite its limitations, studies have already demonstrated that VAE surveillance offers significant benefits, including the reliability of the definitions and their potential to be automated and to reduce surveillance burden. Nuckchady et al (22) compared automated surveillance for VAC and potential IVAC to manual VAE surveillance and found that the sensitivity, specificity, and positive and negative predictive values of the automated method exceeded 93%. The investigators also found that over a 6-month period, use of the automated method saved 94 hours of staff time when compared with the time required for manual surveillance. Similarly, Mann et al (23) found that when compared with intensivist medical record review, an automated method to identify VACs had 100% sensitivity, specificity, and positive and negative predictive values and was time efficient. However, manual VAE surveillance performed by other hospital staff (infection preventionists and an infection control fellow) in this same study was time-consuming and missed a substantial number of VACs (23). Although there was variability in VAC detection by these staff members, interobserver agreement as measured by the κ statistic still exceeded 0.6. Unlike the variability in VAP detection using traditional surveillance definitions, which typically arose from differences in the assessments of subjective definition criteria and was difficult to resolve, the variability in VAE detection in the Mann et al (23) study was due to readily correctable errors in applying VAC criteria. McMullen et al (24) also reported good agreement when comparing a strategy of automated VAC and IVAC detection plus manual chart review by infection preventionists for PVAPs to an approach using prospective, manual VAE surveillance by pulmonary physicians and critical care unit staff (κ, 0.81). This is better agreement than has been reported previously for traditional VAP surveillance definitions (25, 26).
CONCLUSIONS
There is an increasing need for objective, practical approaches to national HAI surveillance that facilitate valid comparisons among facilities and that lead to healthcare quality improvement. It seems likely, then, that the healthcare-associated event surveillance of the future will increasingly involve automated, electronic detection and reporting of measures that are proxies for clinical events rather than measures that hew to diagnostic approaches at the bedside, which are often too complex and subjective to be used in national surveillance. VAE surveillance is a step in that direction.
Supplementary Material
Footnotes
*See also p. 2280.
Prior presentation: The analysis described herein was presented in part in abstract form at IDWeek 2014, Philadelphia, PA, and IDWeek 2015, San Diego, CA.
Disclaimer: The findings and conclusions in this report are those of the authors and do not necessarily represent the official position of the Centers for Disease Control and Prevention.
Supplemental digital content is available for this article. Direct URL citations appear in the printed text and are provided in the HTML and PDF versions of this article on the journal’s website (http://journals.lww.com/ccmjournal).
Supported by the Centers for Disease Control and Prevention.
Dr. Magill, Ms. Li, Ms. Gross, Ms. Dudeck, Ms. Allen-Bridson, and Mr. Edwards disclosed government work.
REFERENCES
- 1.Klompas M. Does this patient have ventilator-associated pneumonia? JAMA. 2007;297:1583–1593. doi: 10.1001/jama.297.14.1583. [DOI] [PubMed] [Google Scholar]
- 2.Ego A, Preiser JC, Vincent JL. Impact of diagnostic criteria on the incidence of ventilator-associated pneumonia. Chest. 2015;147:347–355. doi: 10.1378/chest.14-0610. [DOI] [PubMed] [Google Scholar]
- 3.Magill SS, Klompas M, Balk R, et al. Developing a new, national approach to surveillance for ventilator-associated events. Crit Care Med. 2013;41:2467–2475. doi: 10.1097/CCM.0b013e3182a262db. [DOI] [PMC free article] [PubMed] [Google Scholar]
- 4.Chang HC, Chen CM, Kung SC, et al. Differences between novel and conventional surveillance paradigms of ventilator-associated pneumonia. Am J Infect Control. 2015;43:133–136. doi: 10.1016/j.ajic.2014.10.029. [DOI] [PubMed] [Google Scholar]
- 5.Lilly CM, Landry KE, Sood RN, et al. UMass Memorial Critical Care Operations Group; UMass Memorial Critical Care Operations Group. Prevalence and test characteristics of national health safety network ventilator-associated events. Crit Care Med. 2014;42:2019–2028. doi: 10.1097/CCM.0000000000000396. [DOI] [PubMed] [Google Scholar]
- 6.Stevens JP, Silva G, Gillis J, et al. Automated surveillance for ventilator-associated events. Chest. 2014;146:1612–1618. doi: 10.1378/chest.13-2255. [DOI] [PMC free article] [PubMed] [Google Scholar]
- 7.Boyer AF, Schoenberg N, Babcock H, et al. A prospective evaluation of ventilator-associated conditions and infection-related ventilator-associated conditions. Chest. 2015;147:68–81. doi: 10.1378/chest.14-0544. [DOI] [PubMed] [Google Scholar]
- 8.Dudeck MA, Edwards JR, Allen-Bridson K, et al. National Healthcare Safety Network report, data summary for 2013, Device-associated Module. Am J Infect Control. 2015;43:206–221. doi: 10.1016/j.ajic.2014.11.014. [DOI] [PMC free article] [PubMed] [Google Scholar]
- 9.Klompas M, Khan Y, Kleinman K, et al. CDC Prevention Epicenters Program. Multicenter evaluation of a novel surveillance paradigm for complications of mechanical ventilation. PLoS One. 2011;6:e18062. doi: 10.1371/journal.pone.0018062. [DOI] [PMC free article] [PubMed] [Google Scholar]
- 10.Hayashi Y, Morisawa K, Klompas M, et al. Toward improved surveillance: The impact of ventilator-associated complications on length of stay and antibiotic use in patients in intensive care units. Clin Infect Dis. 2013;56:471–477. doi: 10.1093/cid/cis926. [DOI] [PubMed] [Google Scholar]
- 11.Serpa Neto A, Cardoso SO, Manetta JA, et al. Association between use of lung-protective ventilation with lower tidal volumes and clinical outcomes among patients without acute respiratory distress syndrome: A meta-analysis. JAMA. 2012;308:1651–1659. doi: 10.1001/jama.2012.13730. [DOI] [PubMed] [Google Scholar]
- 12.Neto AS, Simonis FD, Barbas CS, et al. PROtective Ventilation Network Investigators. Lung-protective ventilation with low tidal volumes and the occurrence of pulmonary complications in patients without acute respiratory distress syndrome: A systematic review and individual patient data analysis. Crit Care Med. 2015;43:2155–2163. doi: 10.1097/CCM.0000000000001189. [DOI] [PubMed] [Google Scholar]
- 13.Lewis SC, Li L, Murphy MV, et al. CDC Prevention Epicenters. Risk factors for ventilator-associated events: A case-control multivariable analysis. Crit Care Med. 2014;42:1839–1848. doi: 10.1097/CCM.0000000000000338. [DOI] [PMC free article] [PubMed] [Google Scholar]
- 14.Muscedere J, Sinuff T, Heyland DK, et al. Canadian Critical Care Trials Group. The clinical impact and preventability of ventilator-associated conditions in critically ill patients who are mechanically ventilated. Chest. 2013;144:1453–1460. doi: 10.1378/chest.13-0853. [DOI] [PubMed] [Google Scholar]
- 15.Mekontso Dessap A, Katsahian S, Roche-Campo F, et al. Ventilator-associated pneumonia during weaning from mechanical ventilation: Role of fluid management. Chest. 2014;146:58–65. doi: 10.1378/chest.13-2564. [DOI] [PubMed] [Google Scholar]
- 16.Klompas M, Anderson D, Trick W, et al. CDC Prevention Epicenters. The preventability of ventilator-associated events. The CDC Prevention Epicenters Wake Up and Breathe Collaborative. Am J Respir Crit Care Med. 2015;191:292–301. doi: 10.1164/rccm.201407-1394OC. [DOI] [PMC free article] [PubMed] [Google Scholar]
- 17.Centers for Disease Control and Prevention. Ventilator-Associated Event. April 2015 Version. Available at: http://www.cdc.gov/nhsn/pdfs/pscmanual/10-vae_final.pdf. Accessed August 24, 2015.
- 18.Damas P, Frippiat F, Ancion A, et al. Prevention of ventilator-associated pneumonia and ventilator-associated conditions: A randomized controlled trial with subglottic secretion suctioning. Crit Care Med. 2015;43:22–30. doi: 10.1097/CCM.0000000000000674. [DOI] [PubMed] [Google Scholar]
- 19.Klein Klouwenberg PM, van Mourik MS, Ong DS, et al. MARS Consortium. Electronic implementation of a novel surveillance paradigm for ventilator-associated events. Feasibility and validation. Am J Respir Crit Care Med. 2014;189:947–955. doi: 10.1164/rccm.201307-1376OC. [DOI] [PubMed] [Google Scholar]
- 20.Bouadma L, Sonneville R, Garrouste-Orgeas M, et al. OUTCOMEREA Study Group. Ventilator-associated events: Prevalence, outcome, and relationship with ventilator-associated pneumonia. Crit Care Med. 2015;43:1798–1806. doi: 10.1097/CCM.0000000000001091. [DOI] [PubMed] [Google Scholar]
- 21.Magill SS, Rhodes B, Klompas M. Improving ventilator-associated event surveillance in the National Healthcare Safety Network and addressing knowledge gaps: Update and review. Curr Opin Infect Dis. 2014;27:394–400. doi: 10.1097/QCO.0000000000000083. [DOI] [PMC free article] [PubMed] [Google Scholar]
- 22.Nuckchady D, Heckman MG, Diehl NN, et al. Assessment of an automated surveillance system for detection of initial ventilator-associated events. Am J Infect Control. 2015;43:1119–1121. doi: 10.1016/j.ajic.2015.05.040. [DOI] [PubMed] [Google Scholar]
- 23.Mann T, Ellsworth J, Huda N, et al. Building and validating a computerized algorithm for surveillance of ventilator-associated events. Infect Control Hosp Epidemiol. 2015;36:999–1003. doi: 10.1017/ice.2015.127. [DOI] [PubMed] [Google Scholar]
- 24.McMullen KM, Boyer AF, Schoenberg N, et al. Surveillance versus clinical adjudication: Differences persist with new ventilator-associated event definition. Am J Infect Control. 2015;43:589–591. doi: 10.1016/j.ajic.2015.03.004. [DOI] [PubMed] [Google Scholar]
- 25.Klompas M. Interobserver variability in ventilator-associated pneumonia surveillance. Am J Infect Control. 2010;38:237–239. doi: 10.1016/j.ajic.2009.10.003. [DOI] [PubMed] [Google Scholar]
- 26.Stevens JP, Kachniarz B, Wright SB, et al. When policy gets it right: Variability in U.S. Hospitals’ diagnosis of ventilator-associated pneumonia. Crit Care Med. 2014;42:497–503. doi: 10.1097/CCM.0b013e3182a66903. [DOI] [PubMed] [Google Scholar]


