Abstract
Purpose
To compare radiation machine measurement data collected by the Imaging and Radiation Oncology Core at Houston (IROC-H) with institutional treatment planning system (TPS) values, to identify parameters with large differences in agreement; the findings will help institutions focus their efforts to improve the accuracy of their TPS models.
Methods and Materials
Between 2000 and 2014, IROC-H visited more than 250 institutions and conducted independent measurements of machine dosimetric data points, including percentage depth dose, output factors, off-axis factors, multileaf collimator small fields, and wedge data. We compared these data with the institutional TPS values for the same points by energy, class, and parameter to identify differences and similarities using criteria involving both the medians and standard deviations for Varian linear accelerators. Distributions of differences between machine measurements and institutional TPS values were generated for basic dosimetric parameters.
Results
On average, intensity modulated radiation therapy–style and stereotactic body radiation therapy–style output factors and upper physical wedge output factors were the most problematic. Percentage depth dose, jaw output factors, and enhanced dynamic wedge output factors agreed best between the IROC-H measurements and the TPS values. Although small differences were shown between 2 common TPS systems, neither was superior to the other. Parameter agreement was constant over time from 2000 to 2014.
Conclusions
Differences in basic dosimetric parameters between machine measurements and TPS values vary widely depending on the parameter, although agreement does not seem to vary by TPS and has not changed over time. Intensity modulated radiation therapy–style output factors, stereotactic body radiation therapy–style output factors, and upper physical wedge output factors had the largest disagreement and should be carefully modeled to ensure accuracy.
Introduction
Accurate dosimetry has always been essential in radiation oncology, but challenges remain, even in basic dosimetry agreement between the radiation treatment machine and the treatment planning system (TPS). The percentage of institutions that pass an Imaging and Radiation Oncology Core at Houston (IROC-H) head and neck phantom irradiation has improved over time, but even with relaxed criteria, a relatively large number of institutions still fail to meet the minimum standards (1). Reasons for failure vary, and several TPS factors may be involved (2). Although machine measurement data have been analyzed in numerous studies (3–6), no large-scale, systematic comparison of machine data with TPS data has been done.
In an effort to ensure high-quality radiation therapy for patients in clinical trials, the IROC-H has developed several ways to measure and confirm various aspects of radiation delivery accuracy. One of these is through on-site dosimetry review visits. During an on-site visit, an IROC-H physicist comes to the institution and, among other things, takes independent dosimetry measurements of the linear accelerators. These measured values are compared with those calculated by the institution's TPS to assess how well the institution has modeled basic dosimetry parameters.
The IROC-H measurements correspond with several tests recommended by the American Association of Physicists in Medicine (AAPM)'s Medical Physics Practice Guideline report 5 (MMPG-5) for basic photon validation in TPSs (7). Owing to limitations in the beam modeling and dose calculation algorithm, TPS-calculated doses do not always perfectly agree with measured values. However, for basic photon parameters, the TPS calculated dose and the measured dose should agree to within 2% in the high-dose regions (7). Given that these are calculations of basic photon dosimetry parameters, any disagreement discovered may have an impact on all radiation therapy patients. It is thus of the utmost importance that these basic parameters are modeled well in the TPS. Raising an awareness of TPS dosimetry parameters that have been found to disagree with measurements can help physicists focus their time and energy on verifying those parameters.
The goal of the present study is to compare acquired measurement dosimetry data with the institution's TPS calculation data to determine how institutions are actually faring. Examination of these comparisons can identify common problem areas. Armed with this information, physicists can be more prepared when commissioning a TPS or a new linear accelerator.
Methods and Materials
Data collection
First, measurement values were acquired during an IROC-H on-site dosimetry review visit, in which an IROC-H physicist used their own equipment to make point measurements in a water phantom for simple irradiation geometries. The institution's physicist was always present for data collection. Second, TPS-calculated values were determined by the institution's physicist for the same geometric conditions and points as were measured. This allowed for a direct comparison of institution TPS-calculated values with independent machine measurements. Although institution measurement data were not required, the institution physicist was encouraged to compare their results at the time of acquisition (particularly in cases of disagreement). Any large discrepancies in acquired values were investigated for validity. In the vast majority of cases when institution measurements were compared, IROC-H and the institution's values were similar.
The collection process and geometries of the point measurement data were discussed fully in our prior study (8). In summary, all measurements were taken in a 30 × 30 × 30-cm3 water phantom at a source-to-surface distance of 100 cm. A Standard Imaging Exradin A12 (Standard Imaging, Madison, WI) ion chamber was used for all measurements except small multileaf collimator (MLC) fields that used an Exradin A16 microchamber. The A16 has been shown to be minimally influenced by spectral changes over the range of field sizes measured here (9). Percentage depth dose (PDD) was measured for 3 field sizes: 6 × 6 cm2, 10 × 10 cm2, and 20 × 20 cm2. For each field, a measurement was taken at 5-, 10-, 15-, and 20-cm depth; at 10 × 10 cm2 a dmax measurement was also taken. Output factors were sampled at 6 × 6-, 10 × 10-, 15 × 15-, 20 × 20-, and 30 × 30-cm2 field sizes, all at 10-cm depth and corrected to dmax using the institution's own clinical PDD data. Off-axis measurements were taken at 5, 10, and 15 cm off-axis at dmax in a 40 × 40-cm2 field. Wedge output factors were measured for the 45° and 60° enhanced dynamic wedge (EDW) for a 10 × 10-cm2 field at 10-cm depth; additionally, a 45° EDW measurement was taken in a 15 × 15-cm2 field at 15-cm depth. Two sets of small field MLC output factors were measured, representing fields that may be seen in both intensity modulated radiation therapy (IMRT) and stereotactic body radiation therapy (SBRT), called “IMRT-style” and “SBRT-style” output factors, respectively. The IMRT-style fields were measured by fixing the jaws at 10 × 10 cm and varying the MLC field size to 6 × 6 cm2, 4 × 4 cm2, 3 × 3 cm2, and 2 × 2 cm2, representing various possible segment sizes. Measurements were normalized to an open 10 × 10 cm2 field. The SBRT-style measurements were taken using the same field sizes as for IMRT, but both jaws and MLCs were moved to the same position for each given field size.
Measurements were taken at all points described at all photon energies commissioned by the institution. Although more photon energies exist, the most common energies of 6, 10, 15, and 18 MV are presented.
Data analysis
The goal of our analysis was to determine where institutional TPS calculated dosimetry data commonly agreed or disagreed with the measured data, and where agreement varied widely. In a prior study, analysis of IROC-H data collected between 2000 and 2014 for Varian machines resulted in the establishment of a number of machine classes. These classes were a result of clinical and statistical criterion to determine and consolidate those machine models that were dosimetrically equivalent (8). At each energy, the class that represented the most machine models was called the “base class”; for example, at 6 MV this class represented the 21/23EX, 21/23iX, and Trilogy platforms. Although each institution's machine measurement value was compared with the institution TPS calculation value, the resulting ratios were binned according to the machine class.
Measured data were compared with TPS values by dividing the IROC-H measurement by the institutional TPS calculation at a given point, thus providing a ratio. This was done for every measurement point, machine, energy, and institution; more than 250 institutions and 500 machines were measured and compared. Two additional comparisons were done by separating results by TPS and by agreement over time. For the TPS comparison measurements of the base class, the most populous class, were separated according to the institution's TPS. Sufficient data existed only to compare Pinnacle and Eclipse TPSs. To examine the agreement of parameters over time, we binned data from the base class into 3 time periods according to the site visit date: 2000 to 2005, 2006 to 2010, and 2011 to 2014.
Two sets of criteria were used to identify troublesome parameters. First, for each energy and class dataset, median values for a given parameter were tested for statistically and clinically significant differences from unity. That is, we tested whether any parameters had a systematic bias between the measured and calculated values. Statistical significance was measured using a Wilcoxon rank-sum test against the null hypothesis of unity (α = 0.05). For clinical significance, a median value greater than 1% different from unity was deemed significant. Because of the large number of measurements, statistical significance was extremely easy to achieve, and nearly all parameters reached significance, even for very small distances from unity. Thus, clinical significance became the dominant watershed for median comparison. Distribution differences that were statistically and clinically significant were thought to represent parameters that TPSs systematically did not model well.
The second criterion indicating a troublesome parameter was a ratio distribution with a standard deviation greater than 1%. Distributions with a large standard deviation, even when the median was close to unity, were thought to represent parameters that had a wide range of modeling discrepancies and no common agreement among institutions; as such, these parameters were considered poorly modeled or challenging to model.
Results
Class comparison
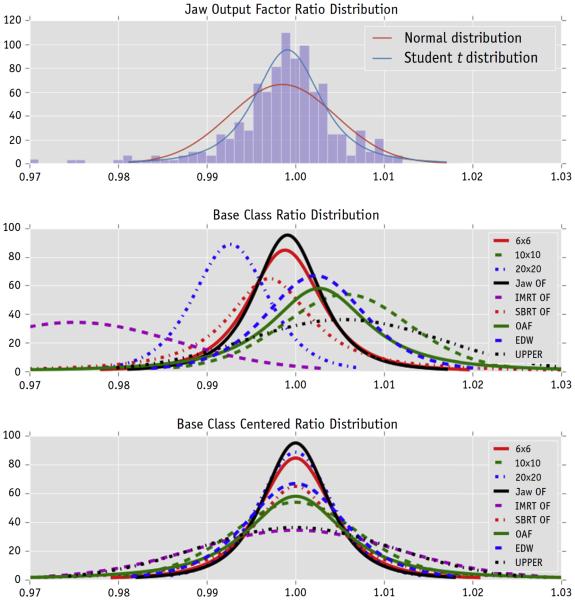
Figure 1 presents the fitted distribution density of dosimetric parameters (ratio of measurement to TPS value) for the 6-MV base class accelerator. The top plot shows a histogram of the base class jaw output factor ratios, along with a fitted normal and Student t distribution. A Kolmogorov-Smirnov goodness-of-fit test rejected the null hypothesis that the data were described by a normal distribution (α = 0.05) but could not reject the Student t distribution. The Student t distribution was then used to represent a parameter's data for Figure 1. The middle plot shows the distributions centered at the median measurement value, and the bottom plot shows the same distributions centered about unity to visualize distribution width. Although there are several distributions for each parameter (eg, for a given PDD there is a distribution at each of the evaluation depths, aka subparameter: 5, 10, 15, and 20 cm), only the distribution from the worst-performing subparameter is shown. Thus if the 5-cm depth distribution was the worst-performing subparameter for 6 × 6 cm2, it was the distribution plotted. This approach was more conservative than grouping all subparameter measurements together, which may wash out differences, and was more consistent with the MPPG-5 criteria of individual point comparison (7). Systematic offsets in the measurement to TPS ratio can be seen in the middle panel, particularly for the IMRT-style output factors, in which the TPS systematically overestimated the output compared with the measurement. Although the upper physical wedge output factors were also notably offset from unity, the median fell just within the 1% criteria. Other parameters typically had measurement to TPS ratios that were centered close to unity. The bottom plot shows that the IMRT-style output factors and the upper physical wedge output factors had the widest distributions, with >1% standard deviation. The off-axis factors also showed a relatively wide distribution, although these fell just within the 1% criteria. The jaw output, EDW, and PDD distributions were relatively tight.
Fig. 1.
Density distributions of the ratio of machine measurement to TPS-calculated values. The top plot is a histogram of the base class jaw output factor ratios along with a fitted normal and Student t distribution. The lower two plots show fitted Student t distributions of all the parameters of the base class of accelerator. Distributions in the middle plot are centered about the median measurement value, whereas those in the bottom plot are centered about unity for visual comparison of the distribution spread. The 6 × 6-, 10 × 10-, and 20 × 20-cm2 lines represent the field size for percentage depth dose measurements. Abbreviations: EDW = enhanced dynamic wedge; IMRT = intensity modulated radiation therapy; OAF = off-axis factor; OF = output factor; SBRT = stereotactic body radiation therapy.
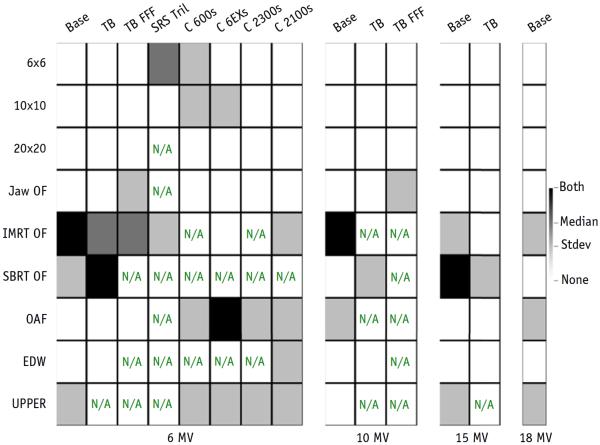
The analysis of Figure 1 was generalized for all classes to produce a heat map, shown in Figure 2. Shaded boxes represent parameters that were identified as problematic, either because of a median difference (dark shading) or a standard deviation greater than the specified criteria (light shading). Black boxes indicate that both the median and standard deviation were beyond our criteria. As in Figure 1, each parameter's worst-performing subparameter distribution was chosen for analysis. The results from Figure 1 can be seen in the base class column in Figure 2: the upper physical wedge output factors and SBRT-style output factors had high standard deviations (gray boxes), and the IMRT-style output factors had high standard deviations and a systematic median offset (black boxes).
Fig. 2.
A heat map of differences between treatment planning system values and machine measurements, broken down by machine class. Shaded boxes represent distributions that had a median or standard deviation (or both) greater than the criteria described in the text. Median differences are shaded darker than high standard deviations only for visualization purposes. N/A=not enough data were available for comparison. 6 × 6, 10 × 10, and 20 × 20 cm2 represent the field size for percentage depth dose measurements. Abbreviations: EDW = enhanced dynamic wedge; IMRT = intensity modulated radiation therapy; OAF = off-axis factor; OF = output factor; SBRT = stereotactic body radiation therapy.
As can be seen in Figure 2, no class of accelerator was free from challenging parameters. Most of these challenging parameters were identified by the standard deviation criterion, and a handful had problematic median differences or both problematic standard deviations and problematic median differences. The 10-, 15-, and 18-MV energies performed similarly; most troublesome parameters were consistent across energies. However, this was not universally true. For the base class of accelerators, SBRT-style output factors ranged from thorough agreement at 10 and 18 MV to thorough disagreement at 15 MV.
In general, the worst-performing parameters were IMRT-style output factors, SBRT-style output factors, and upper physical wedge output factors, and the best-performing parameters were PDD, EDW, and jaw output factors.
TPS comparison
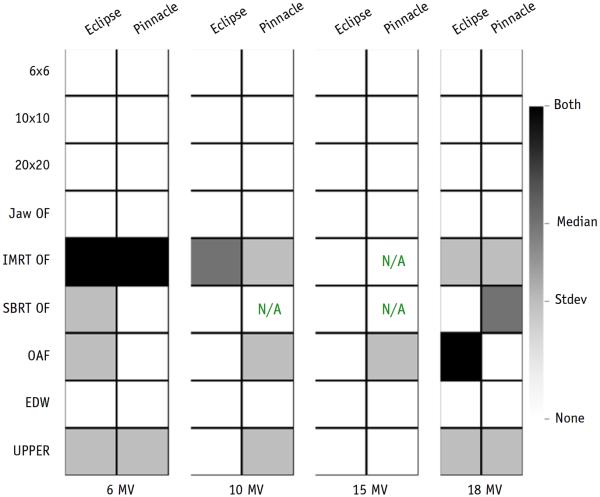
To determine the effect of the TPS used on measurement to TPS agreement, the machines of the base class of accelerator (EX, iX, Trilogy) were split according to the institution's reported TPS. Figure 3 shows the results of the analysis for the Eclipse and Pinnacle TPSs. Although other TPSs have been recorded, these TPSs account for the vast majority used clinically. These results show similar but not identical problems between the TPSs. Eclipse data showed larger standard deviations than Pinnacle data for several 6-MV parameters, whereas Pinnacle had more troublesome parameters than Eclipse data at 10 and 15 MV. Both TPSs accurately modeled PDD, EDW, and jaw output factors and had trouble modeling the IMRT-style output factors at 6, 10, and 18 MV.
Fig. 3.
Ratios of machine measurement and treatment planning system–calculated values broken down by treatment planning system and energy. 6 × 6, 10 × 10, and 20 × 20 cm2 represent the field size for percentage depth dose measurements. Abbreviations: EDW = enhanced dynamic wedge; IMRT = intensity modulated radiation therapy; OAF = off-axis factor; OF = output factor; SBRT = stereotactic body radiation therapy.
Time period comparison
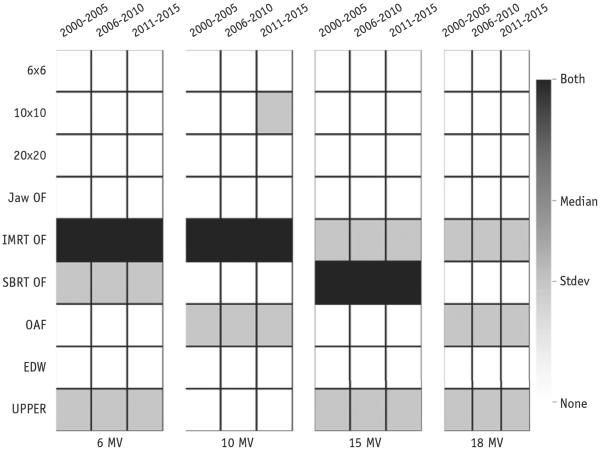
Figure 4 shows the measurement to TPS ratios for the base class of accelerators according to the time period of the site visit. The data clearly show that the parameters with the worst agreement have always had the worst agreement, and agreement has not improved with time; only agreement for the 10-MV 10 × 10 cm2 PDD distribution has changed since 2000, and it got worse.
Fig. 4.
Ratios of machine measurement and treatment planning system–calculated values broken down by energy and time period of the site visit. 6 × 6, 10 × 10, and 20 × 20 cm2 represent the field size for percentage depth dose measurements. Abbreviations: EDW = enhanced dynamic wedge; IMRT = intensity modulated radiation therapy; OAF = off-axis factor; OF = output factor; SBRT = stereotactic body radiation therapy.
Discussion
Our study highlights areas of common agreement and disagreement between linear accelerator measurements and TPS calculated values. Percentage depth dose and jaw output factors nearly always showed good agreement, but IMRT- and SBRT-style output factors and upper physical wedge output factors generally did not show good agreement. Although some of these results may not be surprising, given that institutions have long reported various disagreements between measurements and TPS values (10, 11), our findings more specifically characterize the disagreements (ie, whether the disagreement is systematic [large median difference from unity] or represents a wide range of disagreement [large standard deviation]).
We found the most pronounced disagreements for the IMRT-style and SBRT-style small field output factors. The measured 6-MV IMRT-style output factor values in particular were consistently lower than the TPS values, having an average discrepancy of 1.6% across all field sizes, with 64% of measurements having a discrepancy >1%. For SBRT-style output factors the results were slightly better, with an average discrepancy at 6 MV of 0.5%, and 38% of measurements having a >1% discrepancy. These numbers contrast sharply with the average of all parameters. Over all measured parameters, the average discrepancy between TPS and measurement was only 0.36%, with 21% of measurements having a >1% difference.
Upper physical wedge distributions nearly always had a large standard deviation across all energies, whereas EDW distributions nearly always had good agreement. Because EDW output factors are based on open field measurements, the agreement is not surprising. Physical wedge output factors require more input from the physicist; additionally, because physical wedge output factors are less commonly used in the era of IMRT, the physicist may not commit as much time to modeling. Of note, IROC-H evaluations are performed along the central axis only; off-axis wedge values may disagree even more. Implementing EDWs in place of physical wedges would reduce the chance of dosimetric error.
Although we observed some differences between the Eclipse and Pinnacle TPSs (Fig. 3), neither TPS outperformed the other across all energies. Our analysis did not take into account the TPS version number, and it is possible that stronger differences are present for specific TPS versions.
Perhaps most notable of our findings is the consistency of distributions across time. Parameters that were problematic a decade ago are still problematic. The data may be influenced by institutions that initially commissioned their TPS and never adjusted it for new machines or TPS versions. Still, physicists continue to struggle to accurately model their machines despite advances in accelerator manufacturing technology and TPS modeling. The lack of improvement in TPS agreement is most concerning because new radiation therapy techniques, such as stereotactic radiosurgery and volumetric modulated arc therapy, have become more common. These techniques generally require higher levels of TPS accuracy, especially for small fields. Therefore, physicists commissioning or adjusting a TPS model should seriously investigate the differences between their TPS and machine.
Given the tolerances of the AAPM MPPG-5 report (7), most institutions are in compliance for most basic dosimetric parameters. However, the tolerances given in the AAPM report are intended to be the maximum allowable difference between measurements and TPS values. A few parameters approach or exceed these tolerances, even on average, and physicists should carefully review these parameters. The systematic disagreements are due at least in large part to TPS physics modeling limitations. Improperly measured input data may also be a factor, although IROC-H experience has found that institutional measurements tend to be very similar to IROC-H measured data. The results presented here can be used as a guide to identify parameters that should be given more time and attention.
Ultimately, we cannot make sweeping conclusions about why a measured parameter has poor agreement with the TPS model because there could be numerous reasons, including data collection, beam modeling, and TPS limitations. Our data suggest that physicists should spend additional time examining the problem parameters of their machine, according to its machine class. However, no matter which machine an institution has, IMRT- and SBRT-style output factors and upper physical wedge output factors should be carefully modeled. Future research would include determining nondosimetric TPS settings that may influence model agreement, as well as whether institutions show improvement with multiple visits.
Conclusion
This study examined the agreement between radiation machine measurement and TPS values for basic dosimetric parameters. Parameters that disagreed between measurement and TPS value were highlighted by machine class. Small differences were found between TPSs, but neither TPS examined uniformly outperformed the other. Agreement was also found not to change with time; problem parameters have always, and continue to be, problem parameters.
Acknowledgments
The authors thank Paul Hougin for querying and compiling the site visit data.
This work was supported by Public Health Service Grant CA180803 awarded by the National Cancer Institute, US Department of Health and Human Services.
Footnotes
Conflict of interest: none.
References
- 1.Molineu A, Hernandez N, Nguyen T, et al. Credentialing results from IMRT irradiations of an anthropomorphic head and neck phantom. Med Phys. 2013;40:022101. doi: 10.1118/1.4773309. [DOI] [PMC free article] [PubMed] [Google Scholar]
- 2.Nelms BE, Zhen H, Tome WA. Per-beam, planar IMRT QA passing rates do not predict clinically relevant patient dose errors. Med Phys. 2011;38:1037–1044. doi: 10.1118/1.3544657. [DOI] [PMC free article] [PubMed] [Google Scholar]
- 3.Glide-Hurst C, Bellon M, Foster R, et al. Commissioning of the Varian TrueBeam linear accelerator: A multi-institutional study. Med Phys. 2013;40:031719. doi: 10.1118/1.4790563. [DOI] [PubMed] [Google Scholar]
- 4.Fontenla DP, Napoli JJ, Chui CS. Beam characteristics of a new model of 6-MV linear accelerator. Med Phys. 1992;19:343–349. doi: 10.1118/1.596864. [DOI] [PubMed] [Google Scholar]
- 5.Chang Z, Wu Q, Adamson J, et al. Commissioning and dosimetric characteristics of TrueBeam system: Composite data of three TrueBeam machines. Med Phys. 2012;39:6981–7018. doi: 10.1118/1.4762682. [DOI] [PubMed] [Google Scholar]
- 6.Watts RJ. Comparative measurements on a series of accelerators by the same vendor. Med Phys. 1999;26:2581–2585. doi: 10.1118/1.598796. [DOI] [PubMed] [Google Scholar]
- 7.Smilowitz JB, Das IJ, Feygelman V, et al. AAPM Medical Physics Practice Guideline 5.a.: Commissioning and QA of Treatment Planning Dose Calculations–Megavoltage Photon and Electron Beams. J Appl Clin Med Phys. 2015;16:5768. doi: 10.1120/jacmp.v16i5.5768. [DOI] [PMC free article] [PubMed] [Google Scholar]
- 8.Kerns J, Followill D, Lowenstein J, et al. Technical Report: Reference photon dosimetry data for Varian accelerators based on IROC-Houston site visit data. Med Phys. 2016;43:2374–2386. doi: 10.1118/1.4945697. [DOI] [PMC free article] [PubMed] [Google Scholar]
- 9.Francescon P, Cora S, Satariano N. Calculation of k(Q(clin),Q(msr)) (f(clin),f(msr)) for several small detectors and for two linear accelerators using Monte Carlo simulations. Med Phys. 2011;38:6513–6527. doi: 10.1118/1.3660770. [DOI] [PubMed] [Google Scholar]
- 10.Followill DS, Kry SF, Qin L, et al. The Radiological Physics Center's standard dataset for small field size output factors. J Appl Clin Med Phys. 2012;13:3962. doi: 10.1120/jacmp.v13i5.3962. Erratum: J Appl Clin Med Phys. 2014;15(2):4757. [DOI] [PMC free article] [PubMed] [Google Scholar]
- 11.Ezzell GA, Burmeister JW, Dogan N, et al. IMRT commissioning: Multiple institution planning and dosimetry comparisons, a report from AAPM Task Group 119. Med Phys. 2009;36:5359–5373. doi: 10.1118/1.3238104. [DOI] [PubMed] [Google Scholar]


