

Abstract
There is a high incidence of vestibular loss in children with cochlear implants (CCI). However, the relationship between vestibular loss and various outcomes is unknown in children.
Objectives
1) determine if age-related changes in peripheral vestibular tests occur; 2) quantify peripheral vestibular function in children with normal hearing (CNH) and CCI; 3) determine if amount of vestibular loss predicts visual acuity and balance performance.
Design
Eleven CCI and 12 CNH completed the following tests of vestibular function: ocular and cervical vestibular evoked myogenic potential (VEMP) to assess utricle and saccule function, and the video head impulse test (vHIT) to assess semicircular canal function. The relationship between amount of vestibular loss and the following balance and visual acuity outcomes was assessed: dynamic gait index, single leg stance, the sensory organization test, and tests of visual acuity, including dynamic visual acuity and the gaze stabilization test.
Results
1) There were no significant age-related changes in peripheral vestibular testing with the exception of the n23 cervical VEMP latency, which was moderately correlated with age; 2) CCI had significantly higher rates of vestibular loss for each test of canal and otolith function; 3) Amount of vestibular loss predicted performance on single leg stance, the dynamic gait index, some conditions of the sensory organization test, and the dynamic visual acuity test. Age was also a contributing factor for predicting the performance of almost all outcomes.
Conclusions
Preliminarily, children with vestibular loss do not recover naturally to levels of their healthy peers, particularly with activities that utilize vestibular input; they have poorer visual acuity and balance function.
INTRODUCTION
Vestibular function in children has traditionally received little attention clinically or in research. While the overall prevalence of vestibular loss in typically-developing children is low; there is a significant association between children diagnosed with a peripheral vestibular disorder and sensorineural hearing loss [O’Reilly et al. 2010]. In children with hearing loss, estimates of the prevalence of vestibular loss vary according to both the etiology of hearing loss and degree of hearing loss. In particular, vestibular loss is more commonly found with etiologies that physiologically affect the inner ear in its entirety such as meningitis, cytomegalovirus (CMV), inner ear anomalies, and Connexin 26 mutations, among others [Cushing et al. 2013]. However, even within each of these etiologies, the prevalence, nature, and severity of vestibular loss can vary. For example, nearly 100% of children with meningitis have bilateral loss of semicircular canal function with sparing of saccule function, while children with CMV, inner ear anomalies or Connexin 26 mutations, can have variable vestibular function ranging from normal to bilateral absence of function [Cushing et al. 2013]. Regardless of the etiology of hearing loss, vestibular loss is more likely to occur as the severity of hearing loss increases [Brookhouser et al. 1991]. For this reason, it is not surprising that vestibular loss is present in approximately 50% of children prior to cochlear implantation [Licameli et al. 2009;Jacot et al. 2009;Jin et al. 2006], with an estimated 10% additional risk of further vestibular loss directly related to the process of cochlear implantation [Jacot et al. 2009].
Up until recently, quantifying the degree of vestibular loss has been difficult. However, vestibular testing techniques now provide a means for assessing whether vestibular dysfunction is isolated to the otoliths, semi-circular canals, or involves the entire peripheral vestibular system. Vestibular evoked myogenic potentials (VEMPs) can be used to assess otolith function while the video head impulse test (vHIT) can assess the function of each semicircular canal individually. The VEMP is an electromyographic response, essentially measuring muscle potential changes. The cervical VEMP (cVEMP), measured at the sternocleidomastoid muscle in response to air-conducted stimuli, provides information regarding the saccule and inferior vestibular nerve function [Colebatch et al. 1994]. Although the origin of the ocular VEMP (oVEMP), measured from the inferior oblique muscle, is still under debate, it is thought to provide information regarding the utricle and superior vestibular nerve function [Colebatch et al. 1994;Weber et al. 2012]. Both cVEMP and oVEMP are typically measured in response to loud acoustic stimulation and have been reported in the pediatric population [Sheykholeslami et al. 2005;Kelsch et al. 2006;Wang et al. 2013]. The vHIT, which has not been reported in children, is an assessment of the vestibulo-ocular reflex (VOR), and provides information regarding individual canal (horizontal, superior, and inferior) function [MacDougall et al. 2009;MacDougall et al. 2013]. Combined, these responses (cVEMP, oVEMP, and vHIT) are ideal for testing the pediatric population as they do not induce dizziness and provide information not only about each of the individual vestibular receptors (otolith and canal), but also about the right and left ears separately.
The rate of vestibular loss in children with cochlear implants (CCI) is speculated to be higher than other children with hearing loss given the etiologies of hearing loss necessitating the CI, as well as the implant procedure itself. Pre-implantation, 50% of children have been found to have normal vestibular function in both ears [Jacot et al. 2009;Cushing et al. 2013]. The degree of vestibular loss in this population of children is variable, ranging from normal to absence of function bilaterally, as documented by caloric, rotary chair, and/or cVEMP testing [Cushing et al. 2008b;Jacot et al. 2009;Jin et al. 2006]. To date, ocular VEMP and vHIT have not been reported in a cohort of CCIs.
Improved assessment and knowledge of vestibular function is important because of the potential functional ramifications of vestibular loss. In children, vestibular loss relates critically to both gross motor developmental delay and abnormal visual acuity. As young as in infancy, children with vestibular loss demonstrate motor delays; they hold their head and independently walk significantly later than their typically developing peers (12 – 33 months versus 10–12 months) [Kaga et al. 2008;Inoue et al. 2013]. In older children specifically with CIs, significant deficits on standardized tests of motor function have also been documented [Cushing et al. 2008a]. When accounting for the presence of vestibular loss there is a relationship to gross motor function delay [Cushing et al. 2008b; Maes et al. 2014b]. In fact, rotary chair outcomes correlate with balance abilities [Cushing et al. 2008b;De Kegel et al. 2012]. Many have speculated that children will compensate for vestibular loss due to their high level of neural plasticity; however, gross motor developmental delay persists even in older children and in some cases progressively worsens [Rine et al. 2000;Rine et al. 2004].
Visual acuity can also be significantly affected in children with vestibular loss. Dynamic visual acuity (DVA) is a comparison of visual acuity with the head still (static) versus with head movement. Reduced DVA has been documented in adults with vestibular loss and linked to a variety of consequences such as difficulty with reading, decreased quality of life, and increased risk of falling, among others [Hall et al. 2004;Whitney et al. 2009;Guinand et al. 2012]. In children, DVA has not been studied widely; however, preliminary reports have documented reduced DVA in children with bilateral vestibular loss [Martin et al. 2012;Rine and Braswell 2003;Braswell and Rine 2006]. Interestingly, reading acuity has been found to be related to DVA scores, with poorer DVA scores being associated with poorer reading acuity and adjustment of or larger print size needed for effortless reading, increasing the significance of assessing DVA [Braswell and Rine 2006]. In a case series of two children, vestibular rehabilitation exercises were found to improve critical print size and reading acuity in both children with a significant improvement in DVA in one of the children [Braswell and Rine 2006]. Likewise, DVA is also related to balance function whereas children with poorer DVA scores exhibit significantly poorer balance function [Martin et al. 2012].
The overall functional ramifications of vestibular loss in children with hearing loss are yet to be elucidated, despite the potential for increased prevalence of delays/difficulties in both visual and motor domains compared to peers with normal hearing. Additionally, the relationship between the amount of vestibular loss, balance function and visual acuity outcomes is unknown in children. In fact, visual acuity outcomes, particularly DVA, have not been reported specifically in a pediatric population with CI. As described earlier, with improved techniques for assessing vestibular function, vestibular function can now be quantified according to sensory structure (otolith versus canal) and side (right versus left); however, vHIT has not been reported in any pediatric population and neither vHIT nor oVEMP have been reported in CCI. Therefore, the objectives of the present study were to: 1) determine whether age related changes in tests of peripheral vestibular function occur; 2) quantify function of the entire peripheral vestibular system in children with normal hearing (CNH) and CCIs; and 3) determine whether amount of vestibular loss predicts visual acuity and balance measures.
MATERIALS & METHODS
Study population
Eleven CCIs (mean age: 13 years of age, range 6 – 17 years, 7 males), 12 CNH (mean age: 11 years of age, range 6 – 15 years, 6 males), and 15 control adults (mean age: 27 years of age, range 22 – 34 years, 8 males) participated in the study. There was no significant mean difference in age between CNH and CCI (t (21) = −1.402, p = 0.175). By case history, all control subjects denied hearing loss or history of dizziness, imbalance or other neurologic complaints. Of the CCIs, 3 were bilaterally implanted, 4 were implanted in the right ear only, and 4 were implanted in the left ear only. Mean duration of CI use was 129 months (range 63 – 202 months). Informed consent was obtained from all subjects for testing approved by the Institutional Review Board at Boys Town National Research Hospital.
Vestibular function testing
All participants completed vestibular function testing. Each component of the vestibular system was assessed. Ocular and cervical VEMP (o- and cVEMP) assessed utricle and saccule function, respectively. Each semicircular canal (horizontal, posterior, and superior) was assessed using vHIT. As vHIT has not been reported in a pediatric population, rotary chair testing was completed for validation of vHIT findings.
Vestibular Evoked Myogenic Potential (VEMP) Testing
VEMP recordings were completed in both ears of each subject using a Bio-logic Navigator Pro Evoked Potential system (Natus, San Carlos, CA). Air conduction stimuli were delivered monaurally via ER-3A insert phones. Stimuli used were 4 ms rarefaction 500 Hz tonebursts at a repetition rate of 5.1 per second (Blackman gating window, 1 ms rise/fall time, 2 ms plateau) at an intensity of 125 dB SPL. For cVEMP, an active electrode was placed on the muscle belly of each sternocleidomastoid (SCM) muscle (right and left), a reference electrode on the manubrium of the sternum and a ground electrode on the forehead. For oVEMP, active electrodes were placed directly under each eye, reference electrodes were placed approximately 2 cm below each active electrode and a ground electrode on the forehead. One hundred sweeps were averaged for each cVEMP test and 200 sweeps were averaged for each oVEMP test. Two trials were completed of each o- and cVEMP recording. For oVEMP, signals were amplified (5000 μV) and band-pass filtered (30 Hz – 500 Hz). For cVEMP, signals were amplified (1000 μV) and band-pass filtered (10 Hz – 1000 Hz).
Subjects lay in a semi-recumbent position for both oVEMP and c VEMP recordings. For cVEMP, subjects were instructed to turn their head away from the ear being stimulated and lift their head in response to acoustic stimulation (i.e., right ear stimulation, patient turned their head to the left and lifted), thus contracting the ipsilateral SCM muscle. Measurements included the p13 and n23 latencies (ms), and the p13 to n23 peak-to-peak raw, uncorrected, amplitude (μV). EMG monitoring could not be completed due to device limitations; therefore, cVEMP responses were categorized as either present or absent. For oVEMP, subjects were instructed to direct their gaze to a mark on the ceiling set at 30° up gaze in response to acoustic stimulation. Contralateral measurements were recorded (i.e., right ear stimulation, oVEMP response recorded under the left eye) and included the n10 and p16 latencies (ms), and the n10 to p16 peak-to-peak raw amplitude (μV). oVEMP responses were categorized as either present or absent.
Video Head Impulse Test (vHIT)
The vHIT was administered using a GN Otometrics Impulse unit (Schaumberg, IL). Subjects were seated 1 meter from a visual target mounted at eye level on the wall. For each vHIT, the examiner stood behind the participant and delivered randomized (timing and direction) head impulses (100°/s to 250°/s peak head velocity) in the plane of each semicircular canal (posterior, horizontal, superior) until approximately 20 acceptable head impulses were recorded from each semicircular canal. Reponses were recorded in terms of gain (eye velocity/head velocity). Gain was automatically calculated by the device software algorithm by dividing the area under the curve for eye velocity (with reset saccades removed) by the area under the curve for head velocity.
Rotary Chair Testing
For rotary chair testing, subjects were seated in a motorized rotational chair (Micromedical Technologies, Chatham, IL, USA) in a darkened booth, preventing ambient light. Eye movements were recorded by either an infrared, 2-dimensional video system or with 2-channel electrodes. Sinusoidal harmonic acceleration (SHA) testing was completed in response to 0.02, 0.08, 0.16, and 0.32 Hz with variable maximum velocities of 70°/s, 50°/s, 40°/s, and 30°/s, respectively. Step tests were also completed in the clockwise and counterclockwise direction. For each step test, the chair was accelerated at a rate of 100°/s2 up to a velocity of 100°/s. The chair maintained this velocity for 45 seconds and then decelerated at a rate of 100°/s2 before coming to a complete stop. Eye movements were recorded for 45 seconds. For each SHA and step test, gain (eye velocity/chair velocity), phase (time constant), and symmetry were recorded.
Performance measures
Dynamic Gait Index (DGI)
The DGI is a subjective assessment of gait. For the DGI, 8 aspects of gait were assessed: 1. Normal gait speed, 2. Change in gait speed, 3. Gait with horizontal head turns, 4. Gait with vertical head turns, 5. Gait and pivot turn, 6. Step over an obstacle, 7. Step around obstacles, and 8. Steps. For each aspect a score of 3 indicated normal ability and a score of 0 indicated severe impairment for an overall maximum possible score of 24. In adults, scores that fall below 19 are considered to indicate increased fall risk (Shumway-Cook et al., 1986).
Single Leg Stance (SLS) eyes open and eyes closed
All participants were instructed to cross their arms and stand on one leg. Three trials were completed on each leg (right and left) and with eyes open and closed. The legs were not allowed to touch one another. Timing was stopped after 30 seconds or earlier if the legs touched one another, a foot moved on the floor, or the lifted foot touched down. Normal adults have been shown to be able to perform the SLS for 30 seconds [Bohannon 1994].
Sensory Organization Test (SOT)
The SOT is a test for postural control, assessing the use of somatosensory, visual and vestibular inputs. Participants were instructed to stand with their feet positioned on a moving force plate (NeuroCom, Natus) while secured with a harness. Postural control was assessed across 6 sensory conditions: 1) eyes open, fixed platform, 2) eyes closed, fixed platform, 3) eyes open, visual surround sway, 4) eyes open, platform sway, 5) eyes closed, platform sway, and 6) eyes open, platform and visual surround sway. For each condition, 3 trials were completed. Outcome parameters were: 1) equilibrium score for each condition (0 – 100), which is a quantification of the center of gravity sway (higher numbers denote less sway, lower numbers denote greater sway) and 2) a composite score, which is an average equilibrium score across all conditions.
Visual Acuity Testing
All visual acuity testing was completed with InVision (NeuroCom, Natus Corporation). Subjects were seated 3 m (approximately 10 feet) from the visual target. Subjects who wore glasses or contact lenses were encouraged to wear them for all testing. The following tests of visual acuity were completed: static visual acuity (SVA), dynamic visual acuity (DVA), and the gaze stabilization test (GST). For all tests, the optotype (the letter ‘E’) was randomly rotated each trial by 0, 90, 180, or 270° and subjects were asked to report the direction of the open prongs of the ‘E’ (right, left, up, down). The optotype size decreased in steps equivalent to a visual acuity change of 0.1 LogMAR (log10X, where X = the minimum angle resolved, in arcmin, with 1 arcmin = 1/60°) [Ferris III et al. 1982].
The purpose of SVA is to determine the smallest optotype that can be correctly identified while the head is fixed. For SVA, the optotype decreased in size until the subject failed to correctly identify five optotypes at the same acuity level or reached the LogMAR value of 0.000 (equivalent to 20/20 on the Snellen chart).
The purpose of DVA is to determine the smallest optotype that can be correctly identified while moving the head at a set velocity. DVA was completed both actively (aDVA), where the subject was instructed to shake their own head horizontally, and passively (pDVA), where the examiner shook the subject’s head horizontally. For either aDVA or pDVA, the subject wore a rate sensor (InterSense Inertia Cube) on their head and the optotype flashed in response to head velocities that were above 120°/s. The optotype flashed for no longer than 75 ms. The subject was allowed to view each optotype one time, at which point the computer no longer displayed the letter and the subject was required to guess the orientation (i.e., a forced choice of one of four possible orientations). Once the subject indicated a response, the next trial started. Testing was terminated once the subject incorrectly identified 3/5 optotype presentations at one acuity level (e.g., 20/40) or reached the LogMAR value of 0.000. The difference was calculated between the SVA LogMAR score and the active DVA LogMAR score.
The purpose of GST is to determine the maximum head velocity where accurate visual acuity can be maintained. Therefore, during GST, the optotype size did not change during testing, but the subject’s head velocity was varied. The optotype size used for GST is the SVA score increased by 0.2 LogMAR (i.e., 2 acuity levels), thus assuring that the optotype is easily visible. Subjects rhythmically move their head back and forth approximately 20 degrees horizontally to the right and left. The subject’s head velocity is increased until the average achieved velocity (AAV) is obtained (in degrees per second) for each rightward and leftward head movement. The AAV is the highest achieved velocity at which the subject correctly identifies the orientation of 3/5 optotypes.
RESULTS
1) Age related changes in tests of peripheral vestibular function
Because vHIT and oVEMP have infrequently been reported in the pediatric population, age related changes were preliminarily evaluated. To determine the effect of maturation on vestibular function tests (cVEMP, oVEMP, and vHIT), Pearson’s correlation was calculated between age and all vestibular function outcomes in the normal control subjects. Mean differences were initially compared between right and left ears for all outcomes. Bonferroni correction was calculated for multiple comparisons, p = 0.00625 (0.05/8) was used for significance. Shown in Table 1, there were no mean differences between right and left ears for any vestibular function parameters; therefore, right and left ear data were averaged for subsequent analyses. There were essentially no significant relationships between age and any of the vestibular function parameters (Table 1), with the exception of cVEMP n23 latency, which was moderately correlated with age (r = 0.548, p = 0.003), indicating cVEMP n23 latency prolongs with age.
Table 1. Relationship between age and Vestibular Function parameters.
Right and Left ear comparison shows the mean difference between right and left ears. Student’s t-tests were used for all comparisons with the exception of a one-way ANOVA for comparing vertical canal vHIT gain. The overall mean (SD) includes right and left ears combined. The right-most column shows the r and p-values obtained in the Pearson correlation between the overall mean and age for all vestibular outcomes.
| Outcome Parameter | Right and Left ear comparison | Mean (SD) | r (p-value) * p < 0.006 |
|
|---|---|---|---|---|
| cVEMP | P13 Latency (ms) | t = −0.19, p = 0.854 | 14.53 (1.07) | 0.240 (0.228) |
| N23 Latency (ms) | t = −1.3, p = 0.206 | 22.88 (2.5) | 0.548 (0.003)* | |
| Peak-to-peak amplitude (μv) | t = −0.72, p = 0.477 | 278.64 (125.56) | −0.121 (0.548) | |
| oVEMP | N10 Latency (ms) | t = 1.95, p = 0.366 | 11.21 (0.86) | 0.250 (0.229) |
| P16 Latency (ms) | t = −0.67, p = 0.065 | 16 (1.03) | 0.297 (0.149) | |
| Peak-to-peak amplitude(μv) | t = 0.925, p = 0.510 | 5.94 (3.15) | −0.025 (0.904) | |
| vHIT canal gain | Horizontal Canal | t = 1.86, p = 0.075 | 0.98 (0.08) | −0.03 (0.881) |
| Vertical Canals (Posterior & Anterior) | F = 2.28, p = 0.08 | 0.87 (0.15) | 0.052 (0.797) |
2) Quantifying peripheral vestibular system function in CNH and CCI
Response rates for vestibular function tests across groups are shown in Table 2. For c- and oVEMP, the presence of a response was considered normal, while an absent response was considered abnormal. For vHIT, gain was considered abnormal if it was less than 1.5 standard deviations from the mean of the normal control subjects. For horizontal canals, normal gain was ≥ 0.85, and for vertical canals (posterior and anterior), normal gain was ≥ 0.65. Chi Square analysis was used to determine if there were significant differences in the prevalence of vestibular loss between CNH and CCI. As shown in Table 2, CCI had significantly greater rates of vestibular loss for each test of canal and otolith function.
Table 2.
Response Rates (% normal response)
| Vestibular Outcomes | ||||||||||
|---|---|---|---|---|---|---|---|---|---|---|
| Ear | Right | Left | ||||||||
| Group | vHIT HC |
vHIT PC |
vHIT AC |
cVEMP Saccule |
oVEMP Utricle |
vHIT LHC |
vHIT LPC |
vHIT LAC |
cVEMP Saccule |
oVEMP Utricle |
| CCI | 55%* | 30%* | 60%* | 55%* | 36%* | 55%* | 40%* | 40%* | 55%* | 55%* |
| CNH | 92% | 75% | 100% | 100% | 92% | 92% | 92% | 92% | 100% | 92% |
|
X2 p-value |
4.1 0.043 |
4.46 0.035 |
5.87 0.015 |
6.97 0.008 |
6.97 0.008 |
4.1 0.043 |
6.71 0.01 |
6.71 0.01 |
4.77 0.029 |
4.1 0.043 |
R = Right, L = Left, HC = Horizontal Canal, PC = Posterior Canal, AC = Anterior Canal
Normal VEMP = present response; Normal vHIT gain > 0.85 horizontal canal and > 0.65 vertical canals
= significant difference in prevalence between CCI and CNH
Rotary chair testing was incorporated to validate vHIT results, as vHIT has not been reported in a pediatric population. Children who did not elicit measureable nystagmus in response to rotation were given a rotary chair gain value of 0. Because rotary chair is an assessment of overall responsiveness of horizontal canal function, rotary chair gain (0.02, 0.08, 0.16, and 0.32 Hz) and mean vHIT gain for the horizontal canals were compared. Pearson’s correlation was also calculated. Bonferroni correction was calculated for multiple comparisons, p = 0.0125 (0.05/4) was used for significance. Higher vHIT gains were significantly associated with higher rotary chair gains for all test frequencies: SHA 0.02 Hz (r = 0.765, p < 0.001), SHA 0.08 Hz (r = 0.848, p < 0.001), SHA 0.16 Hz (r = 0.83, p < 0.001), and SHA 0.32 Hz (r = 0.774, p < 0.001). Mean horizontal vHIT gain and mean SHA gain across all frequencies is shown in Figure 1. Abnormal vHIT gain occurred in all instances in which abnormal rotary chair gain occurred (gray-shaded region, Figure 1), with the exception of one normal control adult that had normal vHIT gain and borderline low rotary chair gain.
Figure 1.
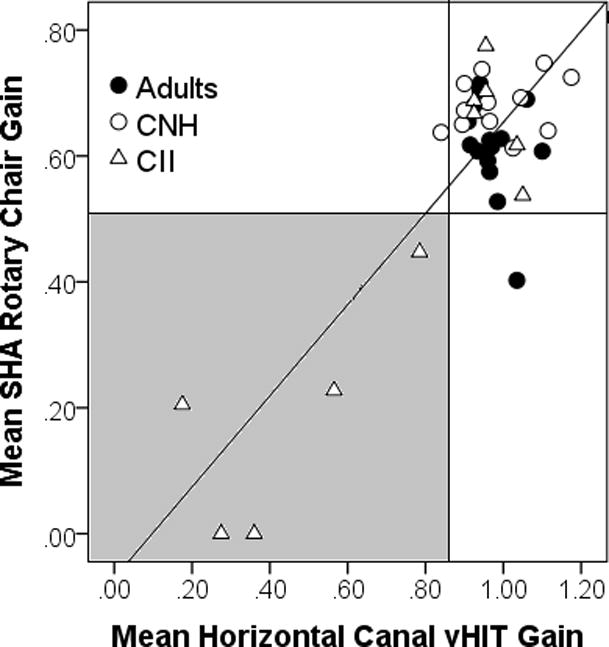
Relationship between mean horizontal canal vHIT gain and mean SHA rotary chair gain for normal control adults (closed circle), CNH (open circle) and CCI (open triangle). Line represents regression line through the data. Gray shaded region represents abnormal horizontal canal vHIT gain (< 0.85) and abnormal mean SHA rotary chair gain (< 0.50).
3) Relationship between degree of vestibular loss and visual acuity and balance outcomes
Because some CCI had normal or partial vestibular function, the amount of vestibular loss needed to be accounted for. Therefore, we introduce a simple scale that can be used to account for the amount of vestibular loss; vestibular function in the right and left ears was categorized as either normal or abnormal (coded as 1 or 0, respectively) for a total of 10 components [Right and Left: 1) utricle, 2) saccule, 3) posterior canal, 4) superior canal, and 5) horizontal canal], based on oVEMP, cVEMP, and individual semicircular canal gain for the right and left posterior, superior, and horizontal semi-circular canal. Based on the sum of the 10 component scores, complete loss of function was represented by 0, normal function represented by 10, and varying levels of vestibular loss represented by summed scores ranging from 1 – 9. Shown in Figure 2, the amount of vestibular loss was significantly greater in CCIs (mean: 5.09, range: 0 – 10) compared to CNH (mean: 9.3, range 6 – 10; F (1,21) = 11.091, p = 0.002). In the CNH, where vestibular function is hypothesized to be normal, a select few had borderline abnormal vHIT gain and 2 children had absent ocular VEMP.
Figure 2.
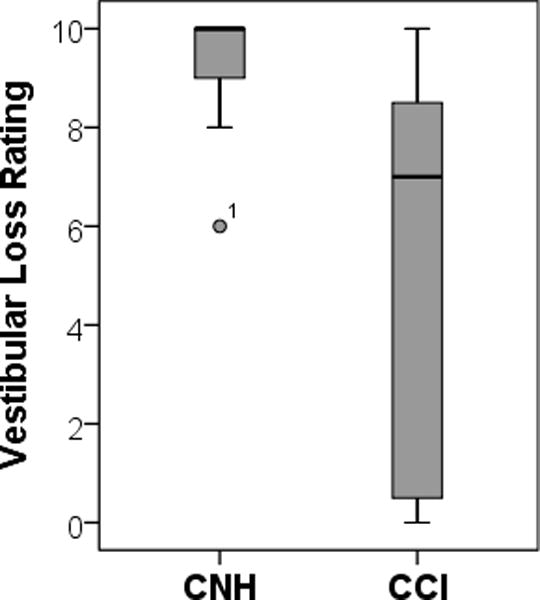
Mean vestibular loss rating of CNH (left) and CCI (right) where 10 = normal function and 0 = complete loss of function. One subject (CNH group), denoted by an asterisk, had borderline abnormally low vHIT gain in 4 canals.
The primary purpose of the study was to determine if degree of vestibular loss predicts visual acuity and balance measures in children with varying degree of vestibular loss. Therefore, multiple regression analyses were conducted with 2 predictors (amount of vestibular loss and age) to examine whether degree of vestibular loss and age of child could predict performance on balance measures and visual acuity outcomes. Summary statistics of the performance measures are shown in Table 3 with the children separated into 3 groups: 1. CNH (n = 12), 2. CCI and normal vestibular function (n = 6, amount of vestibular loss > 5), and 3. CCI and significant vestibular loss (n = 5, amount of vestibular loss < 5). Of the 5 CCI with significant vestibular loss, etiology of hearing loss included meningitis (n = 2), Pendred (n = 1), Mondini (n = 1), and unknown etiology (n =1). In these 5 CCI, 4 were implanted unilaterally and 1 implanted bilaterally (etiology meningitis).
Table 3.
Descriptive statistics (mean [SD]) between CNH, CCI and normal vestibular function, and CCI and vestibular loss. R2 and unstandardized Coefficients (B) for age and amount of vestibular loss (VL) are shown in right columns.
| Outcome Measure | CNH (n = 12) |
CCI-normal vestibular (n = 6) |
CCI-vestibular loss (n = 5) |
R2 | p | Unstandardized Coefficients (B) | |
|---|---|---|---|---|---|---|---|
| Age | VL | ||||||
| Static Acuity (Log MAR) | −0.23 (0.08) |
−0.19 (0.06) |
−0.07 (0.22) |
0.116 | 0.292 | 0.005 | −0.009 |
| GST (deg/s) | 124 (50.14) |
113 (30.69) |
85 (43.29) |
0.101 | 0.345 | −1.662 | 2.913 |
| aDVA (LogMAR) | 0.26 (0.09) |
.016 (0.11) |
0.42 (0.06) |
0.381 | 0.008 | 0.001 | −0.02 |
| pDVA (LogMAR) | 0.17 (0.12) |
0.17 (0.10) |
0.42 (0.16) |
0.444 | 0.003 | 0.003 | −0.028 |
| DGI | 24 (0.0) |
23.5 (0.84) |
23.6 (0.89) |
0.384 | 0.008 | 0.095 | 0.092 |
| SLS EO (sec) | 29 (1.83) |
25.25 (4.89) |
23.7 (8.7) |
0.289 | 0.033 | 0.551 | 0.789 |
| SLS EC (sec) | 16.73 (6.1) |
9.79 (6.01) |
2.79 (0.37) |
0.571 | < 0.001 | 0.837 | 1.683 |
| SOT 1 | 89.89 (4.24) |
90.22 (8.96) |
92.8 (5.93) |
0.623 | < 0.001 | 1.394 | 0.454 |
| SOT 2 | 84.75 (5.19) |
87.61 (7.56) |
91.8 (4.96) |
0.524 | 0.001 | 1.13 | −0.204 |
| SOT 3 | 81.8 (10.98) |
85.8 (6.52) |
89.17 (7.57) |
0.346 | 0.022 | 1.472 | −0.14 |
| SOT 4 | 60.17 (20.55) |
65 (22.07) |
76.73 (17.33) |
0.459 | 0.002 | 3.835 | 0.144 |
| SOT 5 | 40.03 (21.82) |
54.39 (20.72) |
25.8 (21.45) |
0.308 | 0.025 | 2.99 | 3.372 |
| SOT 6 | 45.61 (20.39) |
44.13 (24.22) |
13.17 (10.54) |
0.474 | 0.003 | 2.517 | 4.47 |
| SOT Composite | 61.17 (12.53) |
65.8 (16.75) |
55.5 (10.63) |
0.473 | 0.003 | 2.512 | 1.709 |
gray shaded and bold = significant
Visual Acuity Testing
Outcomes analyzed for visual acuity testing were static acuity, mean GST, mean active DVA, and mean passive DVA. For static acuity and mean GST, there was no relationship with amount of vestibular loss and age (Table 3). For mean active DVA, the multiple regression model produced R2 = 0.381, F(2,20) = 6.15, p = 0.008. Only amount of vestibular loss contributed toward the model, suggesting that children with greater residual vestibular function had better performance on active DVA and that age was not a significant factor (Figure 3). Similar findings were also noted for passive DVA. The multiple regression model produced R2 = 0.444, F(2,20) = 7.989, p = 0.003. Likewise, only amount of vestibular loss contributed toward the model, suggesting that children with greater residual vestibular function had better performance on passive DVA and that age was not a significant factor (Figure 3).
Figure 3.
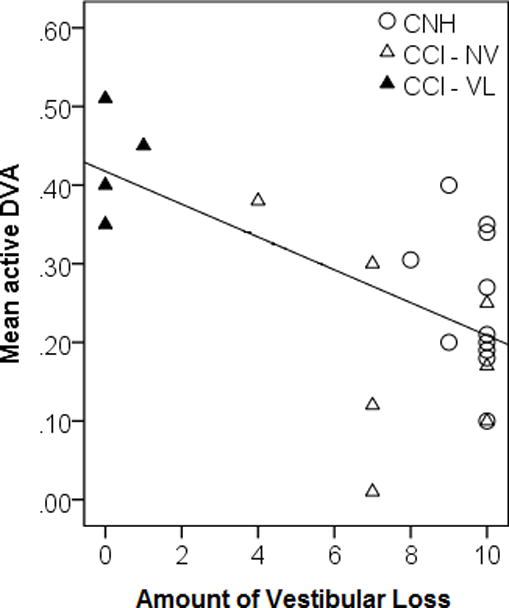

Dynamic Visual Acuity. Mean active (left) and passive (right) DVA performance as it relates to Amount of Vestibular Loss (Open Circle = CNH, Open Triangle = CCI with normal vestibular function (NV), and Filled Triangles = CCI with vestibular loss (VL))
Dynamic Gait Index (DGI)
For DGI, the multiple regression model produced R2 = 0.384, F(2,20) = 6.229, p = 0.008. Both amount of vestibular loss and age had positive regression weights, suggesting that older children with greater residual vestibular function had better performance on the DGI.
Single Leg Stance (SLS) eyes open (EO) and eyes closed (EC)
For SLS-EO, the multiple regression model produced R2 = 0.289, F(2,20) = 4.071, p = 0.033. Only amount of vestibular loss positively contributed toward the model, suggesting that children with greater residual vestibular function had better performance on SLS-EO (Table 3, Figure 4). For SLS-EC, the multiple regression model produced R2 = 0.571, F(2,20) = 12.65, p < 0.001. Both age and amount of vestibular loss contributed toward the model, suggesting that older children with greater residual vestibular function had better performance on SLS-EC (Table 3, Figure 4).
Figure 4.

Single Leg Stance (SLS) Eyes Open (EO) and Eyes Closed (EC). Mean SLS-EO and –EC performance as it relates to Amount of Vestibular Loss * (Open symbols= CNH, Closed symbols= CCI)
Sensory Organization Test (SOT)
For SOT (1–4) the multiple regression models produced significant effects; however for each condition, the only significant contributor to the model was age, suggesting that performance improves with age (Table 3). For SOT 5, SOT 6, and the SOT Composite the multiple regression models produced significant effects with both age and amount of vestibular loss contributing to the model suggesting that older children with greater residual vestibular function had better performance on SOT 5, SOT 6, and the overall SOT Composite (Table 3).
DISCUSSION
The purpose of the present study was three-fold. The first purpose was to determine if developmental and/or age related changes in peripheral vestibular function occur. With the exception of the cVEMP n23 latency, which significantly increased with age, the present study did not show significant age-related changes in tests of peripheral vestibular system function, specifically with oVEMP, cVEMP and vHIT. It should be noted that the sample size was small (n = 12). Based on the highest, non-significant r-value from Table 1 (r = 0.297), a sample of 82 would be needed to uncover any additional age effects. While larger scale data are needed, these preliminary findings suggest that vestibular reflexes (the vestibulo-ocular reflex and vestibulo-colic reflex) are adult-like by age 7, the lower age limit of our population. Consistent with the current findings, cVEMP n23 latency has been found to increase with age [Kelsch et al. 2006;Su et al. 2004;Welgampola and Colebatch 2001; Maes et al. 2014a]; however, this finding has not been reported consistently [Basta et al. 2005]. Chang et al. (2007) report that cVEMP p13 latency is related to neck length [Chang et al. 2007], which might also explain the n23 increase when examining trends with children, but not in adults. Reduced cVEMP amplitudes are more frequently reported with age [Janky and Shepard 2009;Basta et al. 2007;Su et al. 2004;Welgampola and Colebatch 2001]; however, the age range of our participants was not wide enough (n = 27, age range: 6 – 34 years) to expect age-related reductions in cVEMP amplitudes as the most pronounced changes occur after age 60 [Welgampola and Colebatch 2001;Janky and Shepard 2009;Su et al. 2004]
With regard to oVEMP, recording oVEMP has been attempted in healthy children age newborn up to 13 years; however, present oVEMP responses do not consistently emerge in children until greater than 2 years, suggesting a possible maturation effect [Wang et al. 2013]. After age 2, when oVEMPs were consistently measured, no significant correlations between age and oVEMP n10 latency, p16 latency, or peak-to-peak amplitude were noted, suggesting that there are not continued maturation effects [Wang et al. 2013]. These findings are consistent with the current study, which did not demonstrate significant age-related changes in the oVEMP.
This is the first report of vHIT in a pediatric population, with the exception of an isolated case report demonstrating vHIT findings in a 4-year old child [Manzari et al. 2012]. Current findings confirm that vHIT can be completed in a pediatric population and furthermore, that in this small sample gain is a stable outcome parameter, not affected by age/maturation. vHIT gains were also significantly associated with rotary chair gains. Given its close estimation to rotary chair, vHIT is a preferable test as it provides ear specific and canal specific information regarding semicircular function without causing symptoms of dizziness and is easier to perform than both rotary chair and caloric testing. Likewise, the similarity of the vHIT gain in children to adult data makes the vHIT a preferable test compared to the rotary chair test, as higher rotary chair gains have been reported in children compared to adults [Valente 2007; Maes et al. 2014a; Charpiot et al. 2010].
The second purpose of the present study was to quantify function of the entire peripheral vestibular system using vHIT, cVEMP and oVEMP and compare the prevalence of vestibular loss in CNH to CCI. As expected, CCI had significantly higher rates of vestibular loss. Previously, approximately 50% of CCI have demonstrated some degree of vestibular loss involving the saccule, assessed by cVEMP, and semicircular canals, assessed by rotary chair or calorics [Jacot et al. 2009;Jin et al. 2006;Cushing et al. 2013]. Although we used different methods (i.e., vHIT, cVEMP and oVEMP), our rates of vestibular loss are consistent with others. The rate of semicircular canal abnormalities across canals was 46.7% using vHIT; the average rate of saccule and utricle abnormalities was 55% and 45%, respectively, using cVEMP and oVEMP. In children with vestibular loss, approximately 20–30% have been reported to have bilateral vestibular loss [Jacot et al. 2009;Cushing et al. 2013]. Consistent with this estimation, in our group of CCI (n = 13), 4 children (31%) had bilateral loss of vestibular function as noted by a combination of vHIT, cVEMP and oVEMP. Vestibular testing was not completed prior to implantation; therefore, comment cannot be made in this small sample of CCI regarding the effect of implantation on vestibular function.
The third purpose of the present study was to determine if amount of vestibular loss predicts visual acuity and balance measures, specifically in CCI. The vestibular system is responsible for maintaining steady gaze during head movement as well as maintenance of balance throughout daily activities. As such, deficits in the vestibular system might be hypothesized to result in deficits in both visual acuity and motor function. In our small sample, CCI and vestibular loss demonstrated poor DVA and balance function, and amount of vestibular loss predicted performance on some of these measures. With regard to DVA, reduced DVA has been documented in children with hearing and vestibular loss [Rine and Braswell 2003;Braswell and Rine 2006;Martin et al. 2012;Rine et al. 2013]; however, to our knowledge has not been reported in a population of CCIs. Our findings are consistent with others, in that significant vestibular loss does cause reduced DVA [Rine and Braswell 2003;Braswell and Rine 2006].
The degree of vestibular loss in our pediatric population was highly predictive of abnormalities in DVA. This information is helpful in that children with congenital (or early acquired) vestibular loss will not frequently complain of blurred vision, or dizziness for that matter; therefore, the relationship between degree of vestibular loss and reduced DVA can be helpful in predicting performance and targeting children who might be good candidates for physical therapy, specifically, vestibular rehabilitation. In adults, reduced DVA, difficulty reading and watching television, decreased quality of life and increased risk of falling have all been reported as potential side effects of vestibular loss [Guinand et al. 2012]. Participation in vestibular rehabilitation (i.e., vestibular adaptation exercises) has been shown to improve DVA in adults with vestibular loss and reduce perception of handicap, which has been attributed to generation of centrally-preprogrammed saccades as well as improved angular VOR gain [Schubert et al. 2008;Herdman et al. 2007;Herdman et al. 2003;Herdman et al. 2001]. However, the effects of physical therapy on visual acuity have not been thoroughly investigated in children. There is a relationship between reduced DVA and poorer reading acuity, suggesting that visual acuity in children with vestibular loss may have more severe and broader repercussions than in adults [Braswell and Rine 2006]. In a small case series (n = 2), vestibular rehabilitation exercises were found to improve critical print size and reading acuity in both children with improvement in DVA in one child, providing evidence for the potential benefit of vestibular rehab on visual acuity abnormalities [Braswell and Rine 2006].
Similar to DVA, reductions in balance performance was evidenced in CCIs and vestibular loss in the present study. The amount of vestibular loss was also found to predict performance specifically on the following measures: DGI, SLS-EO, SLS-EC, SOT 5, SOT 6, and the SOT composite score. In children with vestibular loss, abnormal performance on measures of motor function loss has been documented by several others [Maes et al. 2014b; Cushing et al. 2008b; De Kegel et al. 2012]. Additionally, a relationship between vestibular function testing, such as rotary chair, and motor function performance has been documented [Cushing et al. 2008b;De Kegel et al. 2012]. However, this is the first report specifically targeting the relationship between amount of vestibular loss and balance function in a cohort of older CCI, demonstrating that children with greater degrees of vestibular loss have poorer performance on tests of motor function. A similar relationship has been documented with respect to caloric testing, wherein children with a bilateral caloric weakness performed significantly more poorly than children with either a unilateral weakness or normal caloric function [Cushing et al. 2008b].
The SOT is a functional measure of balance/maintenance of stance, with each SOT condition emphasizing a different aspect of balance control (i.e., proprioception, vision, and/or vestibular). Performance on SOT conditions 1 – 4 was not related to amount of vestibular loss, which was not surprising as the primary component responsible for maintaining balance in these conditions is that of either proprioception or vision. Conversely, conditions 5 and 6 primarily utilize the vestibular system for maintenance of stance; therefore, the relationship between amount of vestibular loss and performance was consistent. For all conditions (1 – 6), age was a significant predictor of performance. This is consistent with previous data demonstrating that children do not mimic adult strategies for balance until 12 – 15 years of age [Peterson et al. 2006;Peterka and Black 1990]. Performance on the SOT has been shown to improve with increased age [Casselbrant et al. 2010;Peterson et al. 2006;Rine et al. 1998;Valente 2007].
We introduced a simple scale that can be used to account for the amount of vestibular loss. One confound of this simple scale is that it does not account for the differences in otolith versus canal contribution to visual acuity or balance outcomes. The otoliths provide information regarding linear and gravitational acceleration while the semicircular canals provide information regarding angular acceleration. Differences in the contribution of these receptor types could not be determined in this population as most children had either normal or no residual vestibular function, bilaterally. For this reason, it was difficult to discern whether there are essential vestibular function tests for predicting visual acuity or balance outcomes. It has been speculated that otolith function plays an important role, particularly in motor function as younger children with absent VEMP responses have been reported to walk later than those with present responses [Inoue et al. 2013]. In older children, those with a normal VEMP response have been reported to have better static balance than those with absent responses [De Kegel et al. 2012;Jafari and Asad 2011;Shall 2009]. However, in many of these studies, canal function was not assessed; therefore, overall degree of vestibular loss could not be considered [Shall 2009;Jafari and Asad 2011]. Consistent with the present study, when accounting for both canal and otolith responses, those with combined vestibular loss (canal and otolith) demonstrated greater dysfunction [Inoue et al. 2013]. Additional data are needed in children with varying degrees of vestibular loss to further investigate the relationship between amount of vestibular loss and both visual acuity and balance outcomes.
Conclusion
These preliminary findings demonstrate the importance of understanding the integrity of vestibular function in CCIs. A common assumption is that children with vestibular loss will recover functionally, due to plasticity. However, here we report a small cohort of CCIs, of whom 50% have significant vestibular loss, demonstrating significant reductions in both DVA and some aspects of motor function performance. This preliminary evidence suggests that children with vestibular loss do not naturally recover to levels of their healthy peers, particularly with activities that utilize vestibular input and that attention should be given to vestibular loss in the pediatric population. Given these functional ramifications of vestibular loss in CCIs, consideration should be given to conserving vestibular function in this population. While vestibular loss is often concurrent with hearing loss, there is an estimated 10% risk of additional vestibular loss as a direct result of cochlear implantation [Jacot et al. 2009]. To minimize the risk of additional vestibular loss, pre-implant vestibular testing is recommended and should be considered when choosing the appropriate ear for cochlear implantation. Finally, as outlined above, enrollment in physical therapy (specifically vestibular rehabilitation) for children with vestibular loss could be considered. Additional work is needed in a larger cohort of CCI with vestibular loss. Studies are currently underway further investigating the functional consequences of vestibular loss in CCI.
Contributor Information
Kristen Janky, Boys Town National Research Hospital.
Diane Givens, Boys Town National Research Hospital.
Reference List
- 1.Basta D, Todt I, Ernst A. Normative data for P1/N1-latencies of vestibular evoked myogenic potentials induced by air- or bone-conducted tone bursts. Clin Neurophysiol. 2005;116:2216–2219. doi: 10.1016/j.clinph.2005.06.010. [DOI] [PubMed] [Google Scholar]
- 2.Basta D, Todt I, Ernst A. Characterization of age-related changes in vestibular evoked myogenic potentials. J Vestib Res. 2007;17:93–98. [PubMed] [Google Scholar]
- 3.Bohannon RW. One-legged balance test times. Percept Mot Skills. 1994;78:801–802. doi: 10.1177/003151259407800322. [DOI] [PubMed] [Google Scholar]
- 4.Braswell J, Rine RM. Evidence that vestibular hypofunction affects reading acuity in children. Int J Pediatr Otorhinolaryngol. 2006;70:1957–1965. doi: 10.1016/j.ijporl.2006.07.013. [DOI] [PubMed] [Google Scholar]
- 5.Brookhouser PE, Cyr DG, Peters JE, et al. Correlates of vestibular evaluation results during the first year of life. Laryngoscope. 1991;101:687–694. doi: 10.1288/00005537-199107000-00001. [DOI] [PubMed] [Google Scholar]
- 6.Casselbrant ML, Mandel EM, Sparto PJ, et al. Longitudinal posturography and rotational testing in children three to nine years of age: normative data. Otolaryngol Head Neck Surg. 2010;142:708–714. doi: 10.1016/j.otohns.2010.01.028. [DOI] [PMC free article] [PubMed] [Google Scholar]
- 7.Chang CH, Yang TL, Wang CT, et al. Measuring neck structures in relation to vestibular evoked myogenic potentials. Clin Neurophysiol. 2007;118:1105–1109. doi: 10.1016/j.clinph.2007.01.020. [DOI] [PubMed] [Google Scholar]
- 8.Charpiot A, Tringali S, Ionescu E, et al. Vestibulo-ocular reflex and balance maturation in healthy children aged from six to twelve years. Audiol Neurootol. 2010;15:203–210. doi: 10.1159/000255338. [DOI] [PubMed] [Google Scholar]
- 9.Colebatch JG, Halmagyi GM, Skuse NF. Myogenic potentials generated by a click-evoked vestibulocollic reflex. J Neurol Neurosurg Psychiatry. 1994;57:190–197. doi: 10.1136/jnnp.57.2.190. [DOI] [PMC free article] [PubMed] [Google Scholar]
- 10.Cushing SL, Chia R, James AL, et al. A test of static and dynamic balance function in children with cochlear implants: the vestibular olympics. Arch Otolaryngol Head Neck Surg. 2008a;134:34–38. doi: 10.1001/archoto.2007.16. [DOI] [PubMed] [Google Scholar]
- 11.Cushing SL, Gordon KA, Rutka JA, et al. Vestibular End-Organ Dysfunction in Children With Sensorineural Hearing Loss and Cochlear Implants: An Expanded Cohort and Etiologic Assessment. Otol Neurotol. 2013 doi: 10.1097/MAO.0b013e31827b4ba0. [DOI] [PubMed] [Google Scholar]
- 12.Cushing SL, Papsin BC, Rutka JA, et al. Evidence of vestibular and balance dysfunction in children with profound sensorineural hearing loss using cochlear implants. Laryngoscope. 2008b;118:1814–1823. doi: 10.1097/MLG.0b013e31817fadfa. [DOI] [PubMed] [Google Scholar]
- 13.De Kegel A, Maes L, Baetens T, et al. The influence of a vestibular dysfunction on the motor development of hearing-impaired children. Laryngoscope. 2012;122:2837–2843. doi: 10.1002/lary.23529. [DOI] [PubMed] [Google Scholar]
- 14.Ferris FL, III, Kassoff A, Bresnick GH, et al. New visual acuity charts for clinical research. Am J Ophthalmol. 1982;94:91–96. [PubMed] [Google Scholar]
- 15.Guinand N, Pijnenburg M, Janssen M, et al. Visual acuity while walking and oscillopsia severity in healthy subjects and patients with unilateral and bilateral vestibular function loss. Arch Otolaryngol Head Neck Surg. 2012;138:301–306. doi: 10.1001/archoto.2012.4. [DOI] [PubMed] [Google Scholar]
- 16.Hall CD, Schubert MC, Herdman SJ. Prediction of fall risk reduction as measured by dynamic gait index in individuals with unilateral vestibular hypofunction. Otol Neurotol. 2004;25:746–751. doi: 10.1097/00129492-200409000-00017. [DOI] [PubMed] [Google Scholar]
- 17.Herdman SJ, Hall CD, Schubert MC, et al. Recovery of dynamic visual acuity in bilateral vestibular hypofunction. Arch Otolaryngol Head Neck Surg. 2007;133:383–389. doi: 10.1001/archotol.133.4.383. [DOI] [PubMed] [Google Scholar]
- 18.Herdman SJ, Schubert MC, Das VE, et al. Recovery of dynamic visual acuity in unilateral vestibular hypofunction. Arch Otolaryngol Head Neck Surg. 2003;129:819–824. doi: 10.1001/archotol.129.8.819. [DOI] [PubMed] [Google Scholar]
- 19.Herdman SJ, Schubert MC, Tusa RJ. Role of central preprogramming in dynamic visual acuity with vestibular loss. Arch Otolaryngol Head Neck Surg. 2001;127:1205–1210. doi: 10.1001/archotol.127.10.1205. [DOI] [PubMed] [Google Scholar]
- 20.Inoue A, Iwasaki S, Ushio M, et al. Effect of vestibular dysfunction on the development of gross motor function in children with profound hearing loss. Audiol Neurootol. 2013;18:143–151. doi: 10.1159/000346344. [DOI] [PubMed] [Google Scholar]
- 21.Jacot E, Van Den Abbeele T, Debre HR, et al. Vestibular impairments pre- and post-cochlear implant in children. Int J Pediatr Otorhinolaryngol. 2009;73:209–217. doi: 10.1016/j.ijporl.2008.10.024. [DOI] [PubMed] [Google Scholar]
- 22.Jafari Z, Asad MS. The effect of saccular function on static balance ability of profound hearing-impaired children. Int J Pediatr Otorhinolaryngol. 2011;75:919–924. doi: 10.1016/j.ijporl.2011.04.006. [DOI] [PubMed] [Google Scholar]
- 23.Janky KL, Shepard N. Vestibular evoked myogenic potential (VEMP) testing: normative threshold response curves and effects of age. J Am Acad Audiol. 2009;20:514–522. doi: 10.3766/jaaa.20.8.6. [DOI] [PMC free article] [PubMed] [Google Scholar]
- 24.Jin Y, Nakamura M, Shinjo Y, et al. Vestibular-evoked myogenic potentials in cochlear implant children. Acta Otolaryngol. 2006;126:164–169. doi: 10.1080/00016480500312562. [DOI] [PubMed] [Google Scholar]
- 25.Kaga K, Shinjo Y, Jin Y, et al. Vestibular failure in children with congenital deafness. Int J Audiol. 2008;47:590–599. doi: 10.1080/14992020802331222. [DOI] [PubMed] [Google Scholar]
- 26.Kelsch TA, Schaefer LA, Esquivel CR. Vestibular evoked myogenic potentials in young children: test parameters and normative data. Laryngoscope. 2006;116:895–900. doi: 10.1097/01.mlg.0000214664.97049.3e. [DOI] [PubMed] [Google Scholar]
- 27.Licameli G, Zhou G, Kenna MA. Disturbance of vestibular function attributable to cochlear implantation in children. Laryngoscope. 2009;119:740–745. doi: 10.1002/lary.20121. [DOI] [PubMed] [Google Scholar]
- 28.MacDougall HG, McGarvie LA, Halmagyi GM, et al. Application of the video head impulse test to detect vertical semicircular canal dysfunction. Otol Neurotol. 2013;34:974–979. doi: 10.1097/MAO.0b013e31828d676d. [DOI] [PubMed] [Google Scholar]
- 29.MacDougall HG, Weber KP, McGarvie LA, et al. The video head impulse test: diagnostic accuracy in peripheral vestibulopathy. Neurology. 2009;73:1134–1141. doi: 10.1212/WNL.0b013e3181bacf85. [DOI] [PMC free article] [PubMed] [Google Scholar]
- 30.Maes L, De Kegel A, Van WH, et al. Rotatory and colic vestibular evoked myogenic potential testing in normal-hearing and hearing-impaired children. Ear and Hearing. 2014a doi: 10.1097/AUD.0b013e3182a6ca91. [DOI] [PubMed] [Google Scholar]
- 31.Maes L, De Kegel A, Van WH, et al. Association Between Vestibular Function and Motor Performance in Hearing-impaired Children. Otol Neurotol. 2014b doi: 10.1097/MAO.0000000000000597. [DOI] [PubMed] [Google Scholar]
- 32.Manzari L, Burgess AM, MacDougall HG, et al. Objective measures of vestibular function during an acute vertigo attack in a very young child. Eur Arch Otorhinolaryngol. 2012;269:2589–2592. doi: 10.1007/s00405-012-2045-0. [DOI] [PubMed] [Google Scholar]
- 33.Martin W, Jelsma J, Rogers C. Motor proficiency and dynamic visual acuity in children with bilateral sensorineural hearing loss. Int J Pediatr Otorhinolaryngol. 2012 doi: 10.1016/j.ijporl.2012.07.007. [DOI] [PubMed] [Google Scholar]
- 34.O’Reilly RC, Morlet T, Nicholas BD, et al. Prevalence of vestibular and balance disorders in children. Otol Neurotol. 2010;31:1441–1444. doi: 10.1097/MAO.0b013e3181f20673. [DOI] [PubMed] [Google Scholar]
- 35.Peterka RJ, Black FO. Age-related changes in human posture control: sensory organization tests. J Vestib Res. 1990;1:73–85. [PubMed] [Google Scholar]
- 36.Peterson ML, Christou E, Rosengren KS. Children achieve adult-like sensory integration during stance at 12-years-old. Gait Posture. 2006;23:455–463. doi: 10.1016/j.gaitpost.2005.05.003. [DOI] [PubMed] [Google Scholar]
- 37.Rine RM, Braswell J. A clinical test of dynamic visual acuity for children. Int J Pediatr Otorhinolaryngol. 2003;67:1195–1201. doi: 10.1016/j.ijporl.2003.07.004. [DOI] [PubMed] [Google Scholar]
- 38.Rine RM, Braswell J, Fisher D, et al. Improvement of motor development and postural control following intervention in children with sensorineural hearing loss and vestibular impairment. Int J Pediatr Otorhinolaryngol. 2004;68:1141–1148. doi: 10.1016/j.ijporl.2004.04.007. [DOI] [PubMed] [Google Scholar]
- 39.Rine RM, Cornwall G, Gan K, et al. Evidence of progressive delay of motor development in children with sensorineural hearing loss and concurrent vestibular dysfunction. Percept Mot Skills. 2000;90:1101–1112. doi: 10.2466/pms.2000.90.3c.1101. [DOI] [PubMed] [Google Scholar]
- 40.Rine RM, Rubish K, Feeney C. Measurement of sensory system effectiveness and maturational changes in postural control in young children. Pediatric Physical Therapy. 1998;10:16–20. [Google Scholar]
- 41.Rine RM, Schubert MC, Whitney SL, et al. Vestibular function assessment using the NIH Toolbox. Neurology. 2013;80:S25–S31. doi: 10.1212/WNL.0b013e3182872c6a. [DOI] [PMC free article] [PubMed] [Google Scholar]
- 42.Schubert MC, Migliaccio AA, Clendaniel RA, et al. Mechanism of dynamic visual acuity recovery with vestibular rehabilitation. Arch Phys Med Rehabil. 2008;89:500–507. doi: 10.1016/j.apmr.2007.11.010. [DOI] [PMC free article] [PubMed] [Google Scholar]
- 43.Shall MS. The importance of saccular function to motor development in children with hearing impairments. Int J Otolaryngol. 2009;2009:972565. doi: 10.1155/2009/972565. [DOI] [PMC free article] [PubMed] [Google Scholar]
- 44.Sheykholeslami K, Megerian CA, Arnold JE, et al. Vestibular-evoked myogenic potentials in infancy and early childhood. Laryngoscope. 2005;115:1440–1444. doi: 10.1097/01.mlg.0000167976.58724.22. [DOI] [PubMed] [Google Scholar]
- 45.Su HC, Huang TW, Young YH, et al. Aging effect on vestibular evoked myogenic potential. Otol Neurotol. 2004;25:977–980. doi: 10.1097/00129492-200411000-00019. [DOI] [PubMed] [Google Scholar]
- 46.Valente M. Maturational effects of the vestibular system: a study of rotary chair, computerized dynamic posturography, and vestibular evoked myogenic potentials with children. J Am Acad Audiol. 2007;18:461–481. doi: 10.3766/jaaa.18.6.2. [DOI] [PubMed] [Google Scholar]
- 47.Wang SJ, Hsieh WS, Young YH. Development of ocular vestibular-evoked myogenic potentials in small children. Laryngoscope. 2013;123:512–517. doi: 10.1002/lary.23535. [DOI] [PubMed] [Google Scholar]
- 48.Weber KP, Rosengren SM, Michels R, et al. Single motor unit activity in human extraocular muscles during the vestibulo-ocular reflex. J Physiol. 2012;590:3091–3101. doi: 10.1113/jphysiol.2011.226225. [DOI] [PMC free article] [PubMed] [Google Scholar]
- 49.Welgampola MS, Colebatch JG. Vestibulocollic reflexes: normal values and the effect of age. Clin Neurophysiol. 2001;112:1971–1979. doi: 10.1016/s1388-2457(01)00645-9. [DOI] [PubMed] [Google Scholar]
- 50.Whitney SL, Marchetti GF, Pritcher M, et al. Gaze stabilization and gait performance in vestibular dysfunction. Gait Posture. 2009;29:194–198. doi: 10.1016/j.gaitpost.2008.08.002. [DOI] [PMC free article] [PubMed] [Google Scholar]