

Abstract
We report on a fast and simple method to produce highly stable isopropanol/water (4:1) suspensions of few‐layer antimonene by liquid‐phase exfoliation of antimony crystals in a process that is assisted by sonication but does not require the addition of any surfactant. This straightforward method generates dispersions of few‐layer antimonene suitable for on‐surface isolation. Analysis by atomic force microscopy, scanning transmission electron microscopy, and electron energy loss spectroscopy confirmed the formation of high‐quality few‐layer antimonene nanosheets with large lateral dimensions. These nanolayers are extremely stable under ambient conditions. Their Raman signals are strongly thickness‐dependent, which was rationalized by means of density functional theory calculations.
Keywords: antimonene, atomic force microscopy, liquid-phase exfoliation, Raman spectroscopy, two-dimensional materials
Currently, two‐dimensional (2D) materials represent one of the most active research areas.1 Apart from various well‐stablished 2D materials, such as graphene, h‐BN, and MoS2, black phosphorus (BP) has received considerable attention over the last two years.2 This is due to the fact that whereas graphene is a non‐band‐gap material and transition‐metal dichalcogenides have a relatively large band gap for certain optoelectronic applications (1.5–2.5 eV),3 the direct band gap of few‐ and single‐layer BP is approximately 1.5 eV,4 and this material therefore has appealing properties for electronic and ultrafast optoelectronic applications. However, isolated layers of BP are extremely sensitive to the surroundings, and strongly degrade upon air exposure, which limits their application.2b Thus the discovery of new 2D materials with an appropriate band gap and stability under ambient conditions is a challenge of utmost importance.
Along this front, antimony is a good candidate as it is in the same group in the periodic table as phosphorus and exhibits an allotrope closely related to BP (Figure 1 a). Indeed, theoretical calculations5 have estimated the band gap for a single layer of antimony, or antimonene (we should point out that the name antimonene is not completely correct as there are no double bonds in its structure), to be about 1.2 eV. Antimonene has recently been isolated by mechanical exfoliation, and showed good stability under ambient conditions.6 As for other 2D materials, micromechanical exfoliation provides high‐quality flakes but is unsuitable for mass production. Liquid phase exfoliation (LPE) has been successfully applied to generate single‐ or few‐layer (FL) samples of several 2D materials on large scale,7 including stable suspensions of few‐layer BP.8
Figure 1.
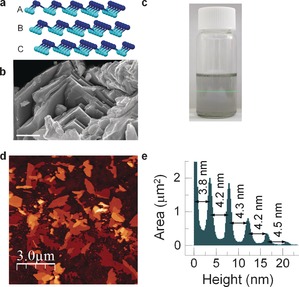
a) Structure of β‐antimonene. b) SEM image of a layered antimony crystal (scale bar: 1 μm). c) Photograph of a dispersion of exfoliated FL antimonene showing the Faraday–Tyndall effect. d) Topographic AFM image of few‐layer antimonene drop‐casted onto SiO2 showing flakes with micrometer lateral dimensions (scale bar: 3 μm). e) Height histogram of the image in (d) where the different thicknesses of the terraces can be readily seen. For the sake of clarity, the substrate peak has been cut to 2.5 μm2. The constant minimum thickness of about 4 nm can be easily observed.
Herein, we demonstrate that sonication of antimony crystals in a 4:1 isopropanol/water mixture without any surfactant produces a very stable suspension of micrometer‐large FL antimonene over weeks, even under ambient conditions (see the Supporting Information for details). High‐quality, few‐layer antimonene nanosheets can thus be produced by liquid‐phase exfoliation. Remarkably, the FL antimonene suspensions and the layers isolated on surfaces are very stable, even for weeks, under ambient conditions.
LPE of antimony crystals (see Figure 1 a for their structure) was carried out by sonication of ground antimony crystals (see Figure 1 b for a scanning electron microscopy (SEM) image) in 4:1 iPrOH/water for 40 min at 400 W and 24 kHz, which yielded a colorless dispersion (Figure 1 c), showing the Faraday–Tyndall effect. Non‐exfoliated material was removed by centrifugation at 3000 rpm (845 rcf) for 3 min to produce a stable dispersion with a concentration of about 1.74×10⁻³ g L−1, as determined by atomic absorption spectroscopy (see the Supporting Information for a detailed analysis of the preparation conditions as well as information concerning solvent selection, optimization of the experimental exfoliation, centrifugation parameters, and UV/Vis spectroscopy).
Exfoliation of the antimony crystals was readily confirmed by atomic force microscopy (AFM). Figure 1 d shows a characteristic topographic image of FL antimonene flakes isolated on SiO2 substrates (see the Supporting Information, Figure S6 for more AFM images). As reflected in the height histogram of the image (Figure 1 e), the step heights are multiples of about 4 nm. Furthermore, the flakes do not show the typical terrace characteristics of layered materials but well‐defined structures with all heights being multiples of about 4 nm (Figures 1 d, e, 2 b, and S7). As it is well‐known that the apparent AFM heights of layers obtained by LPE can be overestimated because of residual solvent8, 9 as well as contributions from effects such as capillary and adhesion forces,10 it seems likely that the apparent mono/bilayer thickness is about 4 nm. The overall lateral dimensions of the isolated nanosheets are greater than 1–3 μm2 (see Figure S4 for a statistical analysis). Transmission electron microscopy (TEM) measurements further confirmed the success of the exfoliation (Figure S11).
Figure 2.
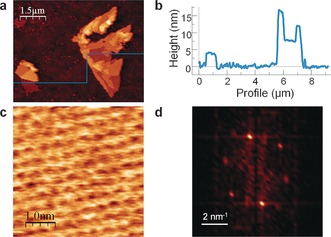
a) AFM topography showing several FL antimonene flakes with terraces of different heights. b) Height profile along the horizontal line of the image in (a) where the different thicknesses of the terraces can be readily seen. The minimum step height is about 4.0 nm. c) AFM image showing the atom periodicity. d) Fast Fourier transform (FFT) image taken from (c), showing the agreement with a hexagonal lattice as expected for β‐antimony.
A high‐resolution AFM topographic image taken of the lowest terrace (ca. 4 nm) of the isolated flake shown in Figure 2 a exhibits an atomic periodicity in line with that expected for β‐antimony (Figure 2 c). To obtain insight into the stability of the nanosheets, atomic periodicity images were taken after exposing the flake to atmospheric conditions for more than two weeks, which confirmed the outstanding stability of few‐layer antimonene under these ambient conditions (Figure S8).
Moreover, the Fourier transforms obtained from the AFM topographic images revealed hexagonal symmetry as expected for β‐antimony, indicating excellent crystal quality. This finding is consistent with the results of other real‐space techniques with atomic resolution (Figure S11). Aberration‐corrected scanning transmission electron microscopy (STEM) combined with electron energy loss spectroscopy (EELS) was used to investigate the local structure and chemistry of the flakes. Figure 3 a shows a low‐magnification high angle annular dark field (HAADF) image of a flake (top left) along with an atomic‐resolution image of the crystal structure, both obtained at an acceleration voltage of 80 kV to prevent beam‐induced damage. This structure (Figure 3 a) agrees with that of β‐antimony along the [0 −1 2] direction. The samples were crystalline, and no major defects were observed. Compositional maps were obtained from the EEL spectra including the C K, Ca L2,3, O K, and Sb M4,5 absorption edges. Whereas little chemical inhomogeneity was detected within the flakes, the flake ends appeared to be somewhat damaged. A series of such maps from areas near the edges are shown in Figures 3 b and S8. Whereas a homogeneously distributed Sb signal was observed, a significant C signal was present within a few nanometers of the sample edge, pointing to some degree of surface contamination. Similarly, traces of O and Ca were detected within tens of nanometers from the edges, which is very likely due to the same reason (Ca is present because of solvent contamination).
Figure 3.
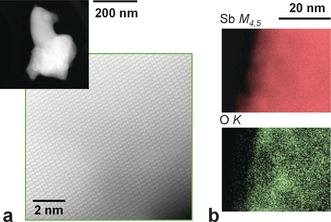
a) Low‐magnification HAADF image of a flake (top left) along with an atomic‐resolution image (image taken along the [0 −1 2] direction). b) Two‐dimensional EELS maps acquired near the edge of the flake, showing the signals below the Sb M4,5 (red) and O K (green) absorption edges.
Raman spectroscopy is a powerful method commonly used for the characterization of 2D materials. The Raman spectrum of bulk antimony when excited off resonance (λ=532 nm) exhibits two main phonon peaks (the A1g mode at 149.8 cm−1 and Eg mode at 110 cm−1).11 Correlation of AFM and statistical Raman microscopy (SRM)12 in a polydisperse sample revealed that flakes with an apparent thickness below about 70 nm (ca. 17 layers) hardly show any measurable Raman signal (Figure 4 b). This unexpected dependence of the Raman intensity on the flake thickness is similar to that previously observed for micromechanically exfoliated flakes of antimony and analogous to what has been reported for mica nanosheets.6, 13 Indeed, Figure 4 b shows a series of single‐point spectra measured at different positions, showing decreases in the peak intensities with a decrease in thickness. For comparison, we studied the influence of the laser excitation wavelength on a micromechanically exfoliated flake with a size of about 5.5 μm and a thickness of 10 nm, which had previously been analyzed by AFM, after its relocation in a Raman microscope by optical microscopy (see the Supporting Information and Figure S13 for additional information). As expected for this thickness, no Raman signal was detected, even after increasing the acquisition time and using different laser excitation wavelengths (λ ex=785, 633, 532, 473, 457, and 405 nm; Figure S11). However, the thinner flakes can be clearly located by SRM by monitoring the decrease in the silicon characteristic peak at about 521 cm−1 (Figure S15).
Figure 4.
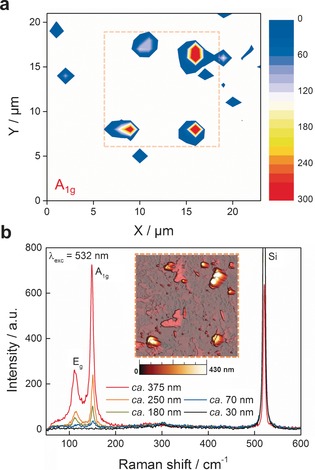
a) A1g intensity Raman mapping of solvent‐exfoliated flakes deposited on a SiO2/Si substrate, showing the presence of several flakes. b) Single‐point spectra measured at different thicknesses according to the topographic AFM image (inset) of the same area studied in (a). The dashed square corresponds to the position of the AFM image shown in (b).
To complement our experimental results, we calculated the theoretical phonon spectra of bulk and few‐layer antimony. We thus modeled the β‐phase of bulk Sb, which consists of buckled quasi‐2D layers of Sb in an ABC‐type sequence (space group R̄3m). For the primitive cell with rhombohedral axes and two atoms, this structure yields three optical modes, which are all Raman active: A pair of degenerate modes of Eg symmetry, which corresponds to the in‐plane transversal and longitudinal vibrations of the sublayers in opposite directions, gives rise to the experimentally observed Raman peak at 100 cm−1. The peak at 150 cm−1 is caused by the third mode, opposite‐in‐phase out‐of‐plane vibrations of the sublayers of A1g symmetry. Our calculations underestimated both frequencies by about 9 %, and we obtained values of 88 and 137 cm−1. This softening of the optical phonons in DFT calculations has been observed before,14 and appears to be related to the strong electron–lattice interaction and the negative Grüneisen parameter in antimony11 and similar materials, such as bismuth.
For the few‐layer system, our calculations predict a strong contraction of the in‐plane lattice constant compared to the bulk material (a=4.3 Å) when the film thickness is decreased to a trilayer (a=4.19 Å), bilayer (a=4.15 Å), and monolayer (a=4.01 Å). As a result, the frequency of the bulk Eg mode gradually increases from 88 to 167 cm−1 in monolayer Sb. In a similar fashion, the bulk A1g mode is blue‐shifted with a decrease in film thickness, although to a smaller extent owing to the lower sensitivity of the out‐of‐plane modes to the in‐plane lattice constant. In fact, the frequency increased from 137 cm−1 in the bulk to 208 cm−1 for the monolayer (1L) system. Interestingly, in the bilayer (2L) case, the frequencies of the Eu and A2u modes are higher than those of the corresponding Eg and A1g modes. This seems counterintuitive as the sublayers oscillate in phase with their counterparts in the other layers for the Eu and A1g modes (see the atomic displacement patterns in Figure 5). As a result, the intra‐layer bond lengths do not change and should thus not contribute to the excitation energy of the vibration. However, it is possible that the Raman active Eg and A1g modes benefit from energy compensation compared to the Eu and A2u modes, for example, through strengthening of the weak covalent interlayer bonds through periodic expansion and contraction. We observed a similar effect for the trilayer system.
Figure 5.
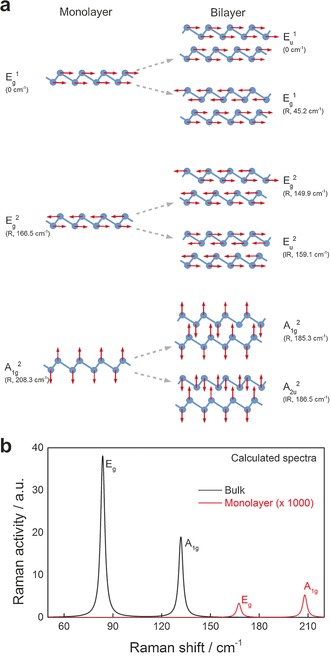
a) Atomic displacement patterns for the G point phonon modes in monolayer antimony (left) and the corresponding vibrations in the bilayer material (right). The Eg and Eu modes are doubly degenerate, and each mode has a partner mode (not shown) of the same frequency, with atoms vibrating perpendicularly to the plane of the paper. The out‐of‐plane acoustic A2u 1 mode in monolayer Sb gives rise to two additional modes in the bilayer structure, the acoustic A2u 1 and the optical A1g 1 mode (both not shown). The calculated frequencies and Raman (R) or infrared (IR) activity are indicated in parentheses. b) Calculated Raman spectra for bulk antimony and single‐layer antimonene. According to the experimental observations, the Raman signals for a monolayer are of very low intensity (>1000 times less Raman active than for the bulk counterpart), precluding its detection.
We also calculated the non‐resonant Raman intensities for the monolayer and bulk systems (Figure 5 c).15 Within the applied approximations, our calculations suggest a strong influence of the thickness on the simulated Raman activity, which decreases by about three orders of magnitude from bulk to monolayer Sb, which explains the experimentally observed absence of Raman signals in the thinnest flakes (Figure 4 b). This behavior is in stark contrast to that of BN, for example, where the dependence of the predicted Raman tensor on the layer number is weak. It is thus possible that the experimentally observed suppression of Raman activity in Figure 4 b for samples of sub‐micrometer thickness has a contribution from a qualitative change in light–phonon coupling that is due to the decreasing layer number. We believe that this hypothesis warrants further investigation (see the Supporting Information for computational details and Tables with lattice constants and calculated frequencies).
The Raman results suggest that the isolated antimony nanosheets clearly consist of only few layers, as no Raman signal was observed for nanosheets with an AFM height of 30 nm. This implies that these nanosheets have a thickness of about 60 layers, assuming a theoretical thickness of about 0.5 nm for the antimony layers. In view of the theoretical calculations and experiments, it seems very unlikely to observe an impact on Raman spectra for nanosheets with a thickness over 60 layers. The Raman analysis therefore suggests that the apparent AFM thickness of about 4 nm could correspond to a single layer or bilayer of antimony.
In summary, we have reported on a procedure to generate very stable suspensions of high‐quality single/few‐layer antimonene. Moreover, we have described the thickness‐dependent Raman behavior of antimonene, defining the most important fingerprints for its Raman spectroscopic analysis. The scalable and environmentally friendly approach for isolating few‐layer antimonene in aqueous solution will pave the way for the development of new antimonene‐based technologies.
Supporting information
As a service to our authors and readers, this journal provides supporting information supplied by the authors. Such materials are peer reviewed and may be re‐organized for online delivery, but are not copy‐edited or typeset. Technical support issues arising from supporting information (other than missing files) should be addressed to the authors.
Supplementary
Acknowledgements
We thank MINECO (Spain) for financial support through the “María de Maeztu” Programme for Units of Excellence in R&D (MDM‐2014‐0377) and the projects CSD2010‐0024, MAT2013‐46753‐C2‐1‐P, and ‐2‐P as well as MAT2015‐66888‐C3‐3‐R. Co‐funding from UE is also acknowledged. The research leading to these results has received partial funding from the European Union's Seventh Framework Programme (604391, “Graphene Flagship”). Financial support from the Fundación BBVA is gratefully acknowledged. Electron microscopy studies were carried out at the Centro Nacional de Microscopía Electrónica, Universidad Complutense de Madrid. We thank J. Garcia for support with the TEM measurements. The computation resources used for the simulations in this work were provided by the North‐German Supercomputing Alliance (HLRN, bep00047). J.M. gratefully acknowledges support by the European Research Council (ERC, 259286) and by the SPP 1459 “Graphene” of the DFG. G.A. thanks the EU for a Marie Curie Fellowship (FP7/2013‐IEF‐627386).
C. Gibaja, D. Rodriguez-San-Miguel, P. Ares, J. Gómez-Herrero, M. Varela, R. Gillen, J. Maultzsch, F. Hauke, A. Hirsch, G. Abellán, F. Zamora, Angew. Chem. Int. Ed. 2016, 55, 14345.
Contributor Information
Dr. Gonzalo Abellán, Email: gonzalo.abellan@fau.de
Dr. Félix Zamora, Email: felix.zamora@uam.es
References
- 1.
- 1a. Tang Q., Zhou Z., Prog. Mater. Sci. 2013, 58, 1244–1315; [Google Scholar]
- 1b. Tang Q., Zhou Z., Chen Z. F., Wires Comput. Mol. Sci. 2015, 5, 360–379; [Google Scholar]
- 1c. Mas-Ballesté R., Gomez-Navarro C., Gomez-Herrero J., Zamora F., Nanoscale 2011, 3, 20–30; [DOI] [PubMed] [Google Scholar]
- 1d. Geim A. K., Science 2009, 324, 1530–1534; [DOI] [PubMed] [Google Scholar]
- 1e. Novoselov K. S., Fal'ko V. I., Colombo L., Gellert P. R., Schwab M. G., Kim K., Nature 2012, 490, 192–200; [DOI] [PubMed] [Google Scholar]
- 1f. Ferrari A. C. et al., Nanoscale 2015, 7, 4598–4810; [DOI] [PubMed] [Google Scholar]
- 1g. Chhowalla M., Shin H. S., Eda G., Li L. J., Loh K. P., Zhang H., Nat. Chem. 2013, 5, 263–275; [DOI] [PubMed] [Google Scholar]
- 1h. Wang Q., O'Hare D., Chem. Rev. 2012, 112, 4124–4155. [DOI] [PubMed] [Google Scholar]
- 2.
- 2a. Castellanos-Gomez A., J. Phys. Chem. Lett. 2015, 6, 4873–4873; [DOI] [PubMed] [Google Scholar]
- 2b. Ling X., Wang H., Huang S. X., Xia F. N., Dresselhaus M. S., Proc. Natl. Acad. Sci. USA 2015, 112, 4523–4530. [DOI] [PMC free article] [PubMed] [Google Scholar]
- 3. Wang Q. H., Kalantar-Zadeh K., Kis A., Coleman J. N., Strano M. S., Nat. Nanotechnol. 2012, 7, 699–712. [DOI] [PubMed] [Google Scholar]
- 4. Tan C., Zhang H., Chem. Soc. Rev. 2015, 44, 2713–2731. [DOI] [PubMed] [Google Scholar]
- 5.
- 5a. Zhang S., Yan Z., Li Y., Chen Z., Zeng H., Angew. Chem. Int. Ed. 2015, 54, 3112–3115; [DOI] [PubMed] [Google Scholar]; Angew. Chem. 2015, 127, 3155–3158; [Google Scholar]
- 5b. Aktürk O. Ü., Özçelik V. O., Ciraci S., Phys. Rev. B 2015, 91, 235446. [Google Scholar]
- 6. Ares P., Aguilar-Galindo F., Rodríguez-San-Miguel D., Aldave D. A., Díaz-Tendero S., Alcamí M., Martín F., Gómez-Herrero J., Zamora F., Adv. Mater. 2016, 28, 6332–6336. [DOI] [PubMed] [Google Scholar]
- 7.
- 7a. Nicolosi V., Chhowalla M., Kanatzidis M. G., Strano M. S., Coleman J. N., Science 2013, 340, 1226419; [Google Scholar]
- 7b. Coleman J. N., Acc. Chem. Res. 2013, 46, 14–22. [DOI] [PubMed] [Google Scholar]
- 8. Hanlon D., Backes C., Doherty E., Cucinotta C. S., Berner N. C., Boland C., Lee K., Harvey A., Lynch P., Gholamvand Z., Zhang S. F., Wang K. P., Moynihan G., Pokle A., Ramasse Q. M., McEvoy N., Blau W. J., Wang J., Abellan G., Hauke F., Hirsch A., Sanvito S., O'Regan D. D., Duesberg G. S., Nicolosi V., Coleman J. N., Nat. Commun. 2015, 6, 8563. [DOI] [PMC free article] [PubMed] [Google Scholar]
- 9. Paton K. R., Varrla E., Backes C., Smith R. J., Khan U., O'Neill A., Boland C., Lotya M., Istrate O. M., King P., Higgins T., Barwich S., May P., Puczkarski P., Ahmed I., Moebius M., Pettersson H., Long E., Coelho J., O'Brien S. E., McGuire E. K., Sanchez B. M., Duesberg G. S., McEvoy N., Pennycook T. J., Downing C., Crossley A., Nicolosi V., Coleman J. N., Nat. Mater. 2014, 13, 624–630. [DOI] [PubMed] [Google Scholar]
- 10. Nemes-Incze P., Osvath Z., Kamaras K., Biro L. P., Carbon 2008, 46, 1435–1442. [Google Scholar]
- 11. Wang X., Kunc K., Loa I., Schwarz U., Syassen K., Phys. Rev. B 2006, 74, 134305. [Google Scholar]
- 12.
- 12a. Hof F., Bosch S., Englert J. M., Hauke F., Hirsch A., Angew. Chem. Int. Ed. 2012, 51, 11727–11730; [DOI] [PubMed] [Google Scholar]; Angew. Chem. 2012, 124, 11897–11900; [Google Scholar]
- 12b. Englert J. M., Vecera P., Knirsch K. C., Schäfer R. A., Hauke F., Hirsch A., ACS Nano 2013, 7, 5472–5482. [DOI] [PubMed] [Google Scholar]
- 13. Castellanos-Gomez A., Wojtaszek M., Tombros N., Agrait N., van Wees B. J., Rubio-Bollinger G., Small 2011, 7, 2491–2497. [DOI] [PubMed] [Google Scholar]
- 14. Campi D., Bernasconi M., Benedek G., Phys. Rev. B 2012, 86, 075446. [Google Scholar]
- 15. Porezag D., Pederson M. R., Phys. Rev. B 1996, 54, 7830–7836. [DOI] [PubMed] [Google Scholar]
Associated Data
This section collects any data citations, data availability statements, or supplementary materials included in this article.
Supplementary Materials
As a service to our authors and readers, this journal provides supporting information supplied by the authors. Such materials are peer reviewed and may be re‐organized for online delivery, but are not copy‐edited or typeset. Technical support issues arising from supporting information (other than missing files) should be addressed to the authors.
Supplementary