

Abstract
Although CD8+ T cells have been implied in the pathogenesis of multiple sclerosis (MS), the molecular mechanisms mediating CD8+ T‐cell migration across the blood–brain barrier (BBB) into the central nervous system (CNS) are ill defined. Using in vitro live cell imaging, we directly compared the multistep extravasation of activated CD4+ and CD8+ T cells across primary mouse brain microvascular endothelial cells (pMBMECs) as a model for the BBB under physiological flow. Significantly higher numbers of CD8+ than CD4+ T cells arrested on pMBMECs under noninflammatory and inflammatory conditions. While CD4+ T cells polarized and crawled prior to their diapedesis, the majority of CD8+ T cells stalled and readily crossed the pMBMEC monolayer preferentially via a transcellular route. T‐cell arrest and crawling were independent of G‐protein‐coupled receptor signaling. Rather, absence of endothelial ICAM‐1 and ICAM‐2 abolished increased arrest of CD8+ over CD4+ T cells and abrogated T‐cell crawling, leading to the efficient reduction of CD4+, but to a lesser degree of CD8+, T‐cell diapedesis across ICAM‐1null/ICAM‐2−/− pMBMECs. Thus, cellular and molecular mechanisms mediating the multistep extravasation of activated CD8+ T cells across the BBB are distinguishable from those involved for CD4+ T cells.
Keywords: Adhesion, Blood‐brain barrier, Crawling, Diapedesis, Stalling, T cells
Introduction
Multiple sclerosis (MS) is the most common inflammatory demyelinating disease of the central nervous system (CNS). The etiology of the disease remains a subject of debate especially as distinct subtypes of this disease exist with regard to progression, severity of various neurological symptoms, and histopathological presentation 1. The anti‐inflammatory and immunosuppressive therapies available at present delay the course of some forms of the disease and support the notion of an underlying autoimmune pathogenesis.
Much of our current understanding about the pathogenesis of MS has been derived from its animal model experimental autoimmune encephalomyelitis (EAE). The classical EAE models rely on immunization with CNS‐derived autoantigens emulsified in aggressive immune adjuvants, thereby favoring the activation of CD4+ T cells and the induction of autoantibodies. Both, CD4+ Th1 cells and Th17 cells (summarized by 2) and more recently also GM‐CSF granulocyte macrophage colony stimulating factor producing CD4+ T‐cell subsets 3 have been shown to play key pathogenic roles in triggering EAE.
In MS itself, however, accumulating evidence suggests that the role of CD8+ T cells in the autoimmune attack has been largely underestimated until recently 4. Indeed, CD8+ T cells accumulate within white matter lesions, where they often outnumber CD4+ T cells and are found in close association with oligodendrocytes and demyelinated axons 5, 6. In addition, CD8+ T cells harboring an effector memory phenotype were shown to accumulate in the cerebrospinal fluid (CSF) and in the inflamed CNS of MS patients, and these cells exhibit cytotoxic and inflammatory potential as they express granzyme B and IFN‐γ at high frequency 7. More recently, CD8+ T cells were even detected in immune cell infiltrates in cortical demyelinating lesions, which are prevalent at early stages of MS 8 underscoring an involvement of CD8+ T cells at early time points of MS pathogenesis. Analyses of T‐cell receptor (TCR) usage by CNS infiltrating T cells provided evidence for oligoclonal expansion of CD8+ but not CD4+ T cells within MS lesions 9, 10 and the CSF 11, which is a likely consequence of their local major histocompatibility complex (MHC) class I dependent antigen‐driven activation. Furthermore, recent genetic studies showed a link between certain MHC class I alleles and MS susceptibility 12, 13, 14, 15. Collectively, these data suggest that CD8+ T‐cell clones with shared antigen specificity have migrated to the CNS independently and have locally responded to a given set of CNS antigens.
The migration of circulating autoagressive T cells into the CNS is a central step in the pathogenesis of MS and its animal model EAE. In order to access the CNS the T cells have to cross the endothelial blood–brain barrier (BBB). The BBB is localized at the level of CNS microvascular endothelial cells, which by strictly controlling the movement of molecules across their interface provide a protective barrier of the CNS toward the periphery 16. The BBB also establishes the interface between the immune system and the CNS and therefore closely controls immune cell migration into the CNS. Our current knowledge on immune cell trafficking across the BBB into the CNS during MS mostly relies on studies of the migration of encephalitogenic CD4+ T cells into the CNS in the context of the classical EAE models (reviewed in 17, 18). These studies combined with in vitro and in vivo live cell imaging studies have shown that the migration of encephalitogenic CD4+ T cells across the BBB is a multistep process orchestrated by the sequential interaction of distinct adhesion and signaling molecules 17. Probably accounting to the high specialization of the BBB endothelial cells, the interaction of encephalitogenic CD4+ T cells with the BBB is unique and characterized by a predominant involvement of α4β1‐integrin (VLA‐4) and the extended crawling of these T cells against the direction of blood flow on the luminal side of the BBB in search of sites for diapedesis 17, 19, 20. Therapeutic targeting of T‐cell migration across the BBB with the anti‐α4‐integrin antibody natalizumab has proven efficient in the treatment of relapsing‐remitting MS. As this treatment is associated with an increased risk for progressive multifocal leukoencephalopathy it has been suggested that therapeutic targeting of α4‐integrins interferes with CNS immunosurveillance by CD8+ T cells 21, 22.
To gain further insight into the molecular mechanisms guiding CD8+ T cells across the BBB, we made use of in vitro live cell imaging and directly compared the multistep extravasation of activated CD4+ and CD8+ T cells across the BBB under physiological flow 23, 24, 25, 26. We found subset‐specific usage of endothelial ICAM‐1 and ICAM‐2 in T‐cell arrest and crawling on the BBB under physiological flow leading to higher numbers of CD8+ versus CD4+ T cells crossing the BBB. In accordance to our previous findings activated CD4+ T cells were observed to arrest on the BBB largely independent of ICAM‐1 and ICAM‐2, and subsequently polarize and crawl in an ICAM‐1/ICAM‐2‐dependent manner to sites of diapedesis. In contrast, activated CD8+ T cells arrested in significantly higher numbers compared to CD4+ T cells on the BBB and the increased adhesive interaction was mediated by endothelial ICAM‐1 and ICAM‐2. Following their arrest CD8+ T cells instead of crawling rather remained stalled and rapidly crossed the BBB mostly via transcellular routes. Our study thus shows subset‐specific cellular and molecular mechanisms of activated CD8+ versus CD4+ T‐cell migration across the BBB. This suggests the possibility for developing alternative options for the therapeutic targeting of the migration of autoagressive T cells into the CNS allowing to specifically block CNS recruitment of destructive CD4+ or CD8+ T cells and leave the migration of protective immune cells into the CNS unaffected.
Results
Activated CD8+ T cells more efficiently arrest on pMBMECs than activated CD4+ T cells
We have previously shown the differential involvement of α4‐integrin/VCAM‐1 and of LFA‐1/ICAM‐1 in mediating the arrest, polarization, crawling, and diapedesis of encephalitogenic CD4+ T cells across the BBB 23, 26. Recent investigations have suggested similar mechanisms allowing for the migration of CD8+ T cells across the BBB 7, 27. This prompted us to side by side compare the dynamic interaction of activated CD8+ and CD4+ T cells with primary mouse brain microvascular endothelial cells (pMBMECs) as in vitro model of the BBB under physiological flow by live cell imaging 24. To this end, we chose to study CD8+ and CD4+ T‐cell subsets isolated from TCR transgenic OT1 and OT2 mice, respectively. This allowed for defined and homogenous in vitro antigen‐specific T‐cell activation as demonstrated by their ovalbumin (OVA) specific T‐cell proliferation profiles (Supporting Information Fig. 1) and the induction of a comparable yet not identical cell surface expression of adhesion molecules on the different CD8+ and CD4+ T‐cell lines established (Supporting Information Fig. 2A; Supporting Information Table 1).
To study their interaction with the BBB activated CD8+ and CD4+ T cells were alternately labeled with CellTracker Orange or CellTracker Green to avoid staining artifacts and subsequently mixed in a precise 1:1 ratio prior to their superfusion over pMBMEC monolayers under physiological flow. pMBMECs were either nonstimulated (NS) or stimulated with TNF‐α or TNF‐α+IFN‐γ to mimic the in vivo situation of CNS immunosurveillance and neuroinflammation, respectively. Under all conditions, we found the number of activated CD8+ T cells arresting on pMBMECs under flow to be significantly higher than the number of activated CD4+ T cells (Fig. 1 and Supporting Information Fig. 2B). Under NS conditions 38 ± 6 CD8+ T cells versus 13 ± 2 CD4+ T cells per field of view (FOV) were found to arrest on the pMBMECs under flow. After stimulation of pMBMECs with TNF‐α or TNF‐α+IFN‐γ arrest of both, CD8+ and CD4+ T cells was increased with 68 ± 9 or 75 ± 4 CD8+ T cells/FOV and 25 ± 3 or 44 ± 3 CD4+ T cells/FOV arrested on pMBMECs, respectively (Fig. 1).
Figure 1.
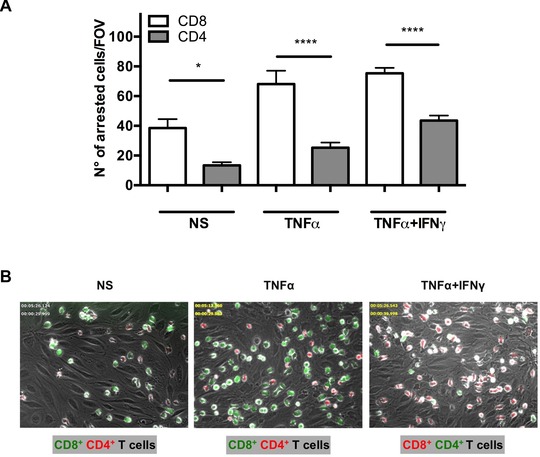
Activated CD8+ T cells arrest more efficiently than CD4+ T cells on stimulated and NS pMBMECs under physiological flow. Analysis of the postarrest CD4+ and CD8+ T‐cell interactions with NS, TNF‐α‐stimulated (TNF‐α) and TNF‐α and IFN‐γ (TNF‐α+IFN‐γ) stimulated pMBMECs under physiological flow was observed by live cell imaging over 20 min. (A) Mean numbers of arrested CD8+ versus CD4+ T cells per FOV (438 × 329 μm) perfused in a 1:1 ratio are shown on NS, TNF‐α‐stimulated, and TNF‐α+IFN‐γ costimulated pMBMECs. Data are shown as mean ± SEM (n = 9 experiments for NS, n = 9 for TNF‐α, n = 19 for TNF‐α+IFN‐γ). *p < 0.05, ****p < 0.00001 CD8+ versus CD4+ T cells. In addition, the increase in the number of arrested T cells on cytokine stimulated compared to NS pMBMECs was significant for CD8+ T cells for both TNF‐α (p < 0.01) and TNF‐α+IFN‐γ (p < 0.0001) stimulation, and for CD4+ T cells for stimulation with TNF‐α+IFN‐γ (p < 0.001). One‐way ANOVA, followed by the Tukey multiple comparison test. (B) Representative images from time‐lapse videos showing the arrested CellTrackerGreen (CMFDA) or CellTrackerOrange (CMTMR) labeled CD8+ versus CD4+ T cells on NS, TNF‐α‐stimulated and TNF‐α+IFN‐γ costimulated pMBMECs at 30 to 40 s after increase of the flow rate. Color of the CD8+ or CD4+ label indicates the CellTracker dye used for labeling the CD8+ and CD4+ T cells in this specific assay.
We next considered the influence of the TCR peptide/MHC affinity on increased CD8+ T cell over CD4+ T cell arrest on the BBB under physiological flow in vitro. To this end, we relied on the well characterized interaction of the OT1 TCR with OVA peptides harboring single amino acid differences that were shown to exhibit different stimulatory potencies on the OT1 cells 28. We confirmed that the peptide Q4 (SIIQFEKL) reported to have intermediate affinity interaction with the OT1 TCR 29 showed lower potency in activating OT1 cells (Supporting Information Fig. 2C). At the same time, it did not reduce arrest of OT1 cells on pMBMECs under physiological flow (Supporting Information Fig. 2D) excluding a direct role for TCR‐peptide/MHC affinity in mediating enhanced arrest of CD8+ over CD4+ T cells on the BBB under physiological flow in vitro.
Taken together, shear‐resistant arrest of activated CD8+ T cells was found to be significantly more efficient than that of activated CD4+ T cells under noninflamed and inflamed conditions.
Postarrest stalling rather than crawling favors CD8+ T‐cell diapedesis across pMBMECs
In accordance to our previous observations on encephalitogenic CD4+ T cells 23 the activated CD4+ T cells in this study readily polarized after shear‐resistant arrest and started to crawl over the pMBMEC monolayers.
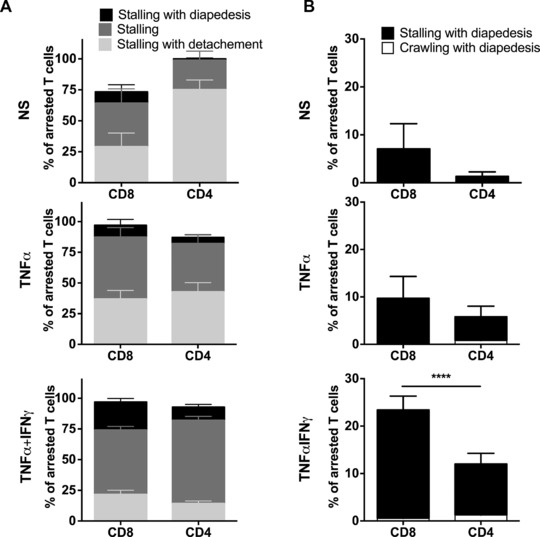
To determine the impact of the distinct postarrest behavior of CD8+ versus CD4+ T cells on pMBMECs on their ability to migrate across the in vitro BBB under flow we performed a visual frame‐by‐frame offline analysis of the time‐lapse videos, in which we quantified the dynamic behavior of CD4+ and CD8+ T cells arrested on NS, TNF‐α, and TNF‐α+IFN‐γ‐stimulated pMBMECs. The number of initially arrested CD4+ and CD8+ T cells on the respective pMBMECs were set to 100% and each category was expressed as the fraction of arrested T cells (Fig. 2B). T cells were either crawling or stalling after shear‐resistant arrest on pMBMECs. The term “stalling” was specifically chosen to describe the behavior of those T cells that, following shear‐resistant arrest on pMBMECs, remained within their diameter but visibly and actively probed the endothelium for sites of diapedesis. Still, stalling was not an “inability” of these T cells to crawl as once beneath the monolayer those T cells were observed to crawl. While on NS and on TNF‐α‐stimulated pMBMECs 51 ± 9% and 54 ± 7% of CD4+ T cells, respectively, were observed to crawl, stimulation of pMBMECs with TNF‐α+IFN‐γ reduced the percentage of CD4+ T cells crawling on the pMBMECs to 30 ± 3% (Fig. 2B; Supporting Information Videos 1–3). At the same time the percentage of CD4+ T cells observed to stall after arresting changed accordingly with 49 ± 9% and 46 ± 7% of CD4+ T cells on NS and TNF‐α‐stimulated pMBMECs, respectively, and 70 ± 3% of CD4+ T cells after stimulation with TNF‐α+IFN‐γ (Fig. 2B; Supporting Information Videos 1–3).
Figure 2.
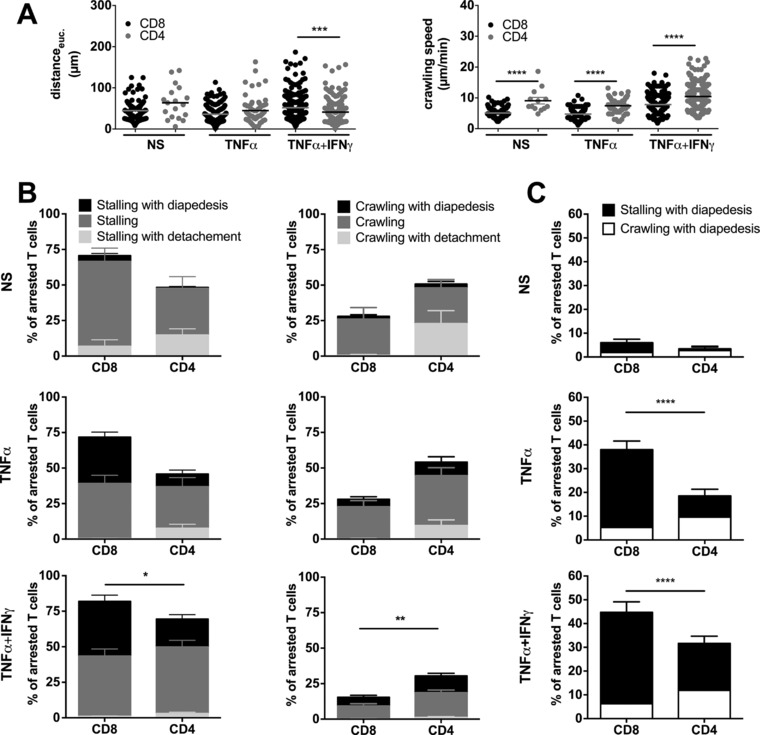
Postarrest dynamic interaction of CD8+ T cells with pMBMECs is distinct from that of CD4+ T cells. Analysis of the postarrest CD4+ and CD8+ T‐cell interactions with NS, TNF‐α‐stimulated (TNF‐α) and TNF‐α and IFN‐γ (TNF‐α+IFN‐γ) stimulated pMBMECs under physiological flow was observed by live cell imaging over 20 min. (A) Euclidean distance μm (left) and T‐cell crawling speed (μm/min) (right) were calculated from T‐cell tracks of at least nine independent movies per condition. CD8+ T cells are shown as black symbols and CD4+ T cells as grey symbols. Normality testing was performed with D'Agostino and Pearson normality test (omnibus K2) before differences between the stalling and crawling fraction were analyzed with the one‐way ANOVA, followed by the Tukey multiple comparison test. (B) Each T cell was assigned to one of six categories that are shown in the staple bars as follows: Stalling with diapedesis (left, black), stalling (left, dark grey) and stalling with detachment (left, light grey); crawling with diapedesis (right, black), crawling (right, dark grey) and crawling with detachment (right, light grey). The number of arrested T cells per FOV was set to 100% and the six categories are displayed in percent as fraction of arrested T cells. Bars show means ± SEM (n = 9 for NS, n = 9 for TNF‐α, n = 22 for TNF‐α+IFN‐γ). p values displayed indicate the combined differences between crawling CD8+ versus CD4+ T cells or stalling CD8+ versus CD4+ T cells. *p < 0.05;**p < 0.01. Normality testing was performed with D'Agostino and Pearson normality test (omnibus K2) before differences between the stalling and crawling fraction were analyzed with the two‐way ANOVA, followed by the Tukey multiple comparison test. Accompanying movies are provided as Supporting Information Videos 1–3). (C) Percentage of overall CD4+ and CD8+ T‐cell diapedesis irrespective of prior crawling or stalling is shown. p values compare the diapedesis rate of stalling CD4+ and CD8+ T cells. One‐way ANOVA, followed by the Tukey multiple comparison test. ****p < 0.00001.
In contrast to CD4+ T cells and irrespective of the presence or absence of inflammatory stimuli applied to pMBMECs, only a minority of arrested CD8+ T cells started to crawl on the pMBMEC monolayers. Rather the majority, namely 72 ± 8% of CD8+ T cells stalled on the pMBMEC monolayers already under noninflammatory conditions. Similarly, after stimulation of pMBMECs with TNF‐α or TNF‐α+IFN‐γ, 72 ± 5% or 82 ± 3% of CD8+ T cells, respectively, stalled on the pMBMEC monolayers (Fig. 2B; Supporting Information Videos 1–3).
Next, we determined the crawling speed and crawling distance of CD4+ and CD8+ T cells on NS and TNF‐α or TNF‐α+IFN‐γ‐stimulated pMBMECs. On the surface of NS pMBMECs the crawling speed of CD4+ T cells compared to CD8+ T cells was 9.1 ± 1.1 μm/min versus 5.1 ± 0.1 μm/min (p < 0.0001) (Fig. 2A). On pMBMECs stimulated with TNF‐α and TNF‐α+IFN‐γ CD4+ T cells crawled with a speed of 7.4 ± 0.3 μm/min and 10.5 ± 0.3 μm/min while the crawling speed of CD8+ T cells was 4.7 ± 0.3 μm/min and 7.8 ± 0.2 μm/min, respectively (p < 0.0001). The Euclidean distance reached by crawling CD4+ T cells during the 20 min observation time on NS or TNF‐α‐stimulated pMBMECs was longer than the Euclidean distance crawled by CD8+ T cells. However, on TNF‐α+IFN‐γ pMBMECs, CD4+ T cells crawled significantly shorter Euclidean distances (41.1 ± 1.7 μm) than CD8+ T cells (51.8 ± 2.0 μm, p = 0.0004, Fig. 2A). Taken together, CD4+ T cells crawled significantly faster than CD8+ T cells (Fig. 2A).
In order to understand how the difference in crawling influenced CD4+ and CD8+ T‐cell diapedesis across the BBB in vitro we next assigned each arrested CD4+ and CD8+ T cell to one of the following six groups: (i) Stalling T cells detaching during the observation period, (ii) T cells remaining stalled, (iii) stalling T cells that crossed the pMBMEC monolayer in the observation period, (iv) T cells that crawled and detached, (v) T cells that crawled for the entire observation period, and finally (vi) T cells that crossed the pMBMEC monolayer after crawling (Supporting Information Video 3). Interestingly, stalling behavior rather than crawling facilitated CD8+ T‐cell diapedesis across the BBB under flow. While under NS conditions the diapedesis rate of stalling CD4+ and CD8+ T cells was low and did not differ significantly, stimulation of pMBMECs with TNF‐α or TNF‐α+IFN‐γ led to a significantly increased proportion of stalling CD8+ compared to CD4+ T cells that crossed the pMBMEC monolayers (Fig. 2C). Specifically, under noninflammatory conditions 4 ± 1% of arrested CD8+ versus 1 ± 1% of arrested CD4+ T cells were observed to cross the pMBMEC monolayers. After stimulation with TNF‐α, 33 ± 4% versus 9 ± 3% stalled CD8+ and CD4+ T cells, respectively, and after stimulation with TNF‐α+IFN‐γ, 39% ± 4% versus 20 ± 3% stalled CD8+ and CD4+ T cells, respectively, crossed the pMBMEC monolayers (Fig. 2C; Supporting Information Videos 1–3). In contrast, the percentage of CD4+ T cells undergoing diapedesis subsequent to crawling was higher than that of crawling CD8+ T cells (Fig. 2B and C). Taken together, these observations demonstrate that postarrest behavior of activated CD8+ T cells on pMBMECs under flow is distinct from that of activated CD4+ T cells leading in total to a significantly higher percentage of stalling but not crawling CD8+ T cells crossing the pMBMEC monolayers during the observation period when compared to CD4+ T cells (Fig. 2C).
As stalling behavior seemed to increase the diapedesis of CD8+ versus CD4+ T cells across pMBMEC monolayers we next asked if crawling of CD8+ and CD4+ T cells delays their diapedesis across the BBB. To this end, we determined the time between shear‐resistant T‐cell arrest on the pMBMEC monolayer and the start of CD4+ or CD8+ T‐cell diapedesis across inflamed pMBMECs (Fig. 3). Due to too low number of diapedesis events observed across NS pMBMECs this could not be evaluated under NS conditions. However, on TNF‐α and TNF‐α+IFN‐γ‐stimulated pMBMECs stalled CD8+ T cells started diapedesis significantly earlier than crawling CD8+ T cells (Fig. 3A) underscoring the notion that stalling behavior of the CD8+ T cells accelerates their diapedesis across the BBB. On TNF‐α+IFN‐γ‐stimulated but not on TNF‐α‐stimulated pMBMECs we could observe a similar behavior for activated CD4+ T cells, with stalling CD4+ T cells starting diapedesis significantly earlier than those that crawled prior to diapedesis (Fig. 3A). Interestingly, the duration of diapedesis of crawling CD4+ T cells was significantly shorter than that of stalling CD4+ T cells (Fig. 3B). In contrast, we observed no significant differences for the duration of the diapedesis process comparing stalling and crawling CD8+ T cells. Taken together these observations further support the notion that the stalling behavior of the CD8+ T cells shortened the time between arrest and their subsequent diapedesis across the pMBMEC monolayer when compared to CD4+ T cells.
Figure 3.
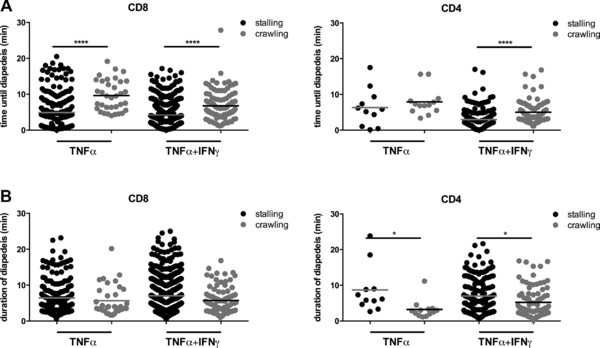
Stalling behavior of T cells shortens the time until start of diapedesis when compared to crawling T cells. Analysis of the time until and duration of diapedesis of CD4+ and CD8+ T cells across TNF‐α‐stimulated (TNF‐α) and TNF‐α and IFN‐γ (TNF‐α+IFN‐γ) stimulated pMBMECs under physiological flow observed by live cell imaging over 20 min and evaluated via a frame by frame offline analysis. Each data point represents a single CD8+ or CD4+ T cell.(A) Time after shear‐resistant arrest until the beginning of diapedesis is shown for CD8+ and CD4+ T cells on the surface of TNF‐α‐stimulated (TNF‐α) and TNF‐α+IFN‐γ‐stimulated (TNF‐α+IFN‐γ) pMBMECs. Filled black circles represent stalling and filled grey circles crawling T cells. Values are shown as mean and are pooled from at least nine independent videos per condition. (B) Duration of diapedesis is shown for CD8+ and CD4+ T cells on the surface of TNF‐α‐stimulated (TNF‐α) and TNF‐α+IFN‐γ‐stimulated (TNF‐α+IFN‐γ) pMBMECs. *p < 0.05; **p < 0.01; ***p < 0.001; ****p < 0.0001; One‐way ANOVA, followed by the Tukey multiple comparison test. For the condition NS no data are shown due to low number of events.
We next asked if stalling behavior of the T cells is induced by chemotactic factors bound to the luminal surface of the cytokine‐stimulated pMBMEC monolayer. To this end, we pretreated CD8+ and CD4+ T cells with pertussis toxin (PTX) allowing for the inhibition of Gαi‐dependent GPCR‐mediated inside‐out integrin activation on the T cells. Confirming previous observations by others 30 GPCR signaling was not required for the arrest and subsequent crawling of activated CD8+ and CD4+ T cells on TNF‐α/IFN‐γ‐stimulated pMBMECs (Supporting Information Fig. 3). In contrast, inhibition of GPCR signaling almost completely abrogated CD8+ and CD4+ T cell stalling on and diapedesis across the pMBMEC monolayers leading to significantly higher fractions of T cells crawling on the endothelial surface during the observation time (Supporting Information Fig. 3). Thus, postarrest stalling and diapedesis of both, activated CD8+ and CD4+ T cells strictly depend on signals from Gαi‐associated GPCRs. Importantly, shear‐resistant arrest of both, activated CD4+ and CD8+ T cells on pMBMECs was independent of GPCR signaling (Supporting Information Fig. 3).
Activated CD8+ T cells cross the pMBMEC monolayer preferentially via the transcellular route
We have previously shown that reduced crawling of encephalitogenic CD4+ T cells on IL‐1β‐stimulated ICAM‐1null/ICAM‐2−/− pMBMECs correlated with their preferential transcellular diapedesis 26. Considering the postarrest stalling of CD8+ T cells observed in the present study we therefore speculated that CD8+ T‐cell diapedesis occurs preferentially via a transcellular pathway. To investigate the cellular pathway of CD8+ T‐cell diapedesis we isolated pMBMECs from C57BL/6J knock‐in mice expressing a C‐terminal GFP fusion protein of VE cadherin in the endogenous VE cadherin locus (VE‐cadherin‐GFP, VE‐CadGFP pMBMECs), allowing to visualize the endothelial junctions in live pMBMECs and thus investigate the pathway of T‐cell diapedesis 25, 26. To determine paracellular from transcellular diapedesis, we defined diapedesis events that transiently interrupted the junctional GFP signal as paracellular diapedesis and those that did not as transcellular diapedesis. When analyzing the diapedesis of activated CD8+ T cells across TNF‐α+IFN‐γ‐stimulated pMBMECs we found that the majority (77%) crossed the pMBMEC monolayers via the transcellular pathway while the minority (23%) via the paracellular pathway (Fig. 4, Supporting Information Videos 4 and 5). Thus, activated CD8+ T cells are able to cross the inflamed BBB by both, the transcellular and paracellular route with a clear preference for the transcellular pathway.
Figure 4.
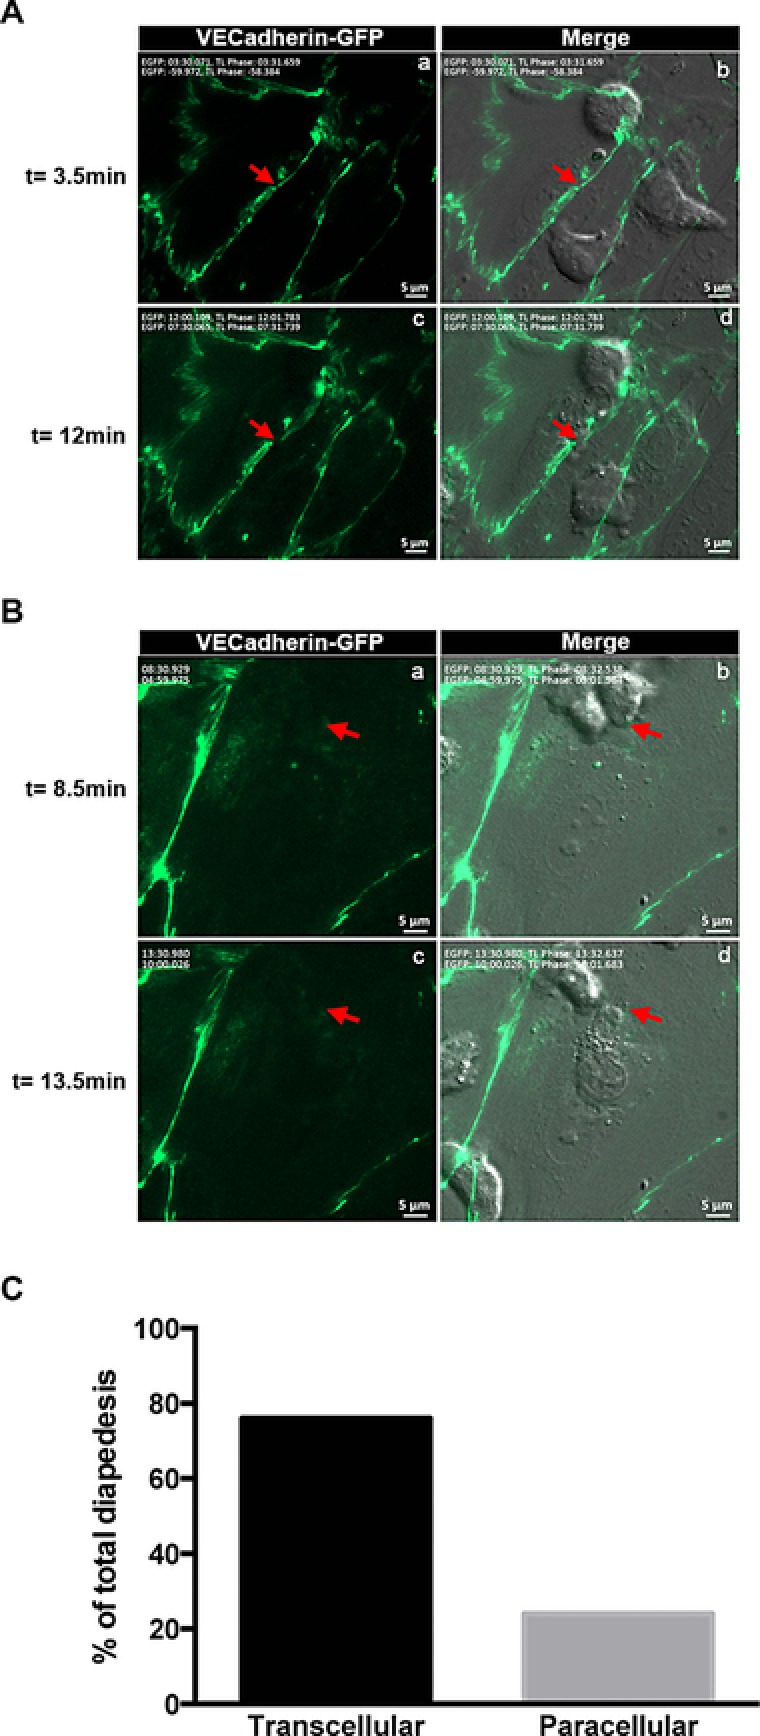
Activated CD8+ T cells cross the inflamed BBB preferentially via the transcellular route. (A) Paracellular diapedesis of a CD8+ T cell across TNF‐α+IFN‐γ‐stimulated pMBMECs is shown. Visualization of VE‐CadGFP in adherens junction (green) at different time points (left, a and c); visualization of a CD8+ T cell by phase contrast superposed with the VE‐CadGFP staining (right, b and d). Red arrow points to where diapedesis occurs with a loss of GFP staining at t = 12.5 min compared to t = 3.5 min. Scale bar = 5 μm. (B) Transcellular diapedesis of a CD8+ T cell across TNF‐α+IFN‐γ‐stimulated pMBMECs is shown. Visualization of VE‐CadGFP in the adherens junction (green) at different time points (left, a and c); visualization of a CD8+ T cell by phase contrast superposed with VE‐CadGFP staining (right, b and d). Red arrow points to the place where diapedesis occurs leaving the GFP staining intact. Scale bar = 5 μm. (C) Quantitative analysis of para‐ and transcellular diapedesis of activated CD8+ T cells shown as percentage from the total number T cells analyzed. All diapedesis events were set to 100%. Evaluation was done from 38 videos of 30 min, in which a total number of 530 arrested cells were evaluated (N = 530). Seventy six percent of CD8+ T cells used the transcellular pathway, while 24% used the paracellular pathway.
TNF‐α or TNF‐α+IFN‐γ induce distinct surface ICAM‐1 and VCAM‐1 levels on pMBMECs
Having observed the distinct dynamic behavior of activated CD8+ versus CD4+ T cells on pMBMECs we next aimed to further delineate the underlying molecular mechanisms. In previous studies, we have shown that the arrest of encephalitogenic CD4+ T cells on pMBMECs is mediated by endothelial VCAM‐1 and ICAM‐1 23. For the subsequent crawling of encephalitogenic CD4+ T cells on pMBMECs we found essential roles for endothelial ICAM‐1 and ICAM‐2 with the cell surface levels of endothelial ICAM‐1 determining the crawling distance and the cellular pathway of CD4+ T cell diapedesis 23, 26. In the present study, we observed that the total number of activated CD8+ and CD4+ T cells arresting on pMBMECs under flow increased after stimulation with TNF‐α and even further after stimulation with TNF‐α+IFN‐γ (Fig. 1) suggesting increased expression of adhesion molecules on the pMBMECs after cytokine stimulation.
Performing immunofluorescence (IF) stainings for ICAM‐1, ICAM‐2, VCAM‐1, and PECAM‐1 we detected staining for ICAM‐2 and PECAM‐1 on all NS pMBMECs. In contrast, ICAM‐1 and VCAM‐1 could only be detected on individual pMBMECs (Fig. 5A). Stimulation with TNF‐α or TNF‐α+IFN‐γ significantly increased the number of pMBMECs staining positive for ICAM‐1 and VCAM‐1 but did not change the staining intensity or staining pattern for ICAM‐2 and PECAM‐1 (Fig. 5A). Quantification of cell surface staining of these adhesion molecules confirmed the significant upregulation of ICAM‐1 and VCAM‐1 on pMBMECs after 16–20 h of stimulation with TNF‐α or TNF‐α+IFN‐γ, when compared to NS pMBMECs (Fig. 5B). Interestingly, both inflammatory stimuli led to a more prominent upregulation of cell surface expression of ICAM‐1 compared to VCAM‐1. We observed a fivefold increased cell surface staining for ICAM‐1 but only a 1.5‐fold increased staining for VCAM‐1 on TNF‐α‐stimulated versus NS pMBMEC monolayers. TNF‐α+IFN‐γ even further increased cell surface expression of ICAM‐1 by 18‐fold over levels detected on NS pMBMEC monolayers while VCAM‐1 cell surface staining was only enhanced 1.8‐fold compared to NS pMBMEC monolayers (Fig. 5B). At the same time cell surface detection of ICAM‐2 and PECAM‐1 remained unchanged in NS and stimulated pMBMEC monolayers (Fig. 5B). Taken together these data demonstrate that TNF‐α and to a larger degree TNF‐α+IFN‐γ induced a significant upregulation of ICAM‐1 and less so of VCAM‐1 on the surface of pMBMECs compared to NS pMBMECs. The ligands for ICAM‐1 and VCAM‐1, namely LFA‐1 and α4β1‐ and α4β7‐integrin were expressed on both activated CD8+ and CD4+ T cells (Supporting Information Fig. 2A; Supporting Information Table 1). Although the different CD8+ or CD4+ T‐cell preparations showed some variations in cell surface staining for these integrins, the variability among the different CD8+ and CD4+ T‐cell lines was comparable and did not allow to distinguish activated CD8+ from CD4+ T cells. More importantly, irrespective of their integrin cell surface expression all activated CD8+ T‐cell preparations more efficiently arrested on pMBMECs compared to the different activated CD4+ T‐cell preparations (Supporting Information Fig. 2B).
Figure 5.
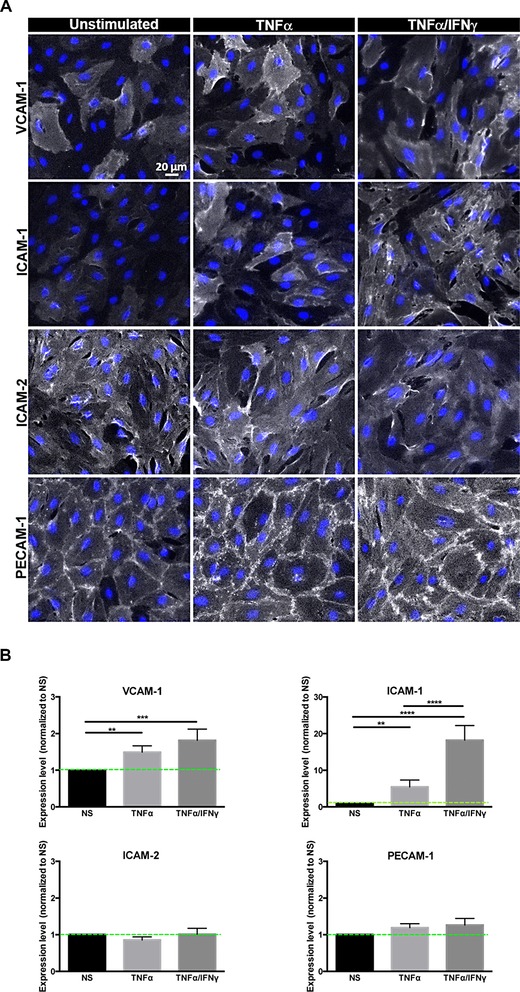
Cytokine stimulation of pMBMECs leads to upregulation of ICAM‐1 and VCAM‐1. Analysis of the surface expression of VCAM‐1, ICAM‐1, ICAM‐2, and PECAM‐1 on confluent pMBMECs following stimulation with TNF‐α and TNF‐α+IFN‐γ for 16–20 h compared to NS pMBMECs (A) IF stainings of VCAM‐1, ICAM‐1, ICAM‐2, and PECAM‐1 on NS, TNF‐α and TNF‐α+IFN‐γ‐stimulated pMBMEC monolayers are shown in false color white. Blue, DAPI staining for nuclei. Scale bar, 20 μm. (B) Quantitative analysis of cell surface protein expression levels of VCAM‐1, ICAM‐1, ICAM‐2, and PECAM‐1 on NS, TNF‐α and TNF‐α+IFN‐γ‐stimulated pMBMECs as determined by on‐cell Western and infrared imaging is shown. Expression levels are displayed relative to the respective NS sample, which was set to 1.0. Bars show the mean ± SD (n = 4).*p < 0.05;**p < 0.01; ***p < 0.001; ****p < 0.0001; One‐way ANOVA, followed by the Tukey multiple comparison test.
Endothelial ICAM‐1 and ICAM‐2 mediate increased shear‐resistant arrest of CD8+ T cells on pMBMECs
We have previously shown that endothelial ICAM‐1 and ICAM‐2 contribute to mediating shear‐resistant arrest of encephalitogenic CD4+ T cells to the BBB in vitro 23. We therefore first addressed the role of endothelial ICAM‐1 in mediating the increased shear‐resistant arrest of CD8+ versus CD4+ T cells on pMBMECs isolated from ICAM‐1null C57BL/6 mice. We found that absence of endothelial ICAM‐1 led to a slight but not quite significant reduction of the shear‐resistant arrest of CD8+ T cells on TNF‐α+IFN‐γ‐stimulated pMBMECs when compared to wild‐type (WT) pMBMECs from 45 ± 19 to 37 ± 12 cells per FOV and on TNF‐α‐stimulated pMBMECs from 33 ± 16 to 23 ± 6 cells per FOV (Supporting Information 4). At the same time absence of endothelial ICAM‐1 had only a minor effect on the shear‐resistant arrest of activated CD4+ T cells. When compared to WT pMBMECs, the arrest of CD4+ T cells on ICAM‐1null pMBMECs was reduced from 30 ± 15 to 26 ± 12 T cells per FOV on TNF‐α+IFN‐γ‐stimulated pMBMECs and from 17 ± 3 to 15 ± 8 cells per FOV on TNF‐α‐stimulated pMBMECs (Supporting Information Fig. 5).
To determine if absence of the additional β2‐integrin ligand ICAM‐2 on pMBMECs affected the increased arrest of activated CD8+ versus CD4+ T cells on the inflamed BBB in vitro we studied the interaction of CD8+ versus CD4+ T cells on pMBMECs isolated from ICAM‐1null/ICAM‐2−/− C57BL/6 mice under physiological flow in vitro. In the absence of endothelial ICAM‐1 and ICAM‐2 the increased arrest of CD8+ T cells versus CD4+ T cells observed on NS and stimulated WT pMBMECs was completely abrogated (Fig. 6A and B). Under NS conditions 2 ± 1 CD8+ T cells per FOV versus 7 ± 2 CD4+ T cells per FOV were found to arrest on ICAM‐1null/ ICAM‐2−/− pMBMECs under flow. After stimulation of ICAM‐1null/ ICAM‐2−/− pMBMECs with TNF‐α or TNF‐α+IFN‐γ arrest of both, CD8+ and CD4+ T cells was increased with 15 ± 4 or 33 ± 3 (p < 0.0001 versus NS) CD8+ T cells per FOV and 18 ± 3 or 31 ± 2 (p < 0.0001 versus NS) CD4+ T cells per FOV arrested on ICAM‐1null/ ICAM‐2−/− pMBMECs, respectively. Compared to the total arrest on WT pMBMECs, the T‐cell arrest of CD8+ but not of CD4+ T cells on ICAM‐1null/ ICAM‐2−/− pMBMECs was significantly decreased (p < 0.0001) both in the absence (NS) and presence of TNF‐α ± IFN‐γ (Fig. 6 A and B and Supporting Information Videos 6–8). Thus, the increased arrest of CD8+ T cells compared to CD4+ T cells observed on WT pMBMECs was mediated by the two endothelial LFA‐1 ligands ICAM‐1 and ICAM‐2. Furthermore, on ICAM‐1null/ ICAM‐2−/− pMBMECs arrested CD8+ and CD4+ T cells failed to polarize as visible by their roundish shape, which could easily be distinguished from the polarized shape arrested T cells obtain on WT pMBMECs (Fig. 6B, Supporting Information Videos 1, 2, 3, 6, 7, 8).
Figure 6.
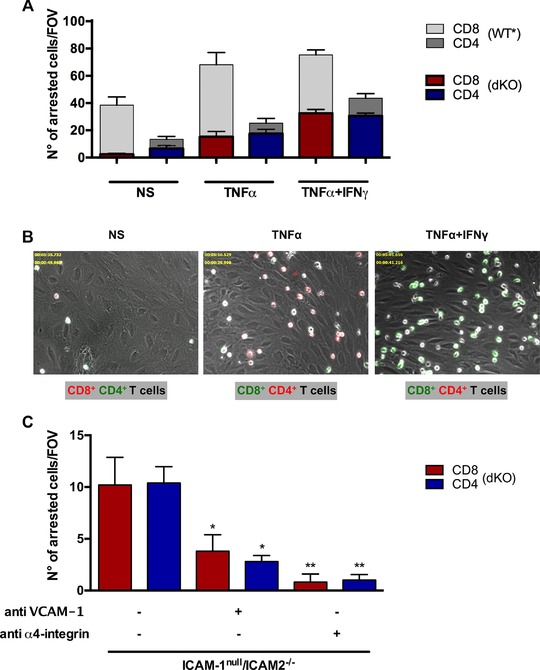
Endothelial ICAM‐1 and ICAM‐2 mediate increased shear‐resistant arrest of CD8+ T cells compared to CD4+ T cells on pMBMECs. Analysis of the postarrest CD4+ and CD8+ T‐cell interactions with (NS, TNF‐α‐stimulated (TNF‐α) and TNF‐α and IFN‐γ (TNF‐α+IFN‐γ) stimulated pMBMECs isolated from ICAM‐1null/ICAM‐2−/− C57BL/6 mice under physiological flow was observed by live cell imaging over 20 min. (A) Mean numbers of arrested CD8+ T cells (red bars) and CD4+ T cells (blue bars) per FOV on ICAM‐1null//ICAM‐2−/− pMBMECs perfused in a 1:1 ratio are shown on NS, TNF‐α‐stimulated (TNF‐α) and TNF‐α and IFN‐γ costimulated (TNF‐α+IFN‐γ) ICAM‐1null//ICAM‐2−/− pMBMECs. For allowing a comparison to T‐cell arrest under WT conditions values from Figure 1 are shown in the background in gray scale. Data are shown as mean ± SEM (n = 10 for NS, n = 14 for TNF‐α, n = 29 for TNF‐α+IFN‐γ). One‐way ANOVA, followed by the Tukey multiple comparison test. (B) Representative images from time‐lapse videos showing the arrested CellTrackerGreen (CMFDA) or CellTrackerOrange (CMTMR) labeled CD8+ and CD4+ T cells on NS, TNF‐α‐stimulated (TNF‐α) and TNF‐α+IFN‐γ costimulated (TNF‐α+IFN‐γ) ICAM‐1null//ICAM‐2−/− pMBMECs at 30 to 40 s after increase of the flow rate. The color of the CD8 or CD4 label indicates the CellTracker dye used for labeling CD8+ and CD4+ T cells in the respective assay. (C) Mean numbers of arrested CD8+ T cells and CD4+ T cells per FOV on TNF‐α+IFN‐γ‐stimulated ICAM‐1null/ICAM‐2−/− pMBMECs perfused in a 1:1 ratio are shown. ICAM‐1null/ICAM‐2−/− pMBMECs were incubated with anti‐VCAM‐1 antibody (6C7.1) and CD8+ and CD4+ T cells incubated with anti‐α4‐integrin antibody (PS/2) for 20 min prior to the experiment. Data are shown as mean ± SEM (n = 5 for each condition). The asterisks indicate statistically significant results in comparison to TNF‐α+IFN‐γ‐stimulated ICAM‐1null/ICAM‐2−/− pMBMECs without additional treatment of T cells or pMBMECs. Two‐way ANOVA, followed by the Sidak's multiple comparisons test.
We next asked if the remaining arrest of CD8+ and CD4+ T cells observed on ICAM‐1null/ ICAM‐2−/− pMBMECs was mediated by α4‐integrin‐mediated interaction with endothelial VCAM‐1. Indeed, antibody mediated inhibition of VCAM‐1 but especially of α4‐integrins completely abrogated shear‐resistant arrest of both, CD8+ and CD4+ T cells on TNF‐α+IFN‐γ‐stimulated ICAM‐1null/ICAM‐2−/− pMBMECs in a comparable manner (Fig. 6C). T‐cell arrest of both, CD8+ and CD4+ T cells was significantly reduced in the presence of anti‐VCAM‐1 (p < 0.05) or anti‐α4‐integrin antibody (p < 0.01) whereas the total arrest of CD8+ compared to CD4+ T cells within the three conditions analyzed was comparable (Fig. 6C).
Taken together, these observations highlight that although α4‐integrin‐mediated interaction with endothelial VCAM‐1 contributes to the arrest of both, activated CD8+ and CD4+ T cells, the increased arrest of CD8+ versus CD4+ T cells on TNF‐α and TNF‐α+IFN‐γ‐stimulated pMBMECs solely relies on the β2‐integrin ligands ICAM‐1 and ICAM‐2. Indeed, when comparing the adhesion of activated CD8+ versus CD4+ T cells on recombinant ICAM‐1 versus VCAM‐1 we observed that under static conditions unlike activated CD4+ T cells, activated CD8+ T cells preferentially adhere on ICAM‐1 and less on VCAM‐1 (Supporting Information Fig. 5A). These findings suggested that activated CD8+ T cells more efficiently interact with ICAM‐1 compared to CD4+ T cells. Therefore, we asked if activated CD8+ T cells display higher numbers of high‐affinity LFA‐1 molecules on their surface when compared to activated CD4+ T cells. To this end, we investigated cell surface binding of soluble ICAM‐1 as an indicator of the presence of high‐affinity LFA‐1 employing flow cytometry. Activated CD8+ T cells but not CD4+ T cells showed slight binding of soluble ICAM‐1 that could be further enhanced in the presence of Mn2+ (Supporting Information Fig. 5B and data not shown). Interestingly, binding of soluble ICAM‐1 to CD8+ T cells was equally observed on both, N4 and Q4 stimulated OT1 cells underscoring that the affinity of the peptide/TCR interaction does not influence LFA‐1 affinity on the surface of activated CD8+ T cells (Supporting Information Fig. 5 B). Similarly, the lack of binding of soluble ICAM‐1 on CD4+ T cells and its low induction of binding in the presence of Mn2+ was also observed for other TCRtg as well as polyclonal encephalitogenic CD4+ T‐cell populations (data not shown). These observations point to a difference in the ability of activated CD8+ compared to CD4+ T cells to rapidly activate a conformational change of their cell surface LFA‐1 toward its high‐affinity conformation allowing for high avidity binding to ICAM‐1 (Supporting Information Fig. 5 B).
Lack of endothelial ICAM‐1 and ICAM‐2 abrogates CD4+ but not CD8+ T‐cell diapedesis across pMBMECs
Considering the similar number of CD8+ and CD4+ T cells arresting on ICAM‐1null/ICAM‐2−/− pMBMECs, we next asked if the differences observed in the postarrest dynamic interaction of CD8+ and CD4+ T cells on WT pMBMECs were also abrogated in the absence of endothelial ICAM‐1 and ICAM‐2. To this end, we performed a visual frame‐by‐frame offline analysis of the time‐lapse videos, in which we quantified the dynamic behavior of CD4+ and CD8+ T cells arrested on NS, TNF‐α, and TNF‐α+IFN‐γ‐stimulated ICAM‐1null/ ICAM‐2−/− pMBMECs by assigning each arrested CD4+ and CD8+ T cell to six groups (i) Stalling T cells detaching during the observation period, (ii) T cells remaining stalled, and (iii) stalling T cells that crossed the pMBMEC monolayer in the observation period, (iv) T cells that crawled and detached, (v) T cells that crawled for the entire observation period, and finally (vi) T cells that crossed the pMBMEC monolayer after crawling (Supporting Information Video 3). Absence of endothelial ICAM‐1 and ICAM‐2 abrogated the ability of both, CD4+ and CD8+ T cells to crawl on NS and stimulated pMBMECs. Thus, the majority of CD8+ and CD4+ T cells remained stalled on ICAM‐1null/ ICAM‐2−/− pMBMECs, however, with a significantly increased proportion of T cells detaching during the observation time when compared to WT pMBMECs (Figs. 7 and 2). Interestingly, stalled CD8+ T cells and to a lesser extent stalled CD4+ T cells were still able to cross the NS and stimulated pMBMEC monolayers in the absence of endothelial ICAM‐1 and ICAM‐2 (Fig. 7). Hereby, a significant difference in the diapedesis rates of stalling but not of crawling T cells was observed on TNF‐α+IFN‐γ‐stimulated pMBMECs, with 23 ± 3% CD8+ versus 11 ± 2% CD4+ stalling T cells still able to cross the endothelial monolayer (Fig. 7). Taken together, these observations demonstrate that endothelial ICAM‐1 and ICAM‐2 are essential for crawling of both, activated CD4+ and CD8+ T cells and contribute to sustained shear‐resistant adhesion of CD4+ and CD8+ T cell on pMBMECs. Interestingly, CD8+ T cells rely less than CD4+ T cells on endothelial ICAM‐1 and ICAM‐2 to undergo diapedesis across the BBB.
Figure 7.
Lack of endothelial ICAM‐1 and ICAM‐2 abrogates diapedesis of CD4+ but not of CD8+ T cells across pMBMECs. (A) Postarrest behavior of CD8+ and CD4+ T cells on NS, TNF‐α‐stimulated (TNF‐α) and TNF‐α+IFN‐γ costimulated (TNF‐α+IFN‐γ) ICAM‐1null//ICAM‐2−/− pMBMECs. As T‐cell crawling is abrogated on ICAM‐1null//ICAM‐2−/− pMBMECs each T cell was assigned to one of three categories, which are shown in the staple bars as follows: Stalling with diapedesis (black), stalling (dark gray) and stalling with detachment (light gray). The number of arrested T cells per FOV (A) was set to 100% and the three categories are displayed in percent. Bars show mean ± SEM (n = 10 for NS, n = 14 for TNF‐α, n = 29 for TNF‐α+IFN‐γ). Normality testing was performed with D'Agostino and Pearson normality test (omnibus K2) before differences between the stalling and crawling fraction were analyzed with the one‐way ANOVA, followed by the Tukey multiple comparison test. (Accompanying movies are provided as Supporting Information Videos 6–8). (B) Percentage of overall CD4+ and CD8+ T‐cell diapedesis irrespective of prior crawling or stalling is shown. p values compare the diapedesis rate of stalling CD4+ and CD8+ T cells. One‐way ANOVA, followed by the Tukey multiple comparison test. NS and TNF‐α = not significant; TNF‐α+IFN‐γ = ****p < 0.00001.
Discussion
The migration of activated T cells into the CNS is a hallmark of MS and its animal model EAE. Inhibition of immune cell trafficking into the CNS with the humanized anti‐α4‐integrin antibody natalizumab is a successful therapeutic regimen for the treatment of MS but comes with a risk for progressive multifocal leukoencephalopathy, an often fatal disease caused by JC virus infection of oligodendrocytes, suggesting that natalizumab may also target CD8+ T‐cell‐mediated CNS immune surveillance 31. Therapeutic efficacy of blocking α4‐integrins was discovered in EAE focusing our current insight into the molecular mechanisms involved in immune cell trafficking to the CNS largely on encephalitogenic CD4+ T cells. Nevertheless, the context of EAE has been used to also address molecular mechanisms involved in the migration of CD8+ T cells into the CNS largely confirming that like for CD4+ T cells, α4β1‐integrin but not α4β7‐integrin is involved in the trafficking of CD8+ T cells to the CNS during EAE 7, 27, 32. However, studying the molecular mechanisms initiating CD8+ T‐cell migration into the CNS in the context of EAE bears limitations 24. Previous in vivo live cell imaging studies in our laboratory aiming to investigate the interaction of activated OVA‐specific TCRtg CD8+ T (OT1) cells with inflamed spinal cord microvessels in mice suffering from CD4+ T‐cell mediated EAE pointed to components missing in the set of traffic signals required to induce efficient OVA‐specific CD8+ T‐cell migration across the inflamed BBB into the CNS 24. In contrast, activated OVA‐specific CD4+ T cells readily cross the BBB during CD4+ T‐cell driven EAE 33 underlining that the activation state rather than the antigen‐specificity controls at least CD4+ T‐cell migration across the BBB during EAE. It is therefore tempting to speculate that efficient CD8+ T‐cell migration across the BBB requires trafficking cues that are absent in classical EAE. Indeed, in contrast to CD4+ T cells 33, 34, 35 recognition of their cognate antigen on the BBB might contribute to CD8+ T cell migration across the BBB. This is supported by the observation that intracerebral injection of their cognate peptide antigen initiated CNS infiltration of circulating CD8+ T cells expressing an MHC class I restricted transgenic TCR specific for this antigen 1, 36. It thus seems that peptide‐loaded MHC class I molecules present on the luminal side of the BBB endothelial cells triggered transmigration of CD8+ T cells in an antigen‐specific manner. This process will, however, only be relevant as part of a pathogenetic mechanism, in which such peptides derived from sequestered or released self‐antigens from the CNS parenchyma or from infectious agents do in fact reach this site.
To recapitulate the CD8+ T‐cell component in CNS autoimmunity, a number of transgenic mouse models expressing model antigens such as OVA or hemagglutinin specifically in cells of the CNS have been established 37, 38, 39, 40. These models were designed to study the migration of CD8+ T cells isolated from well‐characterized TCRtg mouse lines (OT1, CL4‐TCR) expressing MHC class I restricted TCRs by employing adoptive transfer experiments of the respective activated CD8+ T cells analogous to those inducing EAE by the transfer of encephalitogenic CD4+ T cells. In general, induction of clinical disease has proven to be more difficult in these CD8+ T‐cell driven autoimmune neuroinflammatory models requiring either high number of preactivated CD8+ T cells to trigger a clinical disease 4, 41 or the necessity of additional peripheral infectious triggers 5, 6, 42. Nevertheless, CD8+ T cells do cross the BBB in these CD8+ T‐cell induced neuroinflammatory models. These models have allowed to define molecular mechanisms such as a contribution of junctional adhesion molecule B in the migration of CD8+ T cells across the BBB in vivo that are distinct from those observed for CD4+ T cells in neuroinflammation 7, 43. At the same time, as in CD4+ T‐cell driven classical EAE, these models—due to their CD8+ T‐cell driven nature—again do not allow for a direct comparison of the molecular mechanisms involved in CD8+ versus CD4+ T‐cell migration across the BBB in vivo.
In the current study, we therefore decided to rather compare side by side the migration of activated TCR tg CD8+ and CD4+ T cells across the BBB in a well‐established dynamic in vitro flow assay 9, 23, 24, 26 that has proven to reliably recapitulate CD4+ T‐cell interaction with the BBB as observed in vivo 9, 10, 33. We here demonstrate significant differences in the multistep extravasation of activated CD4+ and CD8+ T cells across pMBMECs as an in vitro model for the mouse BBB. Foremost, we found that significantly higher number of CD8+ than CD4+ T cells arrested on pMBMECs under noninflammatory and inflammatory conditions. Arrest of both T‐cell subsets was found to be independent of Gαi‐mediated GPCR‐dependent integrin activation confirming previous observations that integrin‐mediated adhesion of effector/memory T cells is distinct from that of naïve T cells. On the surface of naïve T cells integrins are not constitutively active and rather require “inside‐out” signals initiated by chemokine receptors or the TCR allowing to change the integrin conformation on the cell surface leading to increased affinity for ligand binding 18, 44. Thus, naïve T cells require the presence of immobilized chemokines on the endothelial surface to arrest and subsequently crawl to sites permissive for diapedesis 30, 45. In contrast, effector/memory T cells were previously reported to display spontaneously adhesive LFA‐1 on their surface allowing them to arrest on endothelial ligands under flow in the absence of additional triggers 17, 19, 20, 30, 46. Our present study confirmed that activated CD4+ and CD8+ T cells do not require Gαi‐mediated inside‐out activation of integrins to arrest and crawl on the BBB under flow in vitro. Increased arrest of CD8+ T cells over CD4+ T cells on pMBMECs under flow was rather mediated by endothelial ICAM‐1 and ICAM‐2 instead of VCAM‐1 suggesting a prominent role of LFA‐1 in mediating shear‐resistant arrest of CD8+ T cells on the BBB in vitro. Cell surface levels of LFA‐1 were found to be comparable on the different CD4+ and CD8+ T‐cell preparations investigated. However, activated CD8+ T cells showed increased adhesion to immobilized and soluble recombinant ICAM‐1 and rapid Mn2+‐induced activation of LFA‐1 when compared to CD4+ T cells. These observations imply that compared to activated CD4+ T cells, activated CD8+ T cells display a higher proportion of high‐affinity LFA‐1 on their surface and more rapidly activate the conformational change of LFA‐1 toward the high‐affinity stage allowing for fast maturation of strong adhesive contacts of CD8+ T cells to the endothelial LFA‐1 ligands ICAM‐1 and ICAM‐2.
Interestingly, an influence of the TCR peptide/MHC affinity on increased CD8+ T cell over CD4+ T‐cell arrest on the BBB under physiological flow in vitro could be excluded. Although we confirmed that the interaction of the OT1 TCR with the intermediate affinity peptide Q4 (SIIQFEKL) is less potent in stimulating activation of OT1 cells when compared to the high‐affinity peptide N4 (SIINFEKL) 29 this did not reduce the increased arrest of OT1 CD8+ cells compared to CD4+ T cells on pMBMECs under flow.
Our observations point to potential differences in signaling pathways regulating integrin‐mediated adhesion in activated CD8+ versus CD4+ T cells. The signaling pathways discussed to mediate integrin‐mediated adhesion of T cells to the endothelium under flow include Src‐family kinases, phospholipase C, PI3‐kinase pathways as well as regulation of intracellular calcium and the T‐cell actin cytoskeleton 21, 22, 30, 46, 47. Our present observations suggest that compared to activated CD4+ T cells, activated CD8+ T cells more efficiently use LFA‐1 mediated downstream signaling cascades leading to the rapid maturation and adhesion strengthening of their contacts on the BBB under flow and thus their increased arrest on the pMBMECs when compared to CD4+ T cells.
Differences in LFA‐1 activation on CD8+ versus CD4+ T cells will exert different forces on endothelial ICAM‐1 and ICAM‐2, which will translate to differences in downstream mechanosignaling in the endothelial cells possibly leading to different dynamics in the formation of ICAM‐1 and possibly ICAM‐2‐enriched docking structures on the BBB endothelium. Such docking structures have been described to be enriched in ICAM‐1, VCAM‐1, and F‐actin and have been shown to be required for transcellular and paracellular diapedesis of T cells [23, 24, 25, 26, 48]. A role for endothelial ICAM‐2 in these docking structures has not yet been reported. However, downstream signals triggered by the cytoplasmic tail of endothelial ICAM‐1 have been shown to contribute to successful T‐cell diapedesis 23, 26, 37, 49. Based on our observations it is tempting to speculate that CD8+ T cells by exerting stronger focal forces on endothelial ICAM‐1 combined with ICAM‐2 more efficiently trigger the local endothelial signaling cascades involved in the formation of such docking structures favoring their stalling behavior on the endothelium, which finally induces their transcellular diapedesis across the BBB under flow close to the site of their arrest. In contrast, slower maturation of integrin‐mediated adhesive contacts by CD4+ T cells on the BBB mainly via ICAM‐1 26 might require continuous crawling on endothelial ICAM‐1, which over time will lead to the integration of ICAM‐1 downstream signals in the endothelium sufficient to trigger formation of docking structures allowing for CD4+ T‐cell diapedesis preferentially via paracellular sites.
Our observations are in apparent contrast to a previous study, which has shown CD8+ T‐cell migration across the BBB to be independent of LFA‐1/ ICAM‐1 interactions under static conditions 7, 27. It thus remains to be shown if the critical contribution of LFA‐1/ICAM‐1 in the interaction of activated CD8+ T cells with the BBB observed by us can only be observed under conditions of flow.
In summary, our side‐by‐side comparison of the multistep migration of activated CD8+ T cells versus CD4+ T cells across the BBB in vitro has allowed to define significant differences in the strategies used by CD8+ T cells versus CD4+ T cells to cross the BBB under physiological flow. We have identified a combined role for endothelial ICAM‐1 and ICAM‐2 in triggering the increased arrest of activated CD8+ T cells compared to CD4+ T cells to the BBB, which followed by their stalling lead to their rapid and mainly transcellular diapedesis. These findings support the idea that molecular mechanisms that preferentially mediate the migration of CD8+ T cells versus CD4+ T cells across the BBB do exist and that identification of such pathways will set the stage to more accurately foresee CNS‐specific adverse effects of the increasing numbers of therapies targeting T‐cell trafficking or even depleting peripheral T cells in many chronic inflammatory diseases. Additionally, this will allow to identify novel therapeutic targets within the successful framework of therapeutic targeting of immune cell trafficking to the CNS for the treatment of MS allowing to specifically block CNS recruitment of destructive T cells, while leaving the migration of protective T cell subsets into the CNS unaffected.
Materials and methods
Mice
C57BL/6J mice were obtained from Harlan (Horst, Netherlands) and Janvier (Genest Saint Isle, France). ICAM‐1null (Icam1tm1Alb) mice, generated by deletion of the entire coding region of the ICAM‐1 gene 50,were kindly provided by D.C. Bullard (Birmingham, Alabama, USA). ICAM‐2−/− (Icam2tm1Jcgr) mice were described previously 24, 51. ICAM‐1null//ICAM‐2−/− mice were created by crossbreeding as described 23, 25. VE‐CadGFP knock‐in mice were provided by D. Vestweber (Münster, Germany) 25, 26, 52. OT1 mice (C57BL/6‐Tg(TcraTcrb)1100Mjb) contain a transgenic TCR that recognizes OVA residues 257–264 (SIINFEKL) in the context of H2Kb 25, 26, 53 and were kindly provided by Federica Sallusto (IRB, Bellinzona). OT2 mice (C57BL/6‐Tg(TcraTcrb)425Cbn) contain a transgenic TCR that recognizes OVA residues 323–339 in the context of H2‐Ab1 (I‐Ab) 23, 54 and were kindly provided by Klaus Okkenhaug (Babraham Institute, Cambridge, UK). All gene targeted mice were backcrossed to the C57BL/6J background for at least ten generations. All mice were bred in individually ventilated cages under specific pathogen‐free conditions. Animal procedures were performed according to the Swiss legislation on the protection of animals and approved by the Veterinary Office of the Kanton Bern.
Antibodies and dyes
For flow cytometry (*and blocking of integrins) the following antibodies or hybridoma culture supernatants were used: CD4 PerCP (rat IgG2b, clone RM4‐5, Biolegend 100538, San Diego, USA), CD8a PE (rat IgG2a, clone 53–6.7, Biolegend 100708), CD25 APC (where APC is allophycocyanin; rat IgG2b, clone 3C7, Biolegend 101910), CD29 PE/ β1 (armenian hamster IgG, clone HMb1‐1, Biolegend 102207), CD45 FITC/ CD45 PE/ CD45 APC/CD45 PerCP (rat IgG2b, clone 30F11, Biolegend 103108). The hybridomas anti‐CD45 (clone M1/9), anti‐LFA‐1 (rat IgG2a, clone FD441.8), *anti‐α4‐integrin (rat IgG2b, clone PS/2), anti‐β7‐integrin (rat IgG2a, clone Fib 504), anti‐α4β7‐integrin (rat IgG2a, clone DATK 32) and anti‐CD4 (rat IgG2b, clone GK1.5) were purchased from American Type Culture Collection (ATCC, Rockville, USA). The supernatant for anti‐PSGL‐1 (rat IgG1, clone 4RA10) was a kind gift from D. Vestweber. All supernatants were used as previously described 23, 25, 55, 56, 57, 58.
The following isotype controls were used: PE‐conjugated rat IgG2b, κ (clone A95‐1, BD Pharmingen 556925, San Diego, USA), PerCP‐conjugated rat IgG2a, κ (clone RTK2758, Biolegend 400530), APC‐conjugated rat IgG2a, κ (clone RTK2758, Biolegend 400612), APC‐conjugated rat IgG2b,κ (clone RTK4530, Biolegend 400612) and the hybridoma culture supernatant rat anti‐human CD44 (clone 9B5, ATCC). The following second stage antibodies were used: PE‐conjugated goat F(ab)2 anti‐rat IgG (Life Technologies GmbH A10544, Darmstadt, Germany), PE‐conjugated mouse anti‐armenian and syrian hamster IgG Cocktail (clone G94‐90.5, BD Pharmingen 12355B), FITC‐conjugated mouse anti‐rat IgG2b (clone RG7/11, BD Pharmingen 553900) and APC‐conjugated goat anti‐rat IgG (Life Technologies GmbH A10540).
For IF stainings, on‐cell Western of pMBMECs and soluble ICAM‐1 stainings the following hybridoma culture supernatants and for *function‐blocking the respective endotoxin‐free purified antibodies were used: rat‐anti‐mouse ICAM‐1 (clone 25ZC7), rat‐anti mouse ICAM‐2 (clone 3C4), rat‐anti‐mouse VCAM‐1 (clone 9DB3; *clone 6C7.1), rat‐anti‐mouse PECAM‐1 (clone Mec13.3), rat‐anti mouse Mac‐1 (*clone M1/70) and rat‐anti‐mouse LFA‐1 (*clone FD441.8) and rat anti‐human CD44 (clone 9B5, ATCC), used as isotype control. All antibodies were described previously 31, 56. Rat‐anti‐mouse LFA‐1 *clone M17/4 was purchased from BD Pharmingen (cat. 553337). As second stage, the antibody goat anti‐rat Cy3 (H+L) (Jackson ImmunoReseach, Suffolk, UK) and PE‐conjugated Donkey F(ab')₂ Anti‐Human IgG (H+L) (Jackson ImmunoResearch, 709‐116‐149, West Grove, USA) were used. PTX was obtained from List Biological Laboratories (Campbell, CA). PTX‐B oligomer (PTX‐B) lacking the enzymatic activity of PTX was used as a control and was purchased from Calbiochem (San Diego, CA).
pMBMECs isolation
pMBMECs were isolated from C57BL/6J mice (6‐10‐wk old) exactly as described 7, 23, 25, 26, 27, 31, 59. Cytokine stimulation of pMBMECs was performed by adding recombinant mouse TNF‐α (10 ng/mL, Vitaris AG, Baar, Switzerland) in the absence or presence of additional recombinant mouse IFN‐γ (100 U/mL, PreproTech EC Ltd., London, UK), for 16–20 h.
CD8+ and CD4+ T‐cell isolation and culture
To obtain highly pure and importantly also homogeneously activated T‐cell subsets we chose to isolate CD8+ and CD4+ T cells from the well‐characterized TCR transgenice mouse lines OT1 and OT2, respectively. Isolation of CD4+ and CD8+ T cells from these mice allowed to achieve comparable antigen‐specific T‐cell activation for both T‐cell subsets. Activated T cells were established according to a previously described method 24. In brief, spleen and peripheral lymph nodes were collected from OT1 (for CD8+ T cells) and OT2 (for CD4+ T cells) C57BL/6J mice and single cell suspensions were obtained after DNAse I (0,2 mg/mL; Böhringer, Mannheim, Germany) and liberase (0.4 mg/mL; Roche Applied Sciences, Switzerland) digestion and filtration through a sterile 100 μm nylon mesh. A total of 7.5 × 10⁶ cells were plated per 60 mm diameter petri dish (PD 60) in RPMI supplemented with 10% FBS, 2 mM l‐glutamine, 1 mM sodium pyruvate, 100 U penicillin–streptomycin, 0,05 mM 2‐mercaptoethanol. For TCR‐specific stimulation, OT1 and OT2 T cells were stimulated with their specific OVA peptides (OVA peptide aa257‐264/SIINFEKL/N4 (10 μg/mL) for OT1 and OVA peptide aa323‐339 (5 μg/mL) for OT2) (Peptides International, Louisville, KY, USA) 24, 54, 60. When specifically mentioned, OT1 T cells were also stimulated with intermediate affinity altered peptide ligand Q4 (OVA peptide aa257‐264variant/SIIQFEKL, 10 μg/mL) 28, 29. On day 3, IL‐2 (5 ng/mL) was added overnight in each dish. The next day, freshly activated live OT1 and OT2 T‐cell blasts were isolated by Nycoprep 1.077 A (Axis‐Shield, Dundee, UK) density gradient centrifugation. These T‐cell blasts were cultured for another 2 to 4 days before use in experiments or for freezing of aliquots in liquid nitrogen. Comparable OT1‐ and OT2 T‐cell activation was ensured by assessing antigen‐specific T‐cell proliferation by 3H‐thymidine incorporation during the last 16 h of a 4 day culture exactly as described 33, 56, 61. Purity of the CD4+ OT2 T effector cell population was increased by additional purification via negative magnetic bead selection (EasySep™ Mouse CD4+ T Cell Isolation Kit, STEMCELL Technologies SARL, Cologne, Germany). The purity of CD8+/CD4+ T cells was 97 ± 4%/96 ± 2%, respectively, as determined by flow cytometry.
In vitro live‐cell imaging
Live‐cell imaging of T‐cell interaction with pMBMECs under flow was performed as described with combined superfusion of OT1 and OT2 cells over pMBMECs 23, 24, 25, 26, 33, 34. The technical and methodological details of these studies including an in depth description of the flow chamber setup have been described before 24. To distinguish OT1 and OT2 T cells, they were labeled with Cell Tracker Orange (CMTMR) or Cell Tracker Green (CMFDA, Molecular Probes, Eugene, OR) according to the manufacturers’ instructions. To prevent staining artefacts, OT1 and OT2 cells were alternately labeled with CMTMR or CMFDA in different sets of experiments. OT1 and OT2 T cells were resuspended in Migration Assay Medium (DMEM with 5%FBS, 25 mM HEPES, 2% glutamine) in a concentration of 0.85 × 10⁶ cells/mL and allowed to accumulate on the flow chamber at a low shear (0.1 dyn/cm2) for 5 min. The exact cell ratio of OT1 to OT2 cells within each cell suspension was controlled by flow cytometry. Quantitative evaluation of the videos was corrected for the mixing factor if necessary. Dynamic interaction of activated OT1 and OT2 T cells with the pMBMECs was recorded under physiological shear flow (1.5 dyn/cm2) for 15 to 25 min (objective EC Plan Neoflur 20X/0.4) with phase or differential interference contrast and fluorescence illumination using a monochrome charge‐coupled device camera (AxioCam MRm Rev, Carl Zeiss). Image analysis was performed using ImageJ software (ImageJ software, National Institute of Health, Bethesda, MD, USA) using the manual tracking, chemotaxis and migration tools, and color‐merging plug‐ins. The number of arrested T cells was counted at 30 s after onset of enhanced shear flow (1.5 dyn/cm2). Using the 63x objective (Plan‐Neofluar" 63x/1.3) with a FOV of 136 × 102 μm and in addition by overlaying the differential interference contrast channel with the GFP fluorescence channel, para‐ and transcellular diapedesis of T cells across monolayers of VE‐Cad‐GFP pMBMECs were analyzed. Diapedesis with transient loss of the junctional GFP signal was classified as paracellular, whereas diapedesis events, which did not affect the junctional VE‐Cad‐GFP signal, were categorized as transcellular diapedesis.
On‐cell Western
Quantitative measurement of cell surface molecules expression was assessed by on‐Cell Western as already described 25, 26. pMBMECs were grown to confluency on 96 (SPL, Life science) or 384‐well plates (Greiner Bio‐One, Monroe, NC) and were stimulated or not by cytokines for additional 16–20 h. Primary antibodies were incubated for 15 min at room temperature. After three washes with washing buffer C (WBC, DMEM supplemented with 5% FCS and 25nM HEPES 1×), cells were incubated for another 15 min at RT with the appropriate Alexa 680‐conjugated secondary antibody. Cells were washed three times with WBC and fixed with 1% PFA. The fluorescence intensity was measured by the Odyssey Infrared Imaging System (LI‐COR Biosciences, Bad Homburg, Germany). Background intensity, defined by the isotype control staining, was subtracted from all the values to ensure the specificity of the staining. Values were then normalized to the NS condition.
IF staining
IF stainings of pMBMECs were performed as previously described 23, 25. In brief, pMBMECs were cultured until confluency and were left NS or stimulated with TNF‐α or TNF‐α +IFN‐γ for 16–20 h. Cells were washed with WBC (HBSS + HEPES + BSA) and fixed for 10 min with PBS 1%PFA. Cells were then pretreated with PBS 0.1% TWEEN for 10mins at RT. First antibodies were added for 45 min at RT and after several washes with WBC, the appropriate secondary antibody (goat anti‐rat Cy3, 1/300, Jackson Immunoresearch) was added for 45 min at RT. After further washes the cells were mounted with Mowiol supplemented with DAPI to label the nuclei and analyzed under the fluorescence microscope.
Binding assays on recombinant CAMs
For assessment of T‐cell binding to recombinant cell adhesion molecules, 18 field teflon slides (Thermo Fisher Scientific Inc., Waltham, USA) were precoated with protein A (BioVision, Axxora Europe, Lausen, Switzerland) for 1 h at 37°C. After washing steps with binding assay medium (BAM: DMEM with 25 mM HEPES and 5% FCS) and blocking with 1.5% BSA, purified recombinant mouse ICAM‐1 Fc, (R&D Systems, Abingdon, UK), recombinant VCAM‐1 Fc (R&D Systems) and as control DNER Fc (R&D Systems) were overlaid in a concentration of 10 μg/mL and incubated for 2 h at 37°C. After washing with BAM and blocking with 1.5% BSA, T cells were added in BAM (5 × 10⁶ cells/mL) and incubated on a rotating platform for 30 min at 4°C. After washing in slides were fixed in 2.5% glutaraldehyde for 2 h at room temperature. Cells bound per FOV were counted using an ocular with a 10 ×10 field counting grid.
Flow cytometry
To characterize OT1 and OT2 effector/memory T cells, six parameter flow cytometry analysis was performed exactly as described before at the day the T cells were used in the functional assays and additionally at different time points after isolation, freezing, or thawing 62. Antibody incubation was performed for 30 min with primary Abs and the PE or APC‐conjugated secondary antibody at 4°C. Before acquisition using a FACSCalibur and CellQuest software (BD Biosciences), cells were fixed in 1% formaldehyde/PBS (pH 7.4). Data analysis was performed with FlowJo software (Tree Star, Ashland, OR).
Soluble ICAM‐1 binding assay
To analyze β2‐integrin affinity on OT1 and OT2 T cells, we performed a soluble ICAM‐1‐binding assay as previously described 63. As a positive control T cells were preincubated with 2 mM MnCl2 and as a negative control with a cocktail of function blocking anti‐β2‐integrin antibodies (anti‐LFA‐1 (M17/4; 20 μg/mL) and anti‐Mac1 (M1/70; 50 μg/mL) for 10 min at RT. Recombinant mouse ICAM‐1 Fc, (R&D Systems, Abingdon, UK, final concentration 20 μg/mL) was preincubated with PE‐conjugated donkey F(ab')₂ anti‐human IgG (H + L) (Jackson ImmunoResearch) for 10 min at 20°C prior to incubation for 3 or 5 min at 37°C with the CD4+ and CD8+ T cells. Following fixation in 7.4% formaldehyde soluble ICAM‐1 binding to the T cells was assessed by flow cytometry.
Statistical analysis
Statistical analysis was performed using GraphPad Prism software (GraphPad, San Diego, CA). If not otherwise stated, normality testing was performed with D'Agostino and Pearson normality test (omnibus K2) before differences between two groups were analyzed with the one‐way or two‐way ANOVA. Follow up analysis was performed with Tukey multiple comparison test. Data are shown as mean ± SEM.
Conflict of interest
The authors declare no commercial or financial conflict of interest.
Abbreviations
- APC
allophycocyanin
- BAM
binding assay medium
- BBB
blood–brain barrier
- CSF
cerebrospinal fluid
- FOV
field of view
- GM‐CSF
granulocyte macrophage colony stimulating factor
- ICAM‐1null//ICAM‐2−/−
ICAM‐1 and ICAM‐2 deficient
- IF
immunofluorescence staining
- NS
nonstimulated
- pMBMECs
primary mouse brain microvascular endothelial cells
- PTX
pertussis toxin
- VE‐CadGFP
VE‐cadherin‐GFP
- WBC
washing buffer C
Supporting information
As a service to our authors and readers, this journal provides supporting information supplied by the authors. Such materials are peer reviewed and may be re‐organized for online delivery, but are not copy‐edited or typeset. Technical support issues arising from supporting information (other than missing files) should be addressed to the authors.
Supporting Information
Supporting Information Video 1
Supporting Information Video 2
Supporting Information Video 3
Supporting Information Video 4
Supporting Information Video 5
Supporting Information Video 6
Supporting Information Video 7
Supporting Information Video 8
Peer Review Correspondence
Acknowledgments
This work was funded by the Swiss National Science Foundation grant Number 31003A_149420, the Swiss MS Society and ARSEP to B.E. H.R. was funded by a fellowship from the DGPI (German Society of Pediatric Infectious Diseases). A.K. has been supported by fellowships from the Swiss MS Society and from ECTRIMS. We thank Dr. Urban Deutsch for management of the transgenic mouse colonies and special thanks go to Dr. Reinhard Fässler and Dr. Markus Moser (MPI, Martinsreid, Germany) for their expert advise on detection methods for integrin activation states on mouse cells. The Microscopy Imaging Center of the University of Bern is acknowledged for continuous support.
H.R. performed experiments, data analysis, and interpretation and wrote the manuscript; A.K. performed experiments, data analysis, wrote parts of the manuscript; I.G. performed and analyzed experiments, and contributed to writing the manuscript, C.B. performed and analyzed experiments; R.L. trained H.R. and A.K. and performed data analysis and interpretation; B.E. designed and supervised the study and wrote the manuscript.
Current address: Henriette Rudolph, Department of Pediatrics, Pediatric Infectious Diseases, Medical Faculty Mannheim, Heidelberg University, Mannheim, Germany
References
- 1. Lassmann, H. , Classification of demyelinating diseases at the interface between etiology and pathogenesis. Curr. Opin. Neurol. 2001. 14: 253–258. [DOI] [PubMed] [Google Scholar]
- 2. Pierson, E. , Simmons, S. B. , Castelli, L. and Goverman, J. M. , Mechanisms regulating regional localization of inflammation during CNS autoimmunity. Immunol. Rev. 2012. 248: 205–215. [DOI] [PMC free article] [PubMed] [Google Scholar]
- 3. Codarri, L. , Gyülvészi, G. , Tosevski, V. , Hesske, L. , Fontana, A. , Magnenat, L. , Suter, T. et al., RORgt drives production of the cytokine GM‐CSF in helper T cells, which is essential for the effector phase of autoimmune neuroinflammation. Nat. Immunol. 2011. 12: 560–567. [DOI] [PubMed] [Google Scholar]
- 4. Friese, M. A. , Autoreactive CD8+ T cells in multiple sclerosis: a new target for therapy? Brain 2005. 128: 1747–1763. [DOI] [PubMed] [Google Scholar]
- 5. Liblau, R. S. , Wong, F. S. , Mars, L. T. , Santamaria, P. , Autoreactive CD8 T cells in organ‐specific autoimmunity: emerging targets for therapeutic intervention. Immunity 2002. 17: 1–6. [DOI] [PubMed] [Google Scholar]
- 6. Neumann, H. , Medana, I. M. , Bauer, J. and Lassmann, H . Cytotoxic T lymphocytes in autoimmune and degenerative CNS diseases. Trends Neurosci. 2002. 25: 313–319. [DOI] [PubMed] [Google Scholar]
- 7. Ifergan, I. , Kebir, H. , Alvarez, J. I. , Marceau, G. , Bernard, M. , Bourbonniere, L. , Poirier, J. et al., Central nervous system recruitment of effector memory CD8+ T lymphocytes during neuroinflammation is dependent on 4 integrin. Brain 2011. 134: 3560–3577. [DOI] [PMC free article] [PubMed] [Google Scholar]
- 8. Lucchinetti, C. F. , Popescu, B. F. G. , Bunyan, R. F. , Moll, N. M. , Roemer, S. F. , Lassmann, H. , Brück, W. et al., Inflammatory cortical demyelination in early multiple sclerosis. N. Engl. J. Med. 2011. 365: 2188–2197. [DOI] [PMC free article] [PubMed] [Google Scholar]
- 9. Babbe, H. , Roers, A. , Waisman, A. , Lassmann, H. , Goebels, N. , Hohlfeld, R. , Friese, M. et al., Clonal expansions of CD8(+) T cells dominate the T cell infiltrate in active multiple sclerosis lesions as shown by micromanipulation and single cell polymerase chain reaction. J. Exp. Med. 2000. 192: 393–404. [DOI] [PMC free article] [PubMed] [Google Scholar]
- 10. Junker, A. , Ivanidze, J. , Malotka, J. , Eiglmeier, I. , Lassmann, H. , Wekerle, H. , Meinl, E. et al., Multiple sclerosis: T‐cell receptor expression in distinct brain regions. Brain 2007. 130: 2789–2799. [DOI] [PubMed] [Google Scholar]
- 11. Jacobsen, M. , Cepok, S. , Quak, E. , Happel, M. , Gaber, R. , Ziegler, A. , Schock, S. et al., Oligoclonal expansion of memory CD8+ T cells in cerebrospinal fluid from multiple sclerosis patients. Brain 2002. 125: 538–550. [DOI] [PubMed] [Google Scholar]
- 12. Fugger, L. , Friese, M. A. and Bell, J. I. , From genes to function: the next challenge to understanding multiple sclerosis. Nat. Rev. Immunol. 2009. 9: 408–417. [DOI] [PubMed] [Google Scholar]
- 13. Mars, L. T. , Saikali, P. , Liblau, R. S. , Arbour, N. , Contribution of CD8 T lymphocytes to the immuno‐pathogenesis of multiple sclerosis and its animal models. Biochim. Biophys. Acta 2011. 1812: 151–161. [DOI] [PMC free article] [PubMed] [Google Scholar]
- 14. Brynedal, B. , Duvefelt, K. , Jonasdottir, G. , Roos, I. M. , Åkesson, E. , Palmgren, J. and Hillert, J. , HLA‐A confers an HLA‐DRB1 Independent Influence on the Risk of Multiple Sclerosis. PLoS One 2007. 2: e664. [DOI] [PMC free article] [PubMed] [Google Scholar]
- 15. Burfoot, R. K. , Jensen, C. J. , Field, J. , Stankovich, J. , Varney, M. D. , Johnson, L. J. , Butzkueven, H. et al., SNP mapping and candidate gene sequencing in the class I region of the HLA complex: searching for multiple sclerosis susceptibility genes in Tasmanians. Tissue Antigens 2008. 71: 42‐50. [DOI] [PubMed] [Google Scholar]
- 16. Engelhardt, B. , Sorokin, L. , The blood–brain and the blood–cerebrospinal fluid barriers: function and dysfunction. Semin. Immunopathol. 2009. 31: 497–511. [DOI] [PubMed] [Google Scholar]
- 17. Engelhardt, B. , Ransohoff, R. M. , Capture, crawl, cross: the T cell code to breach the blood–brain barriers. Trends Immunol. 2012. 33: 579–589. [DOI] [PubMed] [Google Scholar]
- 18. Ransohoff, R. M. and Engelhardt, B. , The anatomical and cellular basis of immune surveillance in the central nervous system. Nat. Rev. Immunol. 2012. 12: 623–635. [DOI] [PubMed] [Google Scholar]
- 19. Lyck, R. , Engelhardt, B. , Going against the tide ‐ how encephalitogenic T cells breach the blood‐brain barrier. J. Vasc. Res. 2012. 49: 497–509. [DOI] [PubMed] [Google Scholar]
- 20. Sallusto, F. , Impellizzieri, D. , Basso, C. , Laroni, A. , Uccelli, A. , Lanzavecchia, A. and Engelhardt, B. , T‐cell trafficking in the central nervous system. Immunol. Rev. 2012. 248: 216–227. [DOI] [PubMed] [Google Scholar]
- 21. Coles, A. J. , Fox, E. , Vladic, A. , Gazda, S. K. , Brinar, V. , Selmaj, K. W. , Bass, A. D.‐D. et al., Alemtuzumab versus interferon beta‐1a in early relapsing‐remitting multiple sclerosis: post‐hoc and subset analyses of clinical efficacy outcomes. Lancet Neurol. 2011. 10: 338–348. [DOI] [PubMed] [Google Scholar]
- 22. Miller, D. H. , Khan, O. A. , Sheremata, W. A. , Blumhardt, L. D. , Rice, G. P. A. , Libonati, M. A. , Willmer‐Hulme, A. J. et al., A controlled trial of natalizumab for relapsing multiple sclerosis. N. Engl. J. Med. 2003. 348: 15–23. [DOI] [PubMed] [Google Scholar]
- 23. Steiner, O. , Coisne, C. , Cecchelli, R. , Boscacci, R. , Deutsch, U. , Engelhardt, B. , Lyck, R. , Differential roles for endothelial ICAM‐1, ICAM‐2, and VCAM‐1 in shear‐resistant T cell arrest, polarization, and directed crawling on blood‐brain barrier endothelium. J. Immunol. 2010. 185: 4846–4855. [DOI] [PubMed] [Google Scholar]
- 24. Coisne, C. , Lyck, R. , Engelhardt, B. , Live cell imaging techniques to study T cell trafficking across the blood‐brain barrier in vitro and in vivo. Fluids Barriers CNS 2013. 10: 7. [DOI] [PMC free article] [PubMed] [Google Scholar]
- 25. Gorina, R. , Lyck, R. , Vestweber, D. , Engelhardt, B. , β2 Integrin−mediated crawling on endothelial ICAM‐1 and ICAM‐2 is a prerequisite for transcellular neutrophil diapedesis across the inflamed blood−brain barrier. J. Immunol. 2013. 192: 324–337. [DOI] [PubMed] [Google Scholar]
- 26. Abadier, M. , Jahromi, N. H. , Cardoso‐Alves, L. , Boscacci, R. , Vestweber, D. , Barnum, S. , Deutsch, U. et al., Cell surface levels of endothelial ICAM‐1 influence the transcellular or paracellular T‐cell diapedesis across the blood‐brain barrier. Eur. J. Immunol. 2015. 45: 1043‐58 [DOI] [PubMed] [Google Scholar]
- 27. Bauer, M. , Brakebusch, C. , Coisne, C. , Sixt, M. , Wekerle, H. , Engelhardt, B. , Fässler, R. , beta1 integrins differentially control extravasation of inflammatory cell subsets into the CNS during autoimmunity. Proc. Natl. Acad. Sci. U S A 2009. 106: 1920–1925. [DOI] [PMC free article] [PubMed] [Google Scholar]
- 28. Zehn, D. , Lee, S. Y. , Bevan, M. J. , Complete but curtailed T‐cell response to very low‐affinity antigen. Nature 2009. 458: 211–214. [DOI] [PMC free article] [PubMed] [Google Scholar]
- 29. Moreau, H. D. , Lemaître, F. , Terriac, E. , Azar, G. , Piel, M. , Lennon‐Dumenil, A.‐M. , Bousso, P. , Dynamic in situ cytometry uncovers T cell receptor signaling during immunological synapses and kinapses in vivo. Immunity 2012. 37: 351–363. [DOI] [PubMed] [Google Scholar]
- 30. Shulman, Z. , Cohen, S. J. , Roediger, B. , Kalchenko, V. , Jain, R. , Grabovsky, V. , Klein, E. et al., Transendothelial migration of lymphocytes mediated by intraendothelial vesicle stores rather than by extracellular chemokine depots. Nat. Immunol. 2011. 13: 67–76. [DOI] [PubMed] [Google Scholar]
- 31. Ransohoff, R. M. , PML risk and natalizumab: more questions than answers. Lancet Neurol. 2010. 9: 231–233. [DOI] [PubMed] [Google Scholar]
- 32. Young, K. G. , MacLean, S. , Dudani, R. , Krishnan, L. , Sad, S. , CD8+ T cells primed in the periphery provide time‐bound immune‐surveillance to the central nervous system. J. Immunol. 2011. 187: 1192–1200. [DOI] [PMC free article] [PubMed] [Google Scholar]
- 33. Bartholomaus, I. , Kawakami, N. , Odoardi, F. , Schläger, C. , Miljkovic, D. , Ellwart, J. W. , Klinkert, W. E. F. et al., Effector T cell interactions with meningeal vascular structures in nascent autoimmune CNS lesions. Nature 2009. 461: 94–98. [DOI] [PubMed] [Google Scholar]
- 34. Vajkoczy, P. , Laschinger, M. , Engelhardt, B. , α4‐integrin‐VCAM‐1 binding mediates G protein–independent capture of encephalitogenic T cell blasts to CNS white matter microvessels. J. Clin. Invest. 2001. 108: 557–565. [DOI] [PMC free article] [PubMed] [Google Scholar]
- 35. Greenwood, J. , Heasman, S. J. , Alvarez, J. I. , Prat, A. , Lyck, R. , Engelhardt, B. , Review: leucocyte‐endothelial cell crosstalk at the blood‐brain barrier: a prerequisite for successful immune cell entry to the brain. Neuropathol. Appl. Neurobiol. 2011. 37: 24–39. [DOI] [PubMed] [Google Scholar]
- 36. Galea, I. , Bernardes‐Silva, M. , Forse, P. A. , van Rooijen, N. , Liblau, R. S. , Perry, V. H. , An antigen‐specific pathway for CD8 T cells across the blood‐brain barrier. J. Exp. Med. 2007. 204: 2023–2030. [DOI] [PMC free article] [PubMed] [Google Scholar]
- 37. Denic, A. , Wootla, B. , Rodriguez, M. , CD8 +T cells in multiple sclerosis. Expert Opin. Ther. Targets 2013. 17: 1053–1066. [DOI] [PMC free article] [PubMed] [Google Scholar]
- 38. Codarri, L. , Greter, M. , Becher, B. , Communication between pathogenic T cells and myeloid cells in neuroinflammatory disease. Trends Immunol. 2013. 34: 114–119. [DOI] [PubMed] [Google Scholar]
- 39. Cao, Y. , Toben, C. , Na, S.‐Y. , Stark, K. , Nitschke, L. , Peterson, A. , Gold, R. et al., Induction of experimental autoimmune encephalomyelitis in transgenic mice expressing ovalbumin in oligodendrocytes. Eur. J. Immunol. 2006. 36: 207–215. [DOI] [PubMed] [Google Scholar]
- 40. Saxena, A. , Bauer, J. , Scheikl, T. , Zappulla, J. , Audebert, M. , Desbois, S. , Waisman, A. et al., Cutting edge: multiple sclerosis‐like lesions induced by effector CD8 T cells recognizing a sequestered antigen on oligodendrocytes. J. Immunol. 2008. 181: 1617–1621. [DOI] [PubMed] [Google Scholar]
- 41. Morgan, D. J. , Liblau, R. , Scott, B. , Fleck, S. , McDevitt, H. O. , Sarvetnick, N. , Lo, D. et al., CD8(+) T cell‐mediated spontaneous diabetes in neonatal mice. J. Immunol. 1996. 157: 978–983. [PubMed] [Google Scholar]
- 42. Na, S.‐Y. , Hermann, A. , Sanchez‐Ruiz, M. , Storch, A. , Deckert, M. , Hünig, T. , Oligodendrocytes enforce immune tolerance of the uninfected brain by purging the peripheral repertoire of autoreactive CD8+ T cells. Immunity 2012. 37: 134–146. [DOI] [PubMed] [Google Scholar]
- 43. Martin‐Blondel, G. , Pignolet, B. , Tietz, S. , Yshii, L. , Gebauer, C. , Perinat, T. , Van Weddingen, I. et al., Migration of encephalitogenic CD8 T cells into the central nervous system is dependent on the α4β1‐integrin. Eur. J. Immunol. 2015. 45: 3302–3312 [DOI] [PMC free article] [PubMed] [Google Scholar]
- 44. Hogg, N. , Patzak, I. , Willenbrock, F. , The insider's guide to leukocyteintegrin signalling and function. Nat. Rev. Immunol. 2011. 11: 416–426. [DOI] [PubMed] [Google Scholar]
- 45. Shulman, Z. , Shinder, V. , Klein, E. , Grabovsky, V. , Yeger, O. , Geron, E. , Montresor, A. et al., Lymphocyte Crawling and Transendothelial Migration Require Chemokine Triggering of High‐Affinity LFA‐1 Integrin. Immunity 2009. 30: 384–396. [DOI] [PMC free article] [PubMed] [Google Scholar]
- 46. Lek, S. H. , Morrison, V. L. , Conneely, M. , Campbell, P. A. , McGloin, D. , Kliche, S. , Watts, C. et al., The spontaneously adhesive leukocyte function‐associated antigen‐1 (LFA‐1) integrin in effector T cells mediates rapid actin‐ and calmodulin‐dependent adhesion strengthening to ligand under shear flow. J. Biol. Chem. 2013. 288: 14698–14708. [DOI] [PMC free article] [PubMed] [Google Scholar]
- 47. Evans, R. , Lellouch, A. C. , Svensson, L. , McDowall, A. , Hogg, N. , The integrin LFA‐1 signals through ZAP‐70 to regulate expression of high‐affinity LFA‐1 on T lymphocytes. Blood 2011. 117: 3331–3341. [DOI] [PubMed] [Google Scholar]
- 48. Schnoor, M. , Endothelial actin‐binding proteins and actin dynamics in leukocyte transendothelial migration. J. Immunol. 2015. 194: 3535–3541. [DOI] [PubMed] [Google Scholar]
- 49. Lyck, R. , T‐cell interaction with ICAM‐1/ICAM‐2 double‐deficient brain endothelium in vitro: the cytoplasmic tail of endothelial ICAM‐1 is necessary for transendothelial migration of T cells. Blood 2003. 102: 3675–3683. [DOI] [PubMed] [Google Scholar]
- 50. Bullard, D. C. , Hu, X. , Schoeb, T. R. , Collins, R. G. , Beaudet, A. L. , Barnum, S. R. , Intercellular adhesion molecule‐1 expression is required on multiple cell types for the development of experimental autoimmune encephalomyelitis. J. Immunol. 2007. 178: 851–857. [DOI] [PubMed] [Google Scholar]
- 51. Gerwin, N. , Gonzalo, J.‐A. , Lloyd, C. , Coyle, A. J. , Reiss, Y. , Banu, N. , Wang, B. et al., Prolonged eosinophil accumulation in allergic lung interstitium of ICAM‐2‐deficient mice results in extended hyperresponsiveness. Immunity 1999. 10: 9–19. [DOI] [PubMed] [Google Scholar]
- 52. Winderlich, M. , Keller, L. , Cagna, G. , Broermann, A. , Kamenyeva, O. , Kiefer, F. , Deutsch, U. et al., VE‐PTP controls blood vessel development by balancing Tie‐2 activity. J. Cell Biol. 2009. 185: 657–671. [DOI] [PMC free article] [PubMed] [Google Scholar]
- 53. Hogquist, K. A. , Jameson, S. C. , Heath, W. R. , Howard, J. L. , Bevan, M. J. , Carbone, F. R. , T cell receptor antagonist peptides induce positive selection. Cell 1994. 76: 17–27. [DOI] [PubMed] [Google Scholar]
- 54. Barnden, M. , Allison, J. , Heath, W. R. , Carbone, F. R. , Defective TCR expression in transgenic mice constructed using cDNA‐based a‐ and b‐chain genes under the control of heterologous regulatory elements. Immunol. Cell Biol. 1998. 76: 34–40. [DOI] [PubMed] [Google Scholar]
- 55. Engelhardt, B. , Kempe, B. , Merfeld‐Clauss, S. , Laschinger, M. , Furie, B. , Wild, M. K. , Vestweber, D. , P‐Selectin Glycoprotein Ligand 1 Is Not Required for the Development of Experimental Autoimmune Encephalomyelitis in SJL and C57BL/6 Mice. J. Immunol. 2005. 175: 1267–1275. [DOI] [PubMed] [Google Scholar]
- 56. Engelhardt, B. , Laschinger, M. , Schulz, M. , Samulowitz, U. , Vestweber, D. , Hoch, G. , The development of experimental autoimmune encephalomyelitis in the mouse requires alpha4‐integrin but not alpha4beta7‐integrin. J. Clin. Invest. 1998. 102: 2096–2105. [DOI] [PMC free article] [PubMed] [Google Scholar]
- 57. Döring, A. , Wild, M. , Vestweber, D. , deutsch, U. , Engelhardt, B. , E‐ and P‐selectin are not required for the development of experimental autoimmune encephalomyelitis in C57BL/6 and SJL mice. J. Immunol. 2007. 179: 8470–8479. [DOI] [PubMed] [Google Scholar]
- 58. Sathiyanadan, K. , Coisne, C. , Enzmann, G. , deutsch, U. , Engelhardt, B. , PSGL‐1 and E/P‐selectins are essential for T‐cell rolling in inflamed CNS microvessels but dispensable for initiation of EAE. Eur. J. Immunol. 2014. 44: 2287–2294. [DOI] [PubMed] [Google Scholar]
- 59. Coisne, C. , Dehouck, L. , Faveeuw, C. , Delplace, Y. , Miller, F. , Landry, C. , Morissette, C. et al., Mouse syngenic in vitro blood–brain barrier model: a new tool to examine inflammatory events in cerebral endothelium. Lab. Invest. 2005. 85: 734–746. [DOI] [PubMed] [Google Scholar]
- 60. Carbone, F. R. , Sterry, S. J. , Butler, J. , Rodda, S. , Moore, M. W. , T cell receptor alpha‐chain pairing determines the specificity of residue 262 within the Kb‐restricted, ovalbumin257‐264 determinant. Int. Immunol. 1992. 4: 861–867. [DOI] [PubMed] [Google Scholar]
- 61. Engelhardt, B. , Vestweber, D. , Hallmann, R. , Schulz, M. , E‐ and P‐selectin are not involved in the recruitment of inflammatory cells across the blood‐brain barrier in experimental autoimmune encephalomyelitis. Blood 1997. 90: 4459–4472. [PubMed] [Google Scholar]
- 62. Laschinger, M. , Engelhardt, B. , Interaction of alpha4‐integrin with VCAM‐1 is involved in adhesion of encephalitogenic T cell blasts to brain endothelium but not in their transendothelial migration in vitro. J. Neuroimmunol. 2000. 102: 32–43. [DOI] [PubMed] [Google Scholar]
- 63. Lefort, C. T. , Rossaint, J. , Moser, M. , Petrich, B. G. , Zarbock, A. , Monkley, S. J. , Critchley, D. R. et al., Distinct roles for talin‐1 and kindlin‐3 in LFA‐1 extension and affinity regulation. Blood 2012. 119: 4275–4282. [DOI] [PMC free article] [PubMed] [Google Scholar]
Associated Data
This section collects any data citations, data availability statements, or supplementary materials included in this article.
Supplementary Materials
As a service to our authors and readers, this journal provides supporting information supplied by the authors. Such materials are peer reviewed and may be re‐organized for online delivery, but are not copy‐edited or typeset. Technical support issues arising from supporting information (other than missing files) should be addressed to the authors.
Supporting Information
Supporting Information Video 1
Supporting Information Video 2
Supporting Information Video 3
Supporting Information Video 4
Supporting Information Video 5
Supporting Information Video 6
Supporting Information Video 7
Supporting Information Video 8
Peer Review Correspondence