

Abstract
Tofacitinib is an oral Janus kinase inhibitor for the treatment of rheumatoid arthritis. An extended‐release (XR) formulation has been designed to provide a once‐daily (QD) dosing option to patients to achieve comparable pharmacokinetic (PK) parameters to the twice‐daily immediate‐release (IR) formulation. We conducted 2 randomized, open‐label, phase 1 studies in healthy volunteers. Study A characterized single‐dose and steady‐state PK of tofacitinib XR 11 mg QD and intended to demonstrate equivalence of exposure under single‐dose and steady‐state conditions to tofacitinib IR 5 mg twice daily. Study B assessed the effect of a high‐fat meal on the bioavailability of tofacitinib from the XR formulation. Safety and tolerability were monitored in both studies. In study A (N = 24), the XR and IR formulations achieved time to maximum plasma concentration at 4 hours and 0.5 hours postdose, respectively; terminal half‐life was 5.9 hours and 3.2 hours, respectively. Area under plasma concentration‐time curve (AUC) and maximum plasma concentration (Cmax) after single‐ and multiple‐dose administration were equivalent between the XR and IR formulations. In study B (N = 24), no difference in AUC was observed for fed vs fasted conditions. Cmax increased by 27% under the fed state. On repeat administration, negligible accumulation (<20%) of systemic exposures was observed for both formulations. Steady state was achieved within 48 hours of dosing with the XR formulation. Tofacitinib administration as an XR or IR formulation was generally well tolerated in these studies.
Keywords: tofacitinib, once daily, extended‐release, pharmacokinetics, multiple dose, food
Tofacitinib is an oral Janus kinase (JAK) inhibitor for the treatment of rheumatoid arthritis (RA). In cellular settings, tofacitinib preferentially inhibits signaling via JAK3 and/or JAK1 with functional selectivity over signaling via pairs of JAK2.1, 2 Inhibition of the JAK pathway blocks signaling through the common γ‐chain‐containing receptors for multiple proinflammatory cytokines.3
The pharmacokinetic (PK) profile of tofacitinib is characterized by rapid absorption and elimination, with time to maximum plasma concentration (tmax) 0.5 to 1 hour and terminal half‐life (t½) approximately 3 hours.4, 5 Tofacitinib is approved as an immediate‐release (IR) formulation and may be administered at a dose of 5 mg twice daily (BID) for a total daily dose of 10 mg.
For chronic conditions, such as RA, a once‐daily (QD) dosing option has the potential to optimize compliance,6 and may enhance patient convenience and ease of use. To facilitate QD dosing, an extended‐release (XR) tablet formulation of tofacitinib has been developed using extrudable core system (ECS) osmotic delivery technology.7 Compared with conventional bilayer, push‐pull osmotic tablets, the ECS tablet consists of a single‐layer osmotically active core surrounded by a semipermeable membrane with a drug delivery port in the membrane. This technology has been shown to enhance the upper limit of drug loading in osmotic tablets.7 The ECS tablet formulation of tofacitinib has been designed to achieve equivalence in total systemic exposure, as measured by area under the plasma concentration‐time curve (AUC), relative to the IR formulation administered BID. In addition, the XR formulation was engineered to provide similarity in other PK parameters, including maximum (Cmax) and minimum plasma concentration (Cmin) compared with the IR formulation.
The ECS tablets of tofacitinib were developed at a dose strength of 11 mg to provide a QD equivalent to IR 5 mg BID.8 The 10% increase in total daily dose of the XR formulation was necessary to match the AUC with the IR formulation. Evaluations using a preliminary version of the 11‐mg strength of the ECS tablet formulation demonstrated equivalence of AUC and Cmax between the XR and IR tofacitinib formulations.8
Here, we report the results of PK evaluations from 2 key phase 1 studies of the tofacitinib XR 11‐mg formulation in healthy volunteers. The first study compared the PK between the IR and XR formulations of tofacitinib under both single‐ and multiple‐dose conditions. The second study assessed the effect of a high‐fat meal on the PK of the XR formulation of tofacitinib. In both studies, the proposed commercial image of the XR formulation was evaluated.
Methods
Subjects
Both study protocols were approved by the Institutional Review Boards and/or Independent Ethics Committees at each of the investigational centers. The final protocols and informed consent documentation for the relative bioavailability study were approved by Comite d'Ethique Hospitalo‐Facultaire Erasme‐ULB Cliniques Universitaires de Bruxelles, and the food effect study was approved by Aspire Institutional Review Board at the investigational center. Signed and dated informed consent was obtained from each subject enrolled in the study, prior to screening. The studies were conducted in accordance with the ethical principles of the Declaration of Helsinki and in compliance with International Conference on Harmonisation Good Clinical Practice Guidelines. All local regulatory requirements were followed.
The 2 phase 1 studies were conducted in adult healthy volunteers to characterize the PK profile of the XR formulation of tofacitinib. Eligible subjects were healthy (defined by detailed medical history and a full physical examination), male or female of nonchildbearing potential, aged 18 to 55 years, with body mass index between 17.5 and 30.5 kg/m2 and total body weight >45 kg. They were required to have no evidence of active, latent, or inadequately treated tuberculosis infection. Key exclusion criteria included use of CYP3A inhibitors (eg, ketoconazole or itraconazole) or inducers (eg, rifampin) within 14 days (or 5 half‐lives, whichever was longer) prior to dosing; evidence or history of significant diseases; clinically significant infections within 3 months or any infection within 7 days of screening; history of disseminated herpes simplex or recurrent or disseminated herpes zoster infection; and personal or family history of hereditary immunodeficiency.
Study Design
Single‐ and Multiple‐Dose Relative Bioavailability Study (Study A)
Study A (Pfizer study A3921212) was a randomized, open‐label, 2‐way crossover study of tofacitinib XR 11 mg QD and tofacitinib IR 5 mg BID. Twenty‐four healthy male subjects were enrolled at a Pfizer Clinical Research Unit in Brussels, Belgium.
In this 2‐period study, each period comprised a single‐dose phase followed by a multiple‐dose phase of the same formulation. Subjects were randomized to receive tofacitinib XR or IR tablets in a crossover fashion. The XR treatment consisted of a single dose of tofacitinib XR 11‐mg tablet on day 1, followed by QD dosing of the XR formulation tablets from days 3 through 7. The IR treatment consisted of 2 doses of tofacitinib IR 5‐mg tablets approximately 12 hours apart on day 1, followed by BID dosing (12 hours apart) of the IR formulation tablets on days 3 through 7. Figure 1 shows the treatment administration schema of the study. The multiple‐dose phase continued for 5 days across both (XR and IR) treatments; therefore study day 7 was day 5 of the multiple‐dose phase, and “day 5” when used elsewhere is referring to study day 7 unless otherwise indicated. The 2 periods were separated by a ≥72‐hour washout from the last morning dose of the multiple‐dose phase. In addition, between the single‐ and multiple‐dose phases of each period, there was a ≥48‐hour washout from the morning dose of the single‐dose phase.
Figure 1.
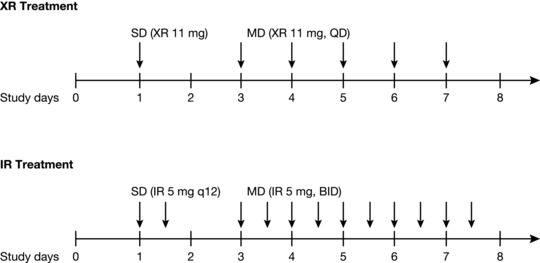
Schematic of study treatments and dosing (study A). Healthy volunteers received both XR and IR treatments in a randomized crossover fashion. Arrows represent treatment administration. BID, twice daily; IR, immediate‐release; MD, multiple dose; q12, 12 hours apart; QD, once daily; SD, single dose; XR, extended‐release.
The objectives of the study were to evaluate the PK of the XR formulation and to demonstrate equivalence of extent of exposure following single‐ and multiple‐dose administration of tofacitinib XR 11 mg QD and IR 5 mg BID. Safety and tolerability were monitored throughout the study.
Food Effect Study (Study B)
Study B (NCT02084875; Pfizer study A3921180) was a randomized, open‐label, single‐dose, 2‐period, 2‐way crossover study conducted at California Clinical Trials Medical Group (Glendale, California). Twenty‐four subjects (23 males and 1 female of nonchildbearing potential) were randomized to receive the tofacitinib XR 11‐mg tablet under fasted conditions or fed conditions.
For the fasted treatment, subjects received a single tofacitinib XR 11‐mg tablet with 240 mL water following a ≥10‐hour overnight fast. The fed treatment consisted of a standard (US Food and Drug Administration) high‐fat breakfast 30 minutes prior to administration of a single tofacitinib XR 11‐mg tablet with 240 mL water. The breakfast was a high‐calorie (∼800–1000 calories) and high‐fat (∼50% of total caloric content) test meal with approximately 150, 350, and 500–600 calories from protein, carbohydrate, and fat, respectively. Subjects were instructed to consume breakfast within 30 minutes or less. For each treatment, no additional food was allowed for ≥4 hours postdose, and water was withheld for 2 hours predose and postdose. A ≥72‐hour washout separated the 2 periods.
The key study objectives were to evaluate the effect of food on the PK, safety, and tolerability of a single dose of the tofacitinib XR 11‐mg tablet formulation.
PK Sampling and Analytical Method
During the single‐dose phase (day 1) of study A, samples were collected predose (0 hours) and 0.5, 1, 2, 3, 4, 6, 9, 12, 24, 36, and 48 hours postdose. For the IR treatment, blood samples were also collected at 0.5, 1, 2, 3, 4, 6, and 9 hours following the evening dose. During the multiple‐dose phase of study A (day 5), blood samples were collected in a similar serial fashion predose and through 24 hours postdose. To establish steady state, predose blood samples were collected on the morning of days 3, 4, and 5 of the multiple‐dose phase.
In study B, samples were collected predose (0 hours) and 0.5, 1, 2, 3, 4, 6, 9, 12, 24, 36, and 48 hours postdose in each treatment period.
During each treatment period in study A and study B, 4‐mL blood samples were collected to provide a minimum of 1.5 mL plasma for PK analysis. Samples were centrifuged for 10 minutes at 4°C at approximately 1700g and then stored at –20°C until analysis. Plasma samples were analyzed at WuXi AppTec (Shanghai, China) using a validated sensitive and specific high‐performance liquid chromatography tandem mass spectrometry method. Calibration standard responses were linear over the range 0.100 to 350 ng/mL, and the lower limit of quantification for tofacitinib was 0.100 ng/mL.
Pharmacokinetic Calculations
In both studies, PK parameters were calculated for each subject and treatment using noncompartmental analysis of plasma concentration‐time data with electronic noncompartmental analysis (eNCA; version 2.2.4), a Pfizer‐developed and validated software system.
In study A, PK parameters for a single dose (day 1) included AUC from zero to infinity (AUC∞), AUC for the daily dosing regimen of 24 hours (AUC24), AUC for the dosing interval (AUCτ, where τ = 12 hours for IR treatment and 24 hours for XR treatment), t½, Cmax, and tmax. PK parameters for steady state (day 5) included AUC24, AUCτ, Cmax, tmax, Cmin, morning predose plasma concentration (Ctrough), average plasma concentration (Cav), and degree of fluctuation at steady state calculated as (Cmax – Cmin)/Cav.
For both XR and IR treatments, AUCτ, Cmax, and tmax for day 1 and AUCτ, Cmax, Cmin, Cav, and degree of fluctuation for day 5 were calculated for the 0‐ to 24‐hour daily dosing regimen. For the IR treatment, which was administered as 2 doses 12 hours apart, these parameters were also calculated for the morning (hours 0–12) and evening (hours 12–24) dosing intervals. AUC24 for the IR treatment, was calculated by adding AUCτ from the morning and evening dosing intervals; AUC24 for the XR treatment is the same as AUCτ. Cav was calculated as AUC24/24 for the daily dosing interval and as AUCτ/12 for the morning and evening dosing intervals. For the IR treatment, t½ was calculated from the terminal slope of the concentration‐time profile on day 1 following administration of the evening dose.
In order to assess whether steady state had been achieved by day 5 of the multiple‐dose phase, mean Ctrough values on days 3, 4, and 5 of the multiple‐dose phase and 24 hours after the day 5 morning dose were plotted and visually examined. The accumulation ratio of AUC24 and Cmax from single‐ to multiple‐dose regimen was calculated for each treatment as the ratio of respective PK parameters from the multiple‐ to the single‐dose phase.
For the food effect study (study B), standard PK parameters including tmax, t½, Cmax, and AUC∞ were calculated. In addition, effect of food on absorption delay was characterized by absorption lag time (tlag).
Sample Size
A sample size of 22 evaluable subjects (11 subjects per sequence) in study A provided >90% power that the 90% confidence interval (CI) for the ratio of XR 11 mg to IR 10 mg administered as 2 5‐mg doses (12 hours apart) for AUC∞ was within the equivalence interval of 80% to 125% under both single‐dose and steady‐state conditions. The calculations assumed the true mean ratio (XR/IR) for AUC of 0.95 and an estimate of within‐subject standard deviation (SD) of 0.073 for natural log scale AUC following single‐ and multiple‐dose administrations, obtained as an average from previous relevant Pfizer studies. This sample size also provided 80% coverage probability that the 90%CIs for the difference between XR and IR formulations were ±0.098 for loge Cmax with an estimate of within‐subject SD of 0.169.
In study B, the sample size of 24 PK‐evaluable subjects provided 90%CIs for the difference between fed and fasted of ±0.052 on the natural log scale for AUC∞ with 80% coverage probability assuming an estimate of within‐subject SD of 0.094 for loge AUC∞ obtained for the selected formulation under its fed and fasted states.
Statistical Analysis
In both studies natural log‐transformed PK parameters were analyzed using a mixed‐effects model implemented using Proc Mixed in SAS V9.2. Sequence, period, and treatment were fixed effects, and subject within sequence was a random effect. Estimates of adjusted means differences (Test‐Reference) and 90%CIs were obtained from the above models and exponentiated to provide estimates of the ratio of adjusted geometric means (Test/Reference) and 90%CIs for the ratios. For study A, the IR formulation was the Reference treatment, and the XR formulation was the Test treatment. For study B, tofacitinib XR 11‐mg tablet administered under the fasted state was the Reference treatment, and the XR tablet administered under the fed state was the Test treatment.
To assess relative bioavailability under single‐dose conditions (day 1) in study A, AUC∞ and Cmax were analyzed; AUC24, Cmax, Cmin, and Ctrough were evaluated at steady state on day 5. Because the IR treatment was administered twice a day (Figure 1), tmax, Cmax, and Cmin following administration of the morning dose were used as references for relative bioavailability assessments with the XR treatment, which was also administered in the morning.
The effect of food in study B was assessed by analyzing AUC∞ and Cmax. If the 90%CI for the adjusted geometric mean ratio for the evaluated PK parameter fell wholly within the 80% to 125% equivalence interval, equivalence between Test and Reference treatment was concluded for that parameter.
Results
Subjects
Twenty‐four subjects were enrolled in each of the studies. In study A, all subjects were male, and most were white (87.5%). Mean (SD) age was 35.7 (10.8) years, and weight was 79.4 (11.0) kg. In study B, most subjects were male (95.8%), with 33.3% white, 37.5% black, and 29.2% Asian. Mean (SD) age was 34.5 (9.9) years, and weight was 74.3 (10.0) kg.
One subject in study A discontinued during the first treatment period (receiving tofacitinib IR 5 mg BID) due to a superficial fungal skin infection that was not considered treatment‐related by investigator determination. Therefore, although PK data from this subject were available and used in the analysis of the IR formulation, no data were available for the XR formulation for this subject because the subject did not receive the XR formulation in the second treatment period. As a result, evaluable PK data were available for all subjects (N = 24) for the IR formulation and 23 subjects for the XR formulation.
One subject in study B discontinued during the second treatment period due to conflict with his or her work schedule; however, PK sampling was completed to 24 hours postdose, so PK data from this subject were included in the analysis.
Assessment of Relative Bioavailability Under Single‐ and Multiple‐Dose Conditions
Mean concentration‐time profiles of the IR and XR formulations after single‐dose administration (day 1) and multiple‐dose administration (day 5) are presented in Figure 2. Table 1 summarizes the PK parameters of the 2 formulations under both single‐ and multiple‐dose conditions.
Figure 2.
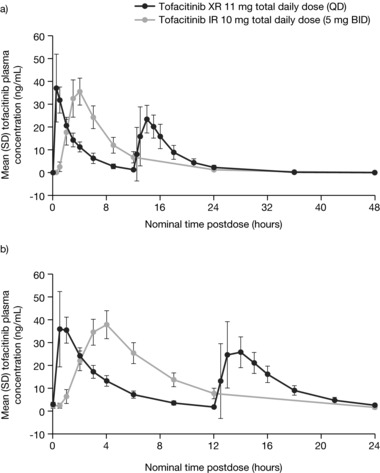
Mean (SE) tofacitinib plasma concentration‐time profiles following XR 11 mg QD and IR 5 mg BID under (a) single‐dose and (b) multiple‐dose (for 5 days) conditions. BID, twice daily; IR, immediate‐release; QD, once daily; SD, standard deviation; SE, standard error; XR, extended‐release.
Table 1.
Summary of PK Parameters of Tofacitinib Following Administration of XR 11 mg QD and IR 5 mg BID Formulations (Study A)
| Tofacitinib IR 5 mg BID (N = 24) | ||||
|---|---|---|---|---|
| Tofacitinib XR 11 mg | Combineda | Morning | Evening | |
| PK Parameter (Units) | QD (N = 23) | (0–48 h) | (0–12 h) | (12–24 h) |
| Single‐dose phase | ||||
| AUC∞(ng·h/mL) | 259.8 (56.5) | 247.9 (44.2) | − | − |
| AUC24 (ng·h/mL) | 246.5 (50.6) | 237.9 (40.8)b | − | − |
| AUCτ (ng·h/mL) | 246.5 (50.6) | − | 117.7 (20.5) | 120.3 (21.1) |
| Cmax (ng/mL) | 36.7 (6.8) | 41.2 (9.7) | 40.5 (10.3) | 28.6 (6.4) |
| tmax (h) | 4.0 (3.0, 4.0) | 0.5 (0.5, 13.0) | 0.5 (0.5, 1.0) | 2.0 (0.5, 4.0) |
| t½ (h) | 5.9 (1.8) | 3.2 (0.8) | − | − |
| Multiple‐dose phase (steady state) | ||||
| AUC24 (ng·h/mL) | 272.9 (45.9) | 266.1 (38.5) | − | − |
| AUCτ (ng·h/mL) | 272.9 (45.9) | − | 133.3 (21.2) | 132.8 (19.0) |
| Cav (ng/mL) | 11.4 (1.9) | 11.1 (1.6) | 11.1 (1.8) | 11.1 (1.6) |
| Cmin (ng/mL) | 1.3 (0.7) | 1.5 (0.6) | 1.6 (0.5) | 1.5 (0.6) |
| Ctrough (ng/mL) | 2.2 (1.2) | 2.70 (1.0) | − | − |
| Cmax (ng/mL) | 38.7 (6.1) | 44.1 (11.6) | 42.2 (11.1) | 34.3 (8.9) |
| tmax (h) | 4.0 (3.0, 4.0) | 1.0 (0.5, 14.0) | 0.5 (0.5, 1.0) | 1.0 (0.5, 4.0) |
| Degree of fluctuationc | 3.3 (0.5) | 3.8 (0.9) | 3.7 (0.9) | 3.0 (0.6) |
Combined morning and evening doses.
For IR treatment, AUC24 = AUCτ for the morning (0–12 hours) + AUCτ for the evening (12–24 hours) dosing intervals.
Degree of fluctuation calculated as (Cmax – Cmin)/Cav.
All parameters are arithmetic mean (standard deviation) except median (range) for tmax.
AUC∞, area under the plasma concentration‐time curve from zero to infinity; AUC24, area under the plasma concentration‐time curve from 0 to 24 hours; AUCτ, area under the plasma concentration‐time curve during the dosing interval (24 hours for XR, 12 hours for IR); BID, twice daily; Cav, average plasma concentration over the dosing interval; Cmax, maximum plasma concentration; Cmin, minimum plasma concentration; Ctrough, morning trough (predose) plasma concentration; IR, immediate‐release; PK, pharmacokinetic; QD, once daily; t½, terminal half‐life; tmax, time to Cmax; XR, extended‐release.
Consistent with the extended‐release properties of the XR formulation, Cmax on day 1 was reached later for the XR formulation (median tmax 4 hours) than for the IR formulation (median tmax following morning dose 0.5 hours), and t½ was longer for the XR (mean 5.9 hours) compared with the IR formulation (mean 3.2 hours). Although Cmax was achieved later with the XR formulation, mean Cmax (36.7 ng/mL) was similar to that under the IR formulation (mean Cmax following morning dose: 40.5 ng/mL).
As presented in Table 2, following single‐dose administration, 90%CI for the adjusted geometric mean ratio for AUC∞ (XR/IR) was within the 80% to 125% equivalence interval, demonstrating equivalence of tofacitinib total daily exposure for tofacitinib XR 11 mg and tofacitinib IR 10 mg total daily dose. The 90%CI for the ratio of Cmax values was also within the 80% to 125% equivalence interval.
Table 2.
Statistical Comparison of PK Parameters of Tofacitinib Following XR 11‐mg QD and IR 5‐mg BID Treatments Under Single‐ and Multiple‐Dose Conditions (Study A)
| Adjusted Geometric Means | Ratio | |||
|---|---|---|---|---|
| PK Parameter (Units) | Tofacitinib XR 11 mg QD (Test) | Tofacitinib IR 5 mg BID (Reference) | (Test/Reference) of Adjusted Geometric Meansa | 90%CI for Ratioa |
| Single‐dose phase | ||||
| AUC∞ (ng·h/mL) | 253.2 | 243.7 | 103.9 | 98.1, 109.3 |
| Cmax b (ng/mL) | 36.0 | 39.2 | 91.8 | 83.3, 101.1 |
| Multiple‐dose phase (steady‐state) | ||||
| AUC24 (ng·h/mL) | 268.5 | 263.4 | 101.9 | 97.8, 106.3 |
| Cmax b (ng/mL) | 38.2 | 40.9 | 93.4 | 84.1, 103.7 |
| Ctrough (ng/mL) | 1.8 | 2.5 | 73.5 | 57.7, 93.7 |
| Cmin b (ng/mL) | 1.0 | 1.5 | 70.6 | 59.0, 84.6 |
The ratios (and 90%CI) are expressed as percentages.
Represents values following morning dose of tofacitinib IR 5 mg.
AUC, area under the concentration‐time curve; AUC∞, AUC from 0 to infinity; AUC24, AUC from 0 to 24 hours; BID, twice daily; CI, confidence interval; Cmax, maximum plasma concentration; Cmin, minimum plasma concentration; Ctrough, morning trough (predose) plasma concentration; IR, immediate‐release; PK, pharmacokinetic; QD, once daily; XR, extended‐release.
Under steady‐state conditions, the 90%CI for the adjusted geometric mean ratio for AUC24 and Cmax (XR/IR) was within the 80% to 125% equivalence interval. Therefore, equivalence between tofacitinib XR 11 mg QD and tofacitinib IR 5 mg BID was demonstrated for tofacitinib total daily exposure and Cmax. On day 5, the ratio of Cmin values was 70.6% (90%CI: 59.0, 84.6), indicating approximately 29% lower Cmin for the XR treatment than for the IR treatment. The ratio of adjusted geometric means for Ctrough was 73.5% (90%CI: 57.7, 93.7), resulting in an approximately 26% lower Ctrough for XR 11 mg QD compared with IR 5 mg BID.
Figure 3 shows the time course of mean Ctrough values collected on the morning of day 3 through day 5 of the multiple‐dose phase. Concentrations at 24 hours after the last dose on day 5 (ie, on day 6) were also included in this assessment. Predose concentrations were generally similar through day 6, indicating that steady state had been achieved within 48 hours of multiple‐dose administration for both treatments. Multiple‐ to single‐dose accumulation ratios were approximately 6% and 12% for Cmax and AUC24, respectively, for the XR formulation. This was consistent with the negligible accumulation observed for the IR formulation (4% and 12% for Cmax and AUC24, respectively). Degree of fluctuation of plasma concentration with the XR formulation (mean: 3.3) was approximately 13% lower than that for the IR formulation (mean: 3.8).
Figure 3.

Mean (SE) Ctrough by study day for tofacitinib XR 11 mg QD and tofacitinib IR 5 mg BID. Day 6 sample represents a 24‐hour sample following last dose on day 5. BID, twice daily; Ctrough, predose plasma concentration; IR, immediate‐release; QD, once daily; SE, standard error; XR, extended‐release.
Effect of Food
Mean tofacitinib plasma concentration‐time profiles following administration of tofacitinib XR 11‐mg tablets under fasted and fed conditions are presented in Figure 4.
Figure 4.
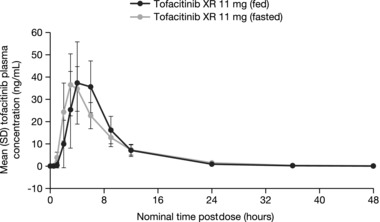
Mean (SE) tofacitinib plasma concentration‐time profiles following single doses of tofacitinib XR 11‐mg tablets under fasted and fed conditions. SE, standard error; XR, extended‐release.
With food, tofacitinib absorption was slightly delayed, as observed by median tlag of 0.5 hour (Table 3). Mean Cmax for the fed treatment (48.3 ng/mL) was slightly higher than that for the fasted treatment (38.9 ng/mL) and was reached 1 hour later. Mean t½ was shorter (4.4 hours) for fed treatment compared with fasted treatment (5.5 hours). Box plots comparing individual and geometric mean Cmax and AUC∞ for fed and fasted treatments are presented in Figure 5. For both PK parameters, the range of individual exposures under the fed state was consistent and well within the range of individual exposures under the fasted state.
Table 3.
Descriptive Summary and Statistical Comparisons of PK Parameters of Tofacitinib Following Administration of a Single Dose of XR Formulation Under Fasted and Fed Conditions (Study B)
| PK Parameter (Units) | Tofacitinib XR 11 mg Fed | Tofacitinib XR 11 mg Fasted |
|---|---|---|
| Summary statisticsa | ||
| tmax (h) | 4.0 (3.0, 6.0) | 3.0 (2.0, 6.0) |
| tlag (h) | 0.5 (0.0, 2.0) | 0.0 (0.0, 0.5) |
| t½ (h) | 4.4 (1.5) | 5.5 (1.3) |
| AUC∞ (ng·hr/mL) | 274.6 (57.7) | 273.2 (65.3) |
| Cmax (ng/mL) | 48.3 (11.3) | 38.9 (12.9) |
| Statistical summary of effect of food on AUC∞ and Cmax b | ||
| AUC∞ | 268.6 | 265.6 |
| Fed/fasted ratio (90%CI)c | 101.1 (96.9, 105.5) | |
| Cmax | 47.09 | 37.02 |
| Fed/fasted ratio (90%CI)c | 127.2 (116.6, 138.8) | |
All parameters are arithmetic mean (standard deviation) except: median (range) for Tmax and Tlag.
All parameters are geometric mean (geometric percentage coefficient of variation) except: median (range) for tmax and tlag, arithmetic mean (standard deviation) for t½.
The ratios (and 90%CI) are expressed as percentages. Statistical comparisons are based on ratios of adjusted geometric means.
AUC∞, area under the plasma concentration‐time curve from 0 to infinity; CI, confidence interval; Cmax, maximum plasma concentration; PK, pharmacokinetic; t½, terminal half‐life; tlag, lag time; tmax, time to Cmax; XR, extended‐release.
Figure 5.
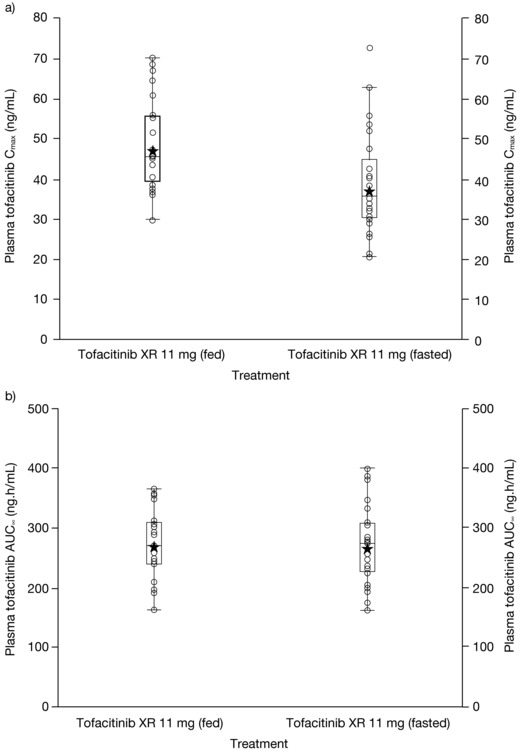
Individual and geometric mean (a) Cmax and (b) AUC∞ of tofacitinib XR 11 mg under fasted and fed conditions. Stars represent geometric means, and circles represent individual volunteers. Box plot provides median and 25%/75% quartiles, with whiskers to the last point within 1.5 × interquartile range. AUC∞, area under the plasma concentration‐time curve from zero to infinity; Cmax, maximum plasma concentration; XR, extended‐release.
Statistical analysis (Table 3) showed that tofacitinib total exposure was equivalent under fed and fasted conditions: fed/fasted ratio for AUC∞ was 101.1% (90%CI: 96.9, 105.5) with the 90%CI wholly within the 80% to 125% equivalence interval. The ratio for the geometric mean of Cmax was 127.2% (90%CI: 116.6, 138.8), suggesting a 27% increase in Cmax with food.
Safety
There were no deaths, serious adverse events (AEs), severe AEs, or events of special interest in either study A or study B. One subject was permanently discontinued in study A due to an AE (superficial fungal skin infection) not considered to be related to tofacitinib treatment. In study A, 18 of the 24 subjects had at least 1 treatment‐emergent AE (TEAE), with a total of 40 TEAEs reported. In study B, 2 of the 24 subjects had 1 TEAE. Most AEs in these studies were considered to be mild and related to study treatment. Among all AEs that were attributed to tofacitinib across both studies combined, the greatest number of subjects reported AEs in the system organ class of gastrointestinal disorders. The most frequently reported TEAEs were change in bowel habit (n = 3) and diarrhea (n = 5). No major differences were observed between tofacitinib XR 11 mg QD and tofacitinib IR 5 mg BID in the frequency and/or type of AEs reported.
None of the reported AEs across the 2 studies were considered clinically important, and no clinically significant safety findings were noted on review of data collected from physical examinations, clinical laboratory tests, vital signs, or electrocardiograms.
Discussion
Tofacitinib, an oral JAK inhibitor, is currently approved for the treatment of RA as an IR formulation, which is administered BID. This is the first published report of the full characterization of PK performance of an XR formulation of tofacitinib that may provide a once‐daily dosing option.
These 2 phase 1 studies were designed to evaluate the PK and bioavailability of the XR formulation relative to the IR formulation and to assess the impact of food on drug absorption of the XR formulation. Safety and tolerability of the tofacitinib XR formulation in healthy volunteers were also assessed in these studies.
Regulatory guidance9, 10 for modified or XR drug formulations recommends an assessment of relative bioavailability under single‐dose and steady‐state conditions. To achieve this objective, we consolidated the single‐ and multiple‐dose assessments, separated by an appropriate washout, into a single study design (Figure 1). This design component, supported by the short PK half‐life of tofacitinib, offered several advantages. For instance, relative bioavailability assessments between the 2 formulations under both single‐dose and steady‐state conditions were plausible within a single randomized crossover study, leading to an efficient study design. It also limited the number of healthy volunteers subjected to study drug. Finally, it enabled single‐ to multiple‐dose PK comparisons for each formulation within the same study.
For single‐dose relative bioavailability assessments between IR and XR formulations, it is common for the total daily IR dose to be administered as a single dose. By contrast, the IR 10‐mg total daily dose in the current study (study A) was administered as 2 doses of IR 5 mg, 12 hours apart in the single‐dose phase. This approach ensured that the total daily dose was equivalent over the least common time interval (ie, 24 hours) between the 2 formulations. This was designed in line with the current US Food and Drug Administration guidance for modified and XR drug products,9 and it also facilitated regimen‐based comparisons between the XR and IR treatments under single‐dose conditions.
Consistent with the properties of the XR formulation, Cmax was reached later for the XR 11‐mg than for IR 5‐mg dose. Despite this, Cmax was similar between the 2 formulations. The 2‐fold longer t½ of the XR formulation is likely to be a function of the absorption‐limited disposition of tofacitinib due to extended drug release. Under both single‐dose and steady‐state conditions, the XR formulation demonstrated equivalence of AUC and Cmax compared with the IR formulation as seen by 90%CI of the XR/IR ratio being completely contained within the 80% to 125% equivalence interval. Minimum plasma concentrations, as measured by Cmin and Ctrough, were approximately 29% and 26% lower, respectively, for the XR formulation (Table 2). Evaluation of Ctrough suggested that steady state was achieved within 48 hours of QD dosing of tofacitinib XR.
The accumulation of tofacitinib following repeat administration of the XR formulation was negligible (less than 20%), which is consistent with its t½ of approximately 6 hours. These PK attributes are consistent with those of the IR formulation.
Interactions of food with XR drug formulations, which are designed to prolong or delay the rate of drug release, are especially important. Results of the food effect evaluation with tofacitinib XR formulation showed a slightly prolonged Tmax (fed vs fasted difference: 1 hour), a modest increase (27%) in Cmax, and no change (geometric mean under fed conditions: 268.6 ng · h/mL, geometric mean under fasted conditions: 265.5 ng · h/mL) in AUC. This can potentially be explained by the properties of the ECS formulation and the physiology of the gastrointestinal system. A high‐fat meal may increase the gastric residence time, which would enable drug release to occur in the stomach for a prolonged period of time. As the meal is then emptied from the stomach and delivered to the small intestine, released drug is also presented to the small intestine, where it is readily absorbed. Therefore, in the fed state, a greater proportion of the drug is likely to be absorbed in the upper part of the small intestine, compared with the fasted state where deconvolution data from the XR formulation have suggested that the drug is absorbed throughout the intestinal tract as it transits through (data on file). This may lead to the observed increase in Cmax with food for the XR formulation. Total exposures, as measured by AUC∞, were essentially similar under fed and fasted conditions and met the bioequivalence criteria. Given that the AUC was essentially the same under fasted or fed conditions, the modest increase in Cmax was not considered meaningful. In addition, a lack of significantly higher plasma concentrations in the initial time points of PK sampling, as shown in Figure 4, and slightly later Tmax under fed state confirms the absence of dose dumping. Furthermore, the range of exposures between the fed and fasted state was also similar.
The rate of drug release from the osmotic delivery system, a nondeformable dosage form, is generally independent of the effect of physiological factors such as the effect of food and pH.11 Consequently, data from this study showing a lack of significant food effect on the ECS formulation of tofacitinib are consistent with other drugs formulated with osmotic delivery systems for which no impact of food on bioavailability is reported, including methylphenidate,12 metoprolol,13 oxprenolol,14 and nifedipine.15 Although 11% to 30% increases in Cmax have been reported for the osmotic formulations of nifedipine and methylphenidate for fed vs fasted administration, no impact has been observed on extent of absorption.11
Conclusions
The results of relative bioavailability assessments demonstrated total and peak exposures that were equivalent between XR and IR formulations of tofacitinib, as measured by AUC and Cmax. Consistent with a t½ of approximately 6 hours, steady state with tofacitinib XR formulation was achieved within 48 hours of dosing. It showed negligible accumulation following repeat administration. Food had no effect on total systemic exposure of the XR formulation, but a modest increase in Cmax was observed. Tofacitinib XR 11‐mg tablets were found to be generally well tolerated in healthy volunteers. The ECS tablet formulation of tofacitinib offers a convenient once‐daily dosing option for tofacitinib.
Acknowledgments
The authors would like to thank the principal investigators of the clinical research units, Dr Constantine Kantaridis (Pfizer CRU) and Dr Esther Yoon (California Clinical Trials Medical Group). This study was sponsored by Pfizer Inc. Medical writing support, under the direction of the authors, was provided by Amanda Pedder of Complete Medical Communications and funded by Pfizer Inc.
Conflict of Interest Disclosure
M. Lamba, T. Stock, R. Wang, T. Fletcher, C. Alvey, and J. Kushner are employees and shareholders of Pfizer Inc.
References
- 1. Meyer DM, Jesson MI, Li X, et al. Anti‐inflammatory activity and neutrophil reductions mediated by the JAK1/JAK3 inhibitor, CP‐690,550, in rat adjuvant‐induced arthritis. J Inflamm (Lond). 2010;7(1):41. [DOI] [PMC free article] [PubMed] [Google Scholar]
- 2. Changelian PS, Moshinsky D, Kuhn CF, et al. The specificity of JAK3 kinase inhibitors. Blood. 2008;111(4):2155–2157. [DOI] [PubMed] [Google Scholar]
- 3. Riese RJ, Krishnaswami S, Kremer J. Inhibition of JAK kinases in patients with rheumatoid arthritis: scientific rationale and clinical outcomes. Best Pract Res Clin Rheumatol. 2010;24(4):513–526. [DOI] [PubMed] [Google Scholar]
- 4. Cohen S, Zwillich SH, Chow V, LaBadie RR, Wilkinson B. Co‐administration of the JAK inhibitor CP‐690,550 and methotrexate is well tolerated in patients with rheumatoid arthritis without need for dose adjustment. Br J Clin Pharmacol. 2010;69(2):143–151. [DOI] [PMC free article] [PubMed] [Google Scholar]
- 5. Hutmacher MM, Krishnaswami S, Kowalski KG. Exposure‐response modeling using latent variables for the efficacy of a JAK3 inhibitor administered to rheumatoid arthritis patients. J Pharmacokinet Pharmacodyn. 2008;35(2):139–157. [DOI] [PubMed] [Google Scholar]
- 6. Coleman CI, Limone B, Sobieraj DM, et al. Dosing frequency and medication adherence in chronic disease. J Manag Care Pharm. 2012;18(7):527–539. [DOI] [PMC free article] [PubMed] [Google Scholar]
- 7. Waterman KC, MacDonald BC, Roy MC. Extrudable core system: development of a single‐layer osmotic controlled‐release tablet. J Control Release. 2009;134(3):201–206. [DOI] [PubMed] [Google Scholar]
- 8. Lamba M, Wang R, Fletcher T, et al. Pharmacokinetics, bioavailability and safety of a modified release once daily formulation of tofacitinib in healthy volunteers. Ann Rheum Dis. 2014;73(Suppl 2):228. Abstract THU0143. [Google Scholar]
- 9. Food and Drug Administration . Guidance for Industry: Bioavailability and Bioequivalence Studies Submitted in NDAs or INDs—General Considerations. 2014. http://www.fda.gov/downloads/drugs/guidancecomplianceregulatoryinformation/guidances/ucm389370.pdf.
- 10. European Medicines Agency . Guideline on quality of oral modified release products. 2014. http://www.ema.europa.eu/docs/en_GB/document_library/Scientific_guideline/2014/07/WC500170465.pdf.
- 11. Malaterre V, Ogorka J, Loggia N, Gurny R. Oral osmotically driven systems: 30 years of development and clinical use. Eur J Pharm Biopharm. 2009;73(3):311–323. [DOI] [PubMed] [Google Scholar]
- 12. Modi NB, Wang B, Hu WT, Gupta SK. Effect of food on the pharmacokinetics of osmotic controlled‐release methylphenidate HCI in healthy subjects. Biopharm Drug Dispos. 2000;21(1):23–31. [DOI] [PubMed] [Google Scholar]
- 13. van den Berg G, van Steveninck F, Gubbens‐Stibbe JM, Schoemaker HC, de Boer AG, Cohen AF. Influence of food on the bioavailability of metoprolol from an OROS system; a study in healthy volunteers. Eur J Clin Pharmacol. 1990;39(3):315–316. [DOI] [PubMed] [Google Scholar]
- 14. John VA, Smith SE. Influence of food intake on plasma oxprenolol concentrations following oral administration of conventional and Oros preparations. Br J Clin Pharmacol. 1985;19(Supplement 2):191S–195S. [DOI] [PMC free article] [PubMed] [Google Scholar]
- 15. Grundy JS, Foster RT. The nifedipine gastrointestinal therapeutic system (GITS). Evaluation of pharmaceutical, pharmacokinetic and pharmacological properties. Clin Pharmacokinet. 1996;30(1):28–51. [DOI] [PubMed] [Google Scholar]