

Summary
Background
Personalised medicine, including biomarkers for treatment selection, may provide new algorithms for more effective treatment of patients. Genetic variation may impact drug response and genetic markers could help selecting the best treatment strategy for the individual patient.
Aim
To identify polymorphisms and candidate genes from the literature that are associated with anti‐tumour necrosis factor (TNF) treatment response in patients with inflammatory bowel diseases (IBD), Crohn's disease (CD) and ulcerative colitis.
Methods
We performed a PubMed literature search and retrieved studies reporting original data on association between polymorphisms and anti‐TNF treatment response and conducted a meta‐analysis.
Results
A functional polymorphism in FCGR3A was significantly associated with anti‐TNF treatment response among CD patients using biological response criterion (decrease in C‐reactive protein, levels). Meta‐analyses showed that polymorphisms in TLR2 (rs3804099, OR (95% CI) = 2.17 (1.35–3.47)], rs11938228 [OR = 0.64 (0.43–0.96)], TLR4 (rs5030728) [OR = 3.18 (1.63–6.21)], TLR9 (rs352139) [OR = 0.43 (0.21–0.88)], TNFRSF1A (rs4149570) [OR = 2.06 (1.02–4.17)], IFNG (rs2430561) [OR = 1.66 (1.05–2.63)], IL6 (rs10499563) [OR = 1.65 (1.04–2.63)] and IL1B (rs4848306) [OR = 1.88 (1.05–3.35)] were significantly associated with response among IBD patients using clinical response criteria. A positive predictive value of 0.96 was achieved by combining five genetic markers in an explorative analysis.
Conclusions
There are no genetic markers currently available which are adequately predictive of anti‐TNF response for use in the clinic. Genetic markers bear the advantage that they do not change over time. Therefore, hypothesis‐free approaches, testing a large number of polymorphisms in large, well‐characterised cohorts, are required in order to identify genetic profiles with larger effect sizes, which could be employed as biomarkers for treatment selection in clinical settings.
Introduction
The inflammatory bowel diseases (IBD) ulcerative colitis (UC) and Crohn's disease (CD) are inflammatory disorders primarily affecting the gut.1 The incidence is increasing worldwide and IBD may affect up to 1% of the population.2 Both CD and UC have a major impact on the quality of life of the patients and their families due to debilitating symptoms and also for the society due to absence from work and health care expenses. IBD is considered to develop as a result of a persistent perturbation of the interaction between the gut microbiota and the host immune system resulting in changes in the microbiome (dysbiosis) and in mucosal inflammation.3 Stimulation of toll‐like receptors and nod‐like receptors on epithelial cells and local immune cells by microbes induce various pathways that mediate the secretion of the pro‐inflammatory cytokines interleukine (IL)‐17, IL‐6, interferon‐γ, and tumour necrosis factor‐α (TNF)4, 5, 6, 7, 8 resulting in disruption of the barrier function (mainly in UC), dysfunction of microbe sensing (mainly in CD), and changes in the regulation of adaptive immune responses (in both disorders).8 The biological activity of TNF is mediated by its binding to TNF receptor type 1 (TNFR1) and type 2 (TNFR2). After binding to the receptors, TNF initiates cell proliferation, differentiation and pro‐inflammatory signalling [via activation of the nuclear factor‐κB (NF‐κB) and mitogen‐activated protein kinases (MAPK) pathways].9 Additionally, TNF signalling induces apoptosis of intestinal epithelial cells as well as inducing changes in the epithelial expression of tight junction proteins (via caspase‐8 activation).9 Hence, increased TNF‐α expression might decrease the mucosal barrier function.9
Biologics are bioengineered therapeutic agents targeting a gene or a protein. The management of IBD has changed significantly during the last decade due to the availability of anti‐TNF.10, 11 They act through targeting and neutralising the effect of TNF thereby diminishing the downstream effects of TNF activation. However, the pharmacodynamics of anti‐TNF drugs seems to depend on other factors than simply the TNF‐binding capacities.9 Hence, their precise mechanism of action remains unclear. Anti‐TNF drugs have proven highly effective for many patients, yet, a significant proportion of the patients do not respond to the treatment (i.e., ‘primary failures’) due to e.g. genetics or loss of effect over time to become intolerant due to the development of antibodies to the treatment (i.e., ‘secondary failures’).9, 10, 11
Currently, much effort has been put into developing biologics targeting various players in the immune cascade which are involved in IBD,4 including cytokines, cytokine receptors, B‐ and T‐cell surface proteins, cell adhesion molecules, and signal transduction pathways.12 Various immune players may be driving the disease in various patients and the detection of which are the most prominent in the individual patient will be necessary for selecting the best treatment strategy. Until now, the strategy for testing these new biologics in clinical settings used to be ‘one drug suits all’, although they may be beneficial in only a subset of patients characterised by a specific target. Thereby, theoretically, the effect of biologics on a specific subset of the patients may not be detected.
‘Personalised Medicine refers to a medical model using characterisation of individual's phenotypes and genotypes (e.g. molecular profiling, medical imaging, lifestyle data) for tailoring the right therapeutic strategy for the right person at the right time, and/or to determine the predisposition to disease and/or to deliver timely and targeted prevention’.13 According to the Strategic Research and Innovation Agenda (SRIA), European Union, ‘Personalised Medicine represents one of the most innovative new concepts in health care. It holds real promise for more effective early diagnosis and more effective and less toxic treatments for patients, for improved medical service to citizens, and for improving the overall health of the population’.13
Recently, interest in exploring the potentials of personalised medicine in IBD has raised.14, 15, 16 Accordingly, clinical factors associated with anti‐TNF response in CD has been reviewed.15, 17 In CD, young age, short disease duration, and luminal disease were associated with beneficial response and smoking was associated with nonresponse.17 Pre‐treatment C‐reactive protein (CRP) levels and serological markers may also have predictive value.17 The knowledge on factors associated with TNF response in UC are even more scarce.18
Pharmacogenetic studies may help identifying patients likely to benefit from a given treatment and the actual pathways by which a drug works.19, 20 Furthermore, the identification of genetic profiles characterising the nonresponders may lead to understanding of the mechanisms that are active in the nonresponders and may suggest target(s) for treatment strategies in these patients. In pharmacogenetic studies in general, polymorphisms in both the pharmacodynamic (the ‘action’ of the drug) as well as in the pharmacokinetic (the ‘fate’ of the drug) pathways may be relevant in predicting the outcome of the treatment. Genetic variants have already found their way into clinical practice for treatment selection of e.g. hepatitis and colorectal cancer.21, 22 Thus, genetic variants enabling the prediction of anti‐TNF treatment response may help optimising treatment of the individual patients, improve the use of the health care resources and reduce adverse side‐effects.
In order to drive the development of personalised medicine in IBD, we conducted a systemic review of the current knowledge on genetic variants associated with anti‐TNF treatment response in patients with IBD. Our aim was to identify potential candidates for further evaluation and putative predictive biomarkers should subsequently be evaluated, validated and eventually adopted for clinical use. Thus, this review deals with primary response which should be distinguish from secondary loss of response, i.e. the situation when a patient loses response after initial response.
Materials and methods
A systematic review and meta‐analysis were carried out according to the guidelines of ‘Preferred Reporting Items for Systematic Reviews and Meta‐Analyses’ (PRISMA) statement.23 To identify the relevant primary literature three individual searches were performed in PubMed using various alternative search terms for (i) “anti‐TNF treatment”, (ii) “genetic variation”, and (iii) “autoimmune disease”, respectively. Subsequently, studies appearing in all of the three searches were identified resulting in 572 abstracts (latest search date: 27 October 2015). Figure 1 shows the search strategy and a full list of search terms is shown in Table S1. All studies suggesting that they presented original data on polymorphisms and anti‐TNF treatment response were retrieved (138 articles) and reviewed by three independent authors (SB, JVN, VA). Studies were excluded due to small numbers of study participants for treatment evaluation (less than 100 cases), missing data, not reporting original data and not reporting data on anti‐TNF response (78 studies). In total, 60 studies reported on genetic markers and anti‐TNF response in autoimmune diseases whereof 15 reported on IBD (and the others on ankylosing arthritis, psoriasis and rheumatoid arthritis). No further studies were identified by searching the literature list of the retrieved articles.
Figure 1.
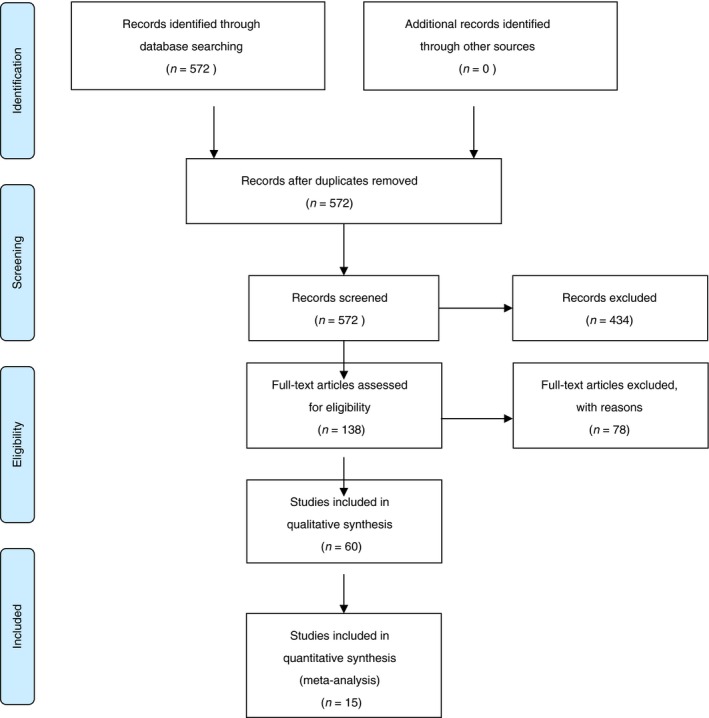
Flow chart for studies included in this review.
Data from articles with available data on Odds ratios (OR) and 95% confidence intervals (CI) or numbers of responders (complete or partial), nonresponders, and genotypes were included.
Statistical methods
All polymorphisms studied in at least two studies and where data on genotypes and treatment response could be retrieved, were included in a meta‐analysis. The meta‐analysis was based on total number of patients in the included cohorts. Analyses were performed in stata version 14 (StataCorp, College Station, TX, USA) using the meta‐analysis plugin, metan. OR's were pooled using the Mantel–Haenszel approach for fixed effects.24
To illustrate the potential predictive value of genetic variants, we analysed original data from Bank et al.25 We made an initial screening of all individual polymorphisms in a series of logistic regressions predicting nonresponse. The logistic outcome was code 0 for full or partial response and 1 for nonresponse. On this basis we identified five different genotypes significantly associated with nonresponse among UC patients (TLR2 rs4696480TT, TLR2 rs11938228AC, IL6 rs10499563TT, IL12B rs3212227AC and IL12B rs3212217CG). Next, we combined these five genotypes into a simple sum score (0 if none were present, 1 if one were present, etc, and 5 if all five were present). These sum scores were used to predict nonresponse (0 = full or partial response, 1 = nonresponse). Lastly, we calculated positive and negative predictive values for the sum scores. The negative predictive value reflects the proportion of patients with a particular genetic profile that did not respond to anti TNF treatment. Similarly, the positive predictive value expresses the proportion of patients with a particular genetic profile that did respond to anti TNF treatment. P‐value <0.05 was considered statistically significant.
Results
Table 1 summarises the details of the retrieved studies. No published genome‐wide association study on anti‐TNF response in IBD including more than 100 treated cases was identified. In total, 15 studies were included in the analysis. All 15 studies were case–case studies employing a candidate gene design.25, 26, 27, 28, 29, 30, 31, 32, 33, 34, 35, 36, 37, 38, 39 Fifteen studies reported associations between polymorphisms and treatment response in CD26, 27, 28, 29, 30, 31, 32, 33, 34, 35, 36, 37, 38, 39 and one article reported, in addition to the CD study also a study on UC patients.25 The studies differed according to the studied population, response criteria, and elapsed time before evaluation of response (Table 1).
Table 1.
Description of the 15 studies of association between polymorphisms and response to anti‐TNF treatment
| Disease | Ethnicity/Country | Treatment Drug(s) | Response criteria based on | Response time | N cases | References |
|---|---|---|---|---|---|---|
| CD | Multicentera | Infliximab | CDAIb | 2 weeks | 90 + 444 | Mascheretti et al.27 |
| CD | Belgium | Infliximab | CDAIb or fistulac | 4 and 10 weeks | 245 | Vermeire et al.38 |
| CD | Belgium | Infliximab | CDAIb or fistula numberc | 4 weeks | 226 | Louis et al.28 |
| CD | Multicentera | Infliximab | CDAIb | 4 weeks | 90 + 444 | Mascheretti et al.26 |
| CD | Belgium | Infliximab | CDAIb, fistulad, or CRPe, CRPf | 4 weeks | 145 | Louis et al.29 |
| CD | Belgium | Infliximab | CDAIb or CRPg | 4 and 8 weeks | 166 | Pierik et al.30 |
| CD | Belgium | Infliximab | CDAIb or fistulad or CRPh | 4 and 10 weeks | 204 | Hlavaty et al.39 |
| CD | Belgium | Infliximab | CDAIb , i, fistulad, or CRPe,f | 10 weeks | 189 | Willot et al.31 |
| CD | Caucasian | Infliximab | CDAIb or fistulac or CRPk | 12 weeks | 150 | Dideberg et al.32 |
| CD | Caucasian | Infliximab | CDAIb, fistulad, CRPf,j | 4 and 10 weeks | 222 | Dideberg et al.33 |
| CD | 95.3% Caucasian | Infliximab | CDAIb,i or fistulac or CRPe,f | 2 and 6 weeks | 344/156 | Louis et al.34 |
| CD | Japan | Infliximab | CDAIi, CRPf | 4, 8 and 30 weeks | 102 | Moroi et al.35 |
| CD | Caucasian (Spanish) | Infliximab | HBIk, fistulad | 10 weeks | 297 | Medrano et al.36 |
| CD | Denmark | Infliximab/Adalimumab | SCTSSl | Within 22 weeks | 482 | Bank et al.25 |
| CD | Slovenian | Adalimumab | IBDQm, CRPh | 4, 12, 20 and 30 weeks | 102 | Koder et al.37 |
| UC | Denmark | Infliximab/Adalimumab | SCTSSl | Within 22 weeks | 256 | Bank et al.25 |
German (cohort I), North America, Europe, Canada, Israel (cohort II).
Crohn's disease activity index (CDAI); Clinical response (remission): CDAI below 150, partial response (response): drop of at least 70 CDAI points.
Fistula number: Complete response (remission): at least 50% reduction in number of fistulae from baseline at two consecutive visits.
Fistula number: Complete response (remission): complete fistula closure, partial response: at least 50% reduction in number of fistulae from baseline at two consecutive visits.
C‐reactive Protein (CRP); Biological response: drop in CRP to normal values (<3 mg/L), partial response: drop in CRP level of more than 25%.
CRP, decrease in CRP, absolute and/or relative values, among entire cohort or subgroup having elevated CRP concentrations.
CRP; Biological remission were defined as a normalisation (<3 mg/L) and biological response was defined as a >12 mg/L decrease (the mean decrease in CRP) of CRP.
C‐reactive protein (CRP); Biological response: drop in CRP to normal values (<3 mg/L) or drop in CRP level of more than 25%.
CDAI, decrease in CDAI, absolute and/or relative.
CRP; Response was defined as a drop in CRP level of more than 25% among patients with an elevated CRP before treatment (more than twice the upper limit of the normal range).
Harvey–Bradshaw index (HBI); Clinical response (remission): a final HBI lower than 4 and absence of concomitant corticosteroids, partial response (response): a decreased in HBI by more than 3 points and absence of concomitant corticosteroids.
Simple Clinical Three Step Scale (SCTSS); Response: absence or near absence of all clinical symptoms without increase in corticosteroids, Partial response: improvement or tapering of corticosteroids without worsening, nonresponse: No change or worsening of symptoms.
IBD questionnaire (IBDQ); Clinical response was defined as an increase in IBDQ of at least 22 or an IBDQ of at least 170.
The polymorphisms investigated in relation to the outcome from anti‐TNF treatment of patients with CD and UC are shown in Table 2. The OR and 95% CI for the associations between the polymorphisms and the treatment responses for the polymorphisms that were assessed in more than one cohort were retrieved (Clinical response criteria in Table 3 and biological response criteria in Table 4). In total, 23 polymorphisms in 18 genes were assessed in more than one cohort.
Table 2.
Investigated polymorphisms in relation to anti‐TNF treatment response in Crohns Disease (CD) and ulcerative colitis (UC)
| Disease | References | # SNPs assigned | # sign SNPs | Gene (rs‐number) | |
|---|---|---|---|---|---|
| Significant SNPs | Nonsignificant SNPs | ||||
| CD | Mascheretti et al.27 | 11 | 2 |
TNFRSF1B (rs1061622) TNFRSF1B (exon 2) |
TNF (rs361525, rs1800629, rs1800750, rs1799724, rs1799964), TNFRSF1A (rs4149570, rs767455), TNFRSF1B (rs1061624, rs3397) |
| CD | Vermeire et al.38 | 3 | 0 | NOD2 (rs2066845, rs2066844, rs41450053) | |
| CD | Louis et al.28 | 1 | 0 | TNF (rs1800629) | |
| CD | Mascheretti et al.26 | 3 | 0 | NOD2 (rs2066845, rs2066844, rs41450053) | |
| CD | Louis et al.29 | 1 | 0 | FCGR3A (rs396991) | |
| CD | Pierik et al.30 | 2 | 0 | TNFRSF1A (rs767455) | TNFRSF1B (rs1061622) |
| CD | Hlavaty et al.39 | 17 | 2 |
FAS (rs763110) CASP9 (rs4645983) |
FAS (rs1800682, rs3218621, rs2234978, rs3218611), TRAIL DR4 (rs6557634, rs4871857), CASP3 (rs1049210), CASP9 (rs1052571, rs1132310, rs4646008, rs2308938, rs2020897), BAD (rs3729933), BCL2L1 (rs7362890), API4 (rs2071214) |
| CD | Willot et al.31 | 4 | 0 | CRP (rs2794521, rs1130864, rs1205) | |
| CD | Dideberg et al.32 | 6 | 0 | LTA (rs909253, rs2857713, rs5875327, rs1041981, rs746868, rs3093543) | |
| CD | Dideberg et al.33 | 12 | 0 | ADAM17 (rs2001658, rs12469362, rs883399, rs1048610, rs2276338, rs1056204, rs10929587, rs1880439, rs10495565, rs4464248, rs11684747, rs10929590) | |
| CD | Louis et al.34 | 1 | 0 | FCGR3A (rs396991) | |
| CD | Moroi et al.35 | 1 | 0 | FCGR3A (rs396991) | |
| CD | Medrano et al.36 | 4 | 2 | TNFRSF1B (rs1061624) |
TNFRSF1A (rs767455), TNFRSF1B (rs1061622, rs3397) |
| CD | Koder et al.37 | 33 | 10 |
CASP9 (rs4645983) PTGER4 (rs10512734) IL27 (rs8049439) C11orf30 (rs7927894) CCNY (rs12777960) NR12 (rs3814057) IL13 (rs1295686) ATG16L1 (rs10210302) FCGR3A (rs3969919) FAS (rs1800682) IL10 (rs3024505) TNFRSF14 (rs3748816) |
10p11.2 (rs4934697), 10q21 (rs10509115), c110rf30 (rs7927894) CTLA4 (rs3087243), DLG5 (rs1248696), ECM1 (rs13294), IL12A (rs17810546), IL12B (rs6887695), IL12RB1 (rs11575934), IL23R (rs7517847), IL4 (rs2070874), IL4R (rs1801275), NKX2‐3 (rs11190140), NOD2 (rs2066844, rs2066845, rs41450053), NR1/2 (rs3814057), ORMDL3 (rs2872507), PTPN22 (rs2476601), SEPHS1 (rs2254252), SLC22A4 (rs1050152), SLC22A5 (rs2631372), TNFSF15 (rs4263839) |
| CD | Bank et al.25 | 36 | 7 |
TLR2 (rs1816702) TLR2 (rs3804099) TLR4 (rs5030728) TLR9 (rs352139) LY96 (rs11465996) TNFRSF1A (rs4149570) IFNG (rs2430561) |
TLR2 (rs11938228, rs4696480), TLR4(rs1554973, rs12377632),TLR5 (rs5744168), TLR9 (rs187084), CD14 (rs2569190), MAP3K14 (rs7222094), SUMO4 (rs237025), NFKBIA (rs696), NFKB1 (rs28362491), TNF (rs1800629, rs361525), ;TNFAIP3 (rs6927172), IL1B (rs4848306, rs1143623, rs1143627), IL1RN (rs4251961), IL4R (rs1805010), IL6 (rs10499563), IL6R (rs4537545), IL10 (rs1800872, rs3024505), IL17A (rs2275913), IL23R (rs11209026), TGFB1 (rs1800469), PTPN22 (rs2476601), PPARG (rs1801282), NLRP3 (rs4612666) |
| UC | Bank et al.25 | 36 | 11 |
TLR2 (rs3804099) TLR2 (rs11938228) TLR2 (rs4696480) TLR4 (rs5030728) LY96 (rs11465996) CD14 (rs2569190) TNFAIP3 (rs6927172) IL1B (rs4848306) IL1RN (rs4251961) IL6 (rs10499563) IL17A (rs2275913) |
TLR2 (rs1816702), TLR4(rs1554973, rs12377632), TLR5 (rs5744168), TLR9 (rs187084, rs352139), MAP3K14 (rs7222094), SUMO4 (rs237025), NFKBIA (rs696), NFKB1 (rs28362491), TNF (rs1800629, rs361525),TNFRSF1A (rs4149570), IL1B (rs1143623, rs1143627), IL4R (rs1805010), IL6R (rs4537545), IL10 (rs1800872, rs3024505), IL23R (rs11209026), IFNG (rs2430561), TGFB1(rs1800469), PTPN22 (rs2476601), PPARG (rs1801282), NLRP3 (rs4612666) |
Table 3.
Odds ratio (OR) and 95% confidence interval (95% CI) for the association between anti‐TNF treatment clinical response and polymorphisms for polymorphisms investigated in more than one individual cohort using clinical response criteria
| Disease | Gene | rs number | OR (95% CI) | MAF | Model | Criteriaa | Response groups | Reference |
|---|---|---|---|---|---|---|---|---|
| Pathogen recognition | ||||||||
| CD | TLR2 | rs3804099 | 2.02 (1.17–3.49) | C | TC or CC vs. TT | SCTSS | R vs. N and P | Bank et al.25 |
| UC | 2.47 (0.98–6.23) | C | CC vs. TC or TT | SCTSS | R vs. N | Bank et al.25 | ||
| UC | TLR2 | rs11938228 | 0.49 (0.26–0.90) | A | CA or AA vs. CC | SCTSS | R vs. N | Bank et al.25 |
| CD | 0.74 (0.43–1.28) | A | CA or AA vs. CC | SCTSS | R vs. N | Bank et al.25 | ||
| CD | TLR2 | rs1816702 | 2.02 (1.04–3.95) | T | CT or TT vs. CC | SCTSS | R vs. N and P | Bank et al.25 |
| UC | 1.16 (0.48–2.82) | T | CT or TT vs. CC | SCTSS | R vs. N and P | Bank et al.25 | ||
| UC | TLR2 | rs4696480 | 0.29 (0.12–0.70) | T | TT vs. AA or AT | SCTSS | R vs. N and P | Bank et al.25 |
| CD | 1.31 (0.67–2.56) | T | TT vs. AA or AT | SCTSS | R vs. N and P | Bank et al.25 | ||
| CD | TLR4 | rs5030728 | 3.34 (1.32–8.47) | A | GA vs. GG | SCTSS | R vs. N | Bank et al.25 |
| UC | 2.89 (1.17–7.12) | A | AA vs. GG | SCTSS | R vs. N and P | Bank et al.25 | ||
| CD | LY96 | rs11465996 | 1.73 (1.01–2.90) | G | CG or GG vs. CC | SCTSS | R vs. N | Bank et al.25 |
| UC | 0.32 (0.14–0.75) | G | CG or GG vs. CC | SCTSS | R vs. N and P | Bank et al.25 | ||
| CD | TLR9 | rs352139 | 0.38 (0.16–0.94) | A | AA vs. GA or GG | SCTSS | R vs. N | Bank et al.25 |
| UC | 0.55 (0.16–1.84) | A | AA vs. GA or GG | SCTSS | R vs. N | Bank et al.25 | ||
| CD | NOD2 | rs2066844 | 1.77 (0.71–4.99)b | T | TT or CT vs. CC | CDAI | R and P vs. N | Vermeire et al.38 |
| CD | 0.84 (0.48–1.48)b | T | TT or CT vs. CC | CDAI | R vs. N | Mascheretti et al.26 | ||
| CD | no.a. | T | TT or CT vs. CC | IBDQ | R vs. N | Koder et al.37 | ||
| CD | NOD2 | rs2066845 | 0.55 (0.19–1.69)b | C | CC or CG vs. GG | CDAI | R and P vs. N | Vermeire et al.38 |
| CD | 1.19 (0.56–2.61)b | C | CC or CG vs. GG | CDAI | R vs. N | Mascheretti et al.26 | ||
| CD | no.a. | C | CC or CG vs. GG | IBDQ | R vs. N | Koder et al.37 | ||
| CD | NOD2 | rs41450053 | 0.57 (0.19–1.65)b | C | CC or CG vs. GG | CDAI | R and P vs. N | Vermeire et al.38 |
| CD | 1.10 (0.53–1,92)b | C | CC or CG vs. GG | CDAI | R vs. N | Mascheretti et al.26 | ||
| CD | no.a. | C | CC or CG vs. GG | IBDQ | R vs. N | Koder et al.37 | ||
| UC | CD14 | rs2569190 | 0.54 (0.30–0.98) | A | GA or AA vs. GG | SCTSS | R vs. N and P | Bank et al.25 |
| CD | 0.95 (0.60–1.52) | A | GA or AA vs. GG | SCTSS | R vs. N and P. | Bank et al.25 | ||
| Cytokines | ||||||||
| UC | TNF | rs1800629 | 1.17 (0.46–2.97) | A | GA or AA vs. GG | SCTSS | R vs. N and P | Bank et al.25 |
| CD | 1.15 (0.66–2.01) | A | GA or AA vs. GG | SCTSS | R vs. N and P | Bank et al.25 | ||
| CD | 0.60 (0.30–1.22)b | A | GA or AA vs. GG | CDAI | R vs. N | Louis et al.28 | ||
| CD | no.a. | A | GA or AA vs. GG | CDAI | R and P vs. N | Mascheretti et al.27 | ||
| CD | TNFRSF1A | rs4149570 | 2.39 (1.03–5.57) | T | TT vs. GG | SCTSS | R vs. N and P | Bank et al.25 |
| UC | 1.56 (0.41–5.88) | T | TT vs. GG | SCTSS | R vs. N and P | Bank et al.25 | ||
| CD | TNFRSF1B | rs1061622 | 0.88 (0.57–1.37)b | G | TG or GG vs. TT | CDAI | R and P vs. N | Mascheretti et al.27 |
| CD | 1.52 (0.79–3.04)1 | G | TG or GG vs. TT | HBI | R vs. N | Medrano et al.36 | ||
| UC | TNFAIP3 | rs6927172 | 0.34 (0.13–0.88) | G | CG or GG vs. CC | SCTSS | R vs. N and P | Bank et al.25 |
| CD | 1.06 (0.51–2.21) | G | CG or GG vs. CC | SCTSS | R vs. N and P | Bank et al.25 | ||
| CD | IFNG | rs2430561 | 1.97 (1.13–3.42) | A | TA or AA vs. TT | SCTSS | R vs. N and P | Bank et al.25 |
| UC | 1.21 (0.52–2.85) | A | TA or AA vs. TT | SCTSS | R vs. N and P | Bank et al.25 | ||
| UC | IL1B | rs4848306 | 2.69 (1.04–6.94) | A | GA or AA vs. GG | SCTSS | R vs. N | Bank et al.25 |
| CD | 1.55 (0.73–3.29) | A | GA or AA vs. GG | SCTSS | R vs. N | Bank et al.25 | ||
| UC | IL1RN | rs4251961 | 0.42 (0.18–0.98) | C | TC or CC vs. TT | SCTSS | R vs. N and P | Bank et al.25 |
| CD | 0.88 (0.52–1.50) | C | TC or CC vs. TT | SCTSS | R vs. N and P | Bank et al.25 | ||
| UC | IL6 | rs10499563 | 3.60 (1.39–9.29) | C | TC or CC vs. TT | SCTSS | R vs. N and P | Bank et al.25 |
| CD | 1.09 (0.64–1.84) | C | TC or CC vs. TT | SCTSS | R vs. N and P | Bank et al.25 | ||
| UC | IL10 | rs3024505 | 1.41 (0.61–3.26) | A | GA or AA vs. GG | SCTSS | R vs. N and P | Bank et al.25 |
| CD | 1.41 (0.61–1.79) | A | GA or AA vs. GG | SCTSS | R vs. N and P | Bank et al.25 | ||
| CD | no.a. | A | A vs. G | IBDQ | R vs. N | Koder et al.37 | ||
| UC | IL17A | rs2275913 | 0.42 (0.18–1.00) | A | GA or AA vs. GG | SCTSS | R vs. N and P | Bank et al.25 |
| CD | 1.42 (0.85–2.37) | A | GA or AA vs. GG | SCTSS | R vs. N and P | Bank et al.25 | ||
| Antibody‐dependent immune responses | ||||||||
| CD | FCGR3A | rs396991 | no.a | T | TT vs. TG or GG | CDAI | R and P vs. N | Louis et al.29 |
| CD | no.a | T | TT vs. TG or GG | CDAI | R vs. N | Louis et al.34 | ||
| CD | no.a | T | TT vs. TG or GG | CDAI | R vs. N | Moroi et al.35 | ||
| CD | >1 | T | TT or TG vs. GG | IBDQ | R vs. N | Koder et al.37 | ||
| Apoptosis | ||||||||
| CD | FAS | rs1800682 | 0.69 (0.34–1.42)b | T | CC or CT vs. TT | CDAI | R vs. N | Hlavaty et al. |
| CD | >1 | T | TT vs. CC or CT | IBDQ | R vs. N | Koder et al.37 | ||
| CD | >1 | T | T vs. C | ΔIBDQ | R vs. N | Koder et al.37 | ||
| CD | CASP9 | rs4645983 | 1.50 (1.34–1.68)b | T | TT vs. CC or CT | CDAI | R vs. N | Hlavaty et al.39 |
| CD | >1 | T | CT or TT vs. CC | IBDQ | R vs. N | Koder et al.37 | ||
| CD | >1 | T | CT or TT vs. CC | ΔCRP | R vs. N | Koder et al.37 | ||
| CD | >1 | T | T vs. C | IBDQ | R vs. N | Koder et al.37 | ||
no.a., No association; R, Responder; N, nonresponder; P, partial responder; IBDQ, IBD questionnaire; SCTSS, Simple Clinical Three Step Scale; HBI, Harvey–Bradshaw index; CDAI, Crohn's disease activity index; CRP, C‐reactive protein; MAF, minimal allele frequency.
For response criteria please refer to Table 1.
OR and CI calculated from the data obtained from the article.
Table 4.
Odds ratio (OR) and 95% confidence interval (95% CI) for the association between anti‐TNF treatment biological response and polymorphisms for polymorphisms investigated in more than one individual cohort using biological response criteria
| Disease | Gene | rs number | OR (95% CI) | MAF | Model | Criteriaa | Response groups | Reference |
|---|---|---|---|---|---|---|---|---|
| Antibody‐dependent immune responses | ||||||||
| CD | FCGR3A | rs396991 | 1.43 (1.27–1.61)a | T | TT vs. TG or GG | ΔCRP | R and P vs. N | Louis et al.29 |
| CD | >1 | T | TT vs. TG or GG | ΔCRP | R vs. N | Louis et al.34 | ||
| CD | >1 | T | TT vs. TG or GG | ΔCRP | R vs. N | Moroi et al.35 | ||
no.a., No association; R, Responder; N, nonresponder; P, partial responder; IBDQ, IBD questionaire; CRP, C‐reactive protein; MAF, minimal allele frequency.
For response criteria please refer to Table 1.
The FCGR3A rs396991 polymorphism has been most intensely investigated29, 34, 35, 37 (Tables 3 and 4). This polymorphism has been evaluated both in relation to clinical and biological response criteria.29, 34, 35, 37 First, Louis et al. studied biological response rate from anti‐TNF treatment among 145 patients for whom the CRP level prior to treatment were elevated compare to standard levels.29 Complete biological response was defined as a normalisation of CRP levels and partial response as a decrease of at least 25% from the basal level. A complete or partial biological response was observed in 100% of 29 TT carriers compared to 70% of 71 GG or TG carriers (P = 0.0002). In contrast, no significantly different response rates between the genotypes were found when using clinical response criteria.29 Similarly, results were reported from the ACCENT study.34 Again, no differences were found in relation to clinical criteria. However, analyses of the subgroup with baseline CRP values within the two highest quartiles (N = 156) showed a trend towards a greater relative change in CRP in the TT carriers [the median decrease of CRP were 80, 77 and 64% among TT, TG and GG genotype carriers (P = 0.085) after 6 weeks, respectively]. The authors also observed the same trend at week 2.34 Similar results were found in another study by Moroi et al., who found a significantly larger decrease of CRP (ΔCRP) and percentage decrease (ΔCRP%) among 12 TT genotype carriers than among 38 TG and 52 GG genotype carriers (P = 0.001 and P = 0.044, respectively) at week 8 whereas no differences were found at week 30 and no differences were found in relation to the clinical response criteria.35 FCGR3A encodes a receptor for immunoglobulin G (IgG), FcγRIIIa. Moroi et al. moreover conducted an in vitro experiment, assessing the binding affinity of infliximab to natural killer (NK) cells and the infliximab‐mediated antibody‐dependent cell‐mediated cytotoxicity of peripheral blood mononuclear cells (PMBC) from six healthy volunteers of each genotype.35 The authors reported that NK cells from FCGR3A rs396991 TT donors had significantly higher binding affinity to infliximab compared to donors with the GG genotype (P < 0.05). In addition PMBCs from FCGR3A rs396991 TT donors induced significantly higher infliximab‐mediated antibody‐dependent cell‐mediated cytotoxicity, than cells from the GG donors (P < 0.05).35 Subsequently, Koder et al. reported no significant association between anti‐TNF response and either clinical or biological response.37 Clinical response was based on an IBDQ and defined as an IBDQ value higher than 170 points or an increase in IBDQ of more than 22 points (ΔIBDQ >22).40
Figures 2 and S1 show the results of the meta‐analyses including the retrievable data for all polymorphisms studied in at least two studies. In total, eight polymorphisms in seven genes were found to be significantly associated with treatment response (Figure 2). All eight polymorphisms were identified in one study including both a CD and an UC cohort.25 The genes were TLR2, TLR4, TLR9, TNFRSF1A, IFNG, IL6 and IL1B. Furthermore, nine polymorphisms in eight genes (TLR2, CD14, LY96, TNF, TNFRSF1B, TNFAIP3, IL1RN and IL17A) were not associated with treatment result (Figure S1). In addition, three polymorphisms in NOD2 and a marker polymorphism near IL10 were not associated with treatment response in more than one individual study (Table 3).
Figure 2.

Forest plot of significant associations between polymorphisms and treatment response including polymorphisms with available data. Data from Bank et al.25
The predictive potential of five polymorphisms was estimated based on original data supplied by Bank et al.25 (Figure 3 and Table 5). We first used logistic regression to identify five genotypes (2 in TLR2, 2 in IL12B, and 1 in IL6) that were significantly associated with an increased risk of anti‐TNF nonresponse. As simple binary predictors they were only modestly associated with nonresponse (OR < 2, results not shown). These five genotypes were then combined into a sum score. The overall nonresponse rate was 23.4% for the UC cases. OR of nonresponse dependent on the sum score of the five selected genotypes is shown in Figure 3. Patients who were carriers of all five genotypes had an OR of 25 (95% CI: 1.93–323.55) for nonresponse (Figure 3). Positive and negative predictive values for the sum scores are shown in Table 5. No variations or combination of variations could produce negative predictive values above 0.5 (ranging from 0.0 to 0.5). The positive predictive values, however, were very high for some genetic profiles. In particular, the group of 26 patients (corresponding to 11% of the UC patients) without any of the five low‐response associated genotypes had a positive predictive value of 0.96.
Figure 3.
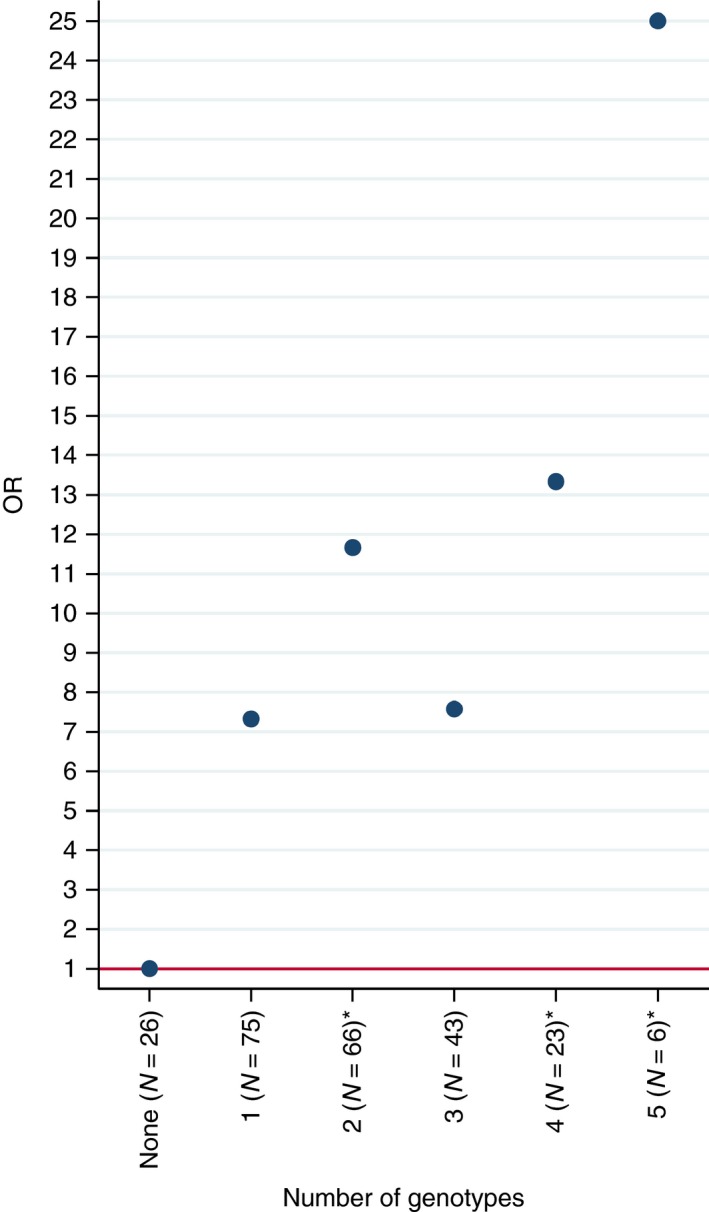
OR for the presence of one or more of five selected genotypes for predicting anti‐TNF nonresponse. Data from Bank et al.25 Genotypes: TLR2 rs4696480TT,TLR2 rs11938228AC,IL6 rs10499563TT,IL12B rs3212227AC and IL12B rs3212217CG. Present = 1, absent = 0. Sum score is shown. CIs are omitted due to frequent extreme ranges. *P < 0.05, **P < 0.01.
Table 5.
Odds ratios (OR), 95% confidence intervals (95% CI), positive (PPV) and negative predictive values (NPV) for sum scores of 5 selected genotypes
| Full or partial response (N = 179) | Nonresponse (N = 60) | OR | 95% CI | PPV | NPV | |
|---|---|---|---|---|---|---|
| Number of variants | ||||||
| None (N = 26) | 25 | 1 | 1 (ref) | 0.96 | 0.04 | |
| 1 (N = 82) | 58 | 17 | 7.33 | 0.92–58.10 | 0.77 | 0.23 |
| 2 (N = 68) | 45 | 21 | 11.67a | 1.48–91.98 | 0.68 | 0.32 |
| 3 (N = 45) | 33 | 10 | 7.58 | 0.91–63.13 | 0.77 | 0.23 |
| 4 (N = 23) | 15 | 8 | 13.33a | 1.51–117.38 | 0.65 | 0.35 |
| 5 (N = 6) | 3 | 3 | 25.00a | 1.93–323.55 | 0.50 | 0.50 |
Data from Bank et al.25
Genotypes: TLR2 rs4696480TT, TLR2 rs11938228AC, IL6 rs10499563TT, IL12B rs3212227AC, and IL12B rs3212217CG.
P < 0.05.
Discussion
In this review, we wanted to identify genetic polymorphisms associated with treatment outcome from anti‐TNF treatment in IBD patients in order to suggest potential biomarker candidates for further evaluation of predictive potential. Replication of genetic associations that are not genome‐wide significant (combined P < 5 × 10⁻⁸) in the initial screening, is of major importance to provide robust statistical evidence. Accordingly we included all polymorphisms, which were studied in at least two studies and where data on genotype and treatment response could be retrieved, in meta‐analyses. Our meta‐analysis which included both CD and UC and which was based on clinical response criteria showed that polymorphisms in TLR2, TLR4, TLR9, TNFRSF1A, IFNG, IL6 and IL1B were associated with treatment response.
Additionally, using biological response criteria, we found a polymorphism in FCGR3A, which was associated with anti‐TNF treatment response in CD patients, and for which a functional effect was indicated.35
Furthermore, to explore the potential use of genetic markers for predicting treatment response, we calculated predictive values in UC using the dataset from one of the included studies.25 We calculated positive and negative prediction values for sum scores of five selected genotypes in IL12B, IL6 and TLR2. High positive predictive values could be achieved for some patient groups, including a positive predictive value of 0.96 for UC patients without any of the five selected genotypes. Although these exploratory results give hope for the potential of genetics for treatment selection, they need validation and confirmation in larger cohorts before taken into clinical practice.
An explorative approach was used when identifying potential candidate biomarkers in order not to overlook potential candidates. Response criteria varied between the reviewed studies and more than one criterion were often used in the individual studies. For example, FCGR3A was identified as a potential biomarker using CRP levels (defined as biological response), whereas the same studies found no significant associations using clinical response criteria.29, 34, 35 IBD comprises a heterogeneous group of subtypes with different molecular characteristic41 and characterised by variable disease activity and this may challenge the identification of biomarkers. Therefore, using clearly defined biological response criteria such as e.g. CRP or, maybe even better, f‐calprotectin, in a subgroup of patients may thus be a successful strategy to identify candidate biomarkers. Clinical response rate has been found to be higher in patients with elevated CRP levels than those with normal CRP values.29
Generally, interpretation of genetic information in a meaningful way may be difficult. The use of functional polymorphisms, i.e. polymorphisms that cause, or are linked to polymorphisms that change enzyme activity of the encoded protein, is a means to help understanding the underlying biological mechanisms. FCGR3A encodes a receptor for immunoglobulin G (IgG), FcγRIIIa. Moroi et al.35 suggested that the high response rate observed among the TT genotype carriers was caused by high binding of infliximab to FcγRIIIa on the NK cells leading to high antibody‐dependent cell‐mediated cytotoxicity. The results from this review therefore suggest that FCGR3A, which is involved in the antibody‐dependent immune response, is important for anti‐TNF treatment response in IBD. In contrast, a meta‐analysis found no associations between the FCGR3A rs396991 polymorphism and the anti‐TNF response among patients with rheumatoid arthritis,42 indicating discrepancies in the potential of this polymorphism to predict the response to anti‐TNF treatment in patients with chronic inflammatory diseases. Potentially, the FCGR3A rs396991 polymorphism may define a subset of patients with chronic inflammatory diseases who may benefit from anti‐TNF treatment.
Our meta‐analyses included all polymorphisms that were investigated in more than one cohort. However, all included polymorphisms derived from only one study25 that studied the same polymorphisms in both CD and UC. Therefore, the generality of the meta‐analyses can be questioned. The results suggest that genes involved in the innate immune response such as recognition of bacterial components (TLR2, TLR4, TLR9) and cytokine pathways (TNFRSF1A, IFNG, IL6 and IL1B) are important for anti‐TNF treatment response. These factors are of most importance for keeping the balance between intestinal homeostasis and inflammation.4 Thus, this meta‐analysis suggests that host–microbial interaction play a role in IBD treatment response. In line with this notion, the dysbiosis in the gut microbiota in patients with rheumatoid arthritis patients was found to partly resolve after medical treatment.43
Current knowledge on the mechanisms involved in anti‐TNF treatment of IBD was recently reviewed.9 Identification of genetic variants that are associated with a biological process is a method for identification of the involved genes.19, 20, 44, 45 Here, we propose a method to evaluate the involvement of supposed underlying biological mechanisms. Thereby, important mechanisms involved in treatment outcome in IBD patients in clinical practice may be identified. Furthermore, negative findings may suggest that the studied genes are not of major importance in treatment response provided that the studied polymorphisms are functional in the target tissues and that studies had sufficient statistical power.
However, environmental factors such as nutrition, life style, and other medication may impact intestinal immunity and may also interact with genetic susceptibility. These factors may not have been captured in the included studies. Thus, potential predictive biomarkers may not have been identified in the present review due to e.g. interactions with environmental factors, which differ between populations, as well as genetic heterogeneity. Likewise, potential statistical errors in the analysed studies may affect the results of this review. This review did not have power to perform separate analyses for various anti‐TNF drugs, such as Infliximab and Adalimumab. Candidate gene studies are based on biological hypotheses as they rely on the evaluation of polymorphisms selected in pathways thought to be involved in treatment response. Therefore, we did not correct for multiple comparisons. Instead, in genetic studies, replication of findings in other cohorts is considered as a critical criterion. We found 18 genes that were investigated in more than one cohort whereof 11 genes were only investigated in Danish IBD patients. Remarkable, all the identified candidates in the meta‐analyses were from the Danish study. This group of patients may have been genetic homogeneous and characterised by similar lifestyle factors which may have contributed to the results.
Another important issue is the analysis of the combined effects of various networks, including gene‐gene interactions. In addition, new biologics directed against inflammatory pathways involved in IBD4 such as interleukin (IL)‐6, IL‐12/23, α4‐integrins, IL‐17, interferon‐γ are currently under implementation or development. There is some support of the notion that inflammation may be driven by genetically high activity of IL‐1β, interferon‐γ and/or IL‐6 in anti‐TNF nonresponders.25 The new biologics may therefore potentially be effective in subgroups of patients with certain genetic constitutions, for example, biologics directed against IL‐17 or interferon‐γ may be more effective in patients with an immune response mediated by genetically determined high IL‐17 or interferon‐γ immune responses. The evaluation of these questions requires testing a large number of polymorphisms in large cohorts of well‐characterised patients and may be performed by large international working groups such as the International IBD Genetics Consortium.41, 46, 47 Future strategies may combine genetic markers indicating which pathways and cytokines are deregulated and potentially affected drug degradation pathways together with information on e.g. clinical, serological, and microbial profiles in each case for the selection of the best treatment for each patient. New ways of analysing the large amount of genetic data, integrating these with other information and moreover, translating the results into clinical practice will be necessary for achieving these goals.
In conclusion, only few and weak biomarker candidates were identified for further evaluation of their treatment prediction potential. Thus, the basis for personalised medicine, i.e. the ability to stratify the patients according to the expected response to anti‐TNF treatment, is not yet available. Genetic biomarkers have the advantage that they do not change over time. Therefore, hypothesises‐free approaches testing a large number of polymorphisms in large well‐characterised cohorts are warranted in order to identify biomarkers which can be used for treatment selection in the clinical setting.
Authorship
Guarantor of the article: Vibeke Andersen is acting as the submission's guarantor (ie the person who takes responsibility for the integrity of the work as a whole, from inception to published article.)
Author contributions: SB, JVN and VA collected the data, SB, UV, AF and VA designed the research study and SB and VA analysed the data and wrote the first draft. ABB performed the statistical analyses. StBa contributed data. We state that all authors approved the final version of the manuscript.
Supporting information
Table S1. Search strategy with full list of search terms.
Figure S1. Forest plot of nonsignificant associations between polymorphisms and anti‐TNF treatment response.
Acknowledgement
Librarian Tove Faber, University of Southern Denmark, is thanked for help with the search strategy. Staff at the Libraries of Regional Hospital Viborg and Hospital of Southern Jutland, are thanked for their help.
Declaration of personal interests: Signe Bek, Jakob Vennike Nielsen, Andre Franke, Steffen Bank, Anders Bo Bojesen and Ulla Vogel declare no conflicts of interest. Vibeke Andersen receives compensation as a consultant for MSD and Janssen.
Declaration of funding interests: None.
The Handling Editor for this article was Professor Jonathan Rhodes, and it was accepted for publication after full peer‐review.
References
- 1. Khor B, Gardet A, Xavier RJ. Genetics and pathogenesis of inflammatory bowel disease. Nature 2011; 474: 307–17. [DOI] [PMC free article] [PubMed] [Google Scholar]
- 2. Molodecky NA, Soon IS, Rabi DM, et al Increasing incidence and prevalence of the inflammatory bowel diseases with time, based on systematic review. Gastroenterology 2012; 142: 46–54. [DOI] [PubMed] [Google Scholar]
- 3. Strober W, Fuss I, Mannon P. The fundamental basis of inflammatory bowel disease. J Clin Investig 2007; 117: 514–21. [DOI] [PMC free article] [PubMed] [Google Scholar]
- 4. Maloy KJ, Powrie F. Intestinal homeostasis and its breakdown in inflammatory bowel disease. Nature 2011; 474: 298–306. [DOI] [PubMed] [Google Scholar]
- 5. Cader MZ, Kaser A. Recent advances in inflammatory bowel disease: mucosal immune cells in intestinal inflammation. Gut 2013; 62: 1653–64. [DOI] [PubMed] [Google Scholar]
- 6. MacDonald TT, Monteleone I, Fantini MC, Monteleone G. Regulation of homeostasis and inflammation in the intestine. Gastroenterology 2011; 140: 1768–75. [DOI] [PubMed] [Google Scholar]
- 7. Abraham C, Medzhitov R. Interactions between the host innate immune system and microbes in inflammatory bowel disease. Gastroenterology 2011; 140: 1729–37. [DOI] [PMC free article] [PubMed] [Google Scholar]
- 8. Nielsen OH, Ainsworth MA. Tumor necrosis factor inhibitors for inflammatory bowel disease. N Engl J Med 2013; 369: 754–62. [DOI] [PubMed] [Google Scholar]
- 9. Pedersen J, Coskun M, Soendergaard C, Salem M, Nielsen OH. Inflammatory pathways of importance for management of inflammatory bowel disease. World J Gastroenterol 2014; 20: 64–77. [DOI] [PMC free article] [PubMed] [Google Scholar]
- 10. Dignass A, van Assche G, Lindsay JO, et al The second European evidence‐based Consensus on the diagnosis and management of Crohn's disease: current management. J Crohns Colitis 2010; 4: 28–62. [DOI] [PubMed] [Google Scholar]
- 11. Dignass A, Lindsay JO, Sturm A, et al Second European evidence‐based consensus on the diagnosis and management of ulcerative colitis part 2: current management. J Crohns Colitis 2012; 6: 991–1030. [DOI] [PubMed] [Google Scholar]
- 12. Mastrandrea LD. An overview of organ‐specific autoimmune diseases including immunotherapy. Immunol Invest 2015; 44: 803–16. [DOI] [PubMed] [Google Scholar]
- 13. http://permed2020.eu/. http://permed2020.eu/ 2015.
- 14. Gerich ME, McGovern DP. Towards personalized care in IBD. Nat Rev Gastroenterol Hepatol 2014; 11: 287–99. [DOI] [PubMed] [Google Scholar]
- 15. Siegel CA, Melmed GY. Predicting response to Anti‐TNF Agents for the treatment of crohn's disease. Therap Adv Gastroenterol 2009; 2: 245–51. [DOI] [PMC free article] [PubMed] [Google Scholar]
- 16. Siegel CA, Horton H, Siegel LS, et al A validated web‐based tool to display individualised Crohn's disease predicted outcomes based on clinical, serologic and genetic variables. Aliment Pharmacol Ther 2016; 43: 262–71. [DOI] [PubMed] [Google Scholar]
- 17. Ding NS, Hart A, de Cruz P. Systematic review: predicting and optimising response to anti‐TNF therapy in Crohn's disease – algorithm for practical management. Aliment Pharmacol Ther 2016; 43: 30–51. [DOI] [PubMed] [Google Scholar]
- 18. Danese S, Colombel JF, Peyrin‐Biroulet L, Rutgeerts P, Reinisch W. Review article: the role of anti‐TNF in the management of ulcerative colitis – past, present and future. Aliment Pharmacol Ther 2013; 37: 855–66. [DOI] [PubMed] [Google Scholar]
- 19. Andersen V, Holst R, Vogel U. Systematic review: diet‐gene interactions and the risk of colorectal cancer. Aliment Pharmacol Ther 2013; 37: 383–91. [DOI] [PMC free article] [PubMed] [Google Scholar]
- 20. Andersen V, Vogel U. Systematic review: interactions between aspirin, and other nonsteroidal anti‐inflammatory drugs, and polymorphisms in relation to colorectal cancer. Aliment Pharmacol Ther 2014; 40: 147–59. [DOI] [PMC free article] [PubMed] [Google Scholar]
- 21. Link E, Parish S, Armitage J, et al SLCO1B1 variants and statin‐induced myopathy – a genomewide study. N Engl J Med 2008; 359: 789–99. [DOI] [PubMed] [Google Scholar]
- 22. Tanaka Y, Nishida N, Sugiyama M, et al Genome‐wide association of IL28B with response to pegylated interferon‐alpha and ribavirin therapy for chronic hepatitis C. Nat Genet 2009; 41: 1105–9. [DOI] [PubMed] [Google Scholar]
- 23. Moher D, Liberati A, Tetzlaff J, Altman DG. Preferred reporting items for systematic reviews and meta‐analyses: the PRISMA statement. PLoS.Med 2009; 6: e1000097. [DOI] [PMC free article] [PubMed] [Google Scholar]
- 24. Mantel N, Haenszel W. Statistical aspects of the analysis of data from retrospective studies of disease. J Natl Cancer Inst 1959; 22: 719–48. [PubMed] [Google Scholar]
- 25. Bank S, Andersen PS, Burisch J, et al Associations between functional polymorphisms in the NFkappaB signaling pathway and response to anti‐TNF treatment in Danish patients with inflammatory bowel disease. Pharmacogenomics J 2014; 14: 526–34. [DOI] [PubMed] [Google Scholar]
- 26. Mascheretti S, Hampe J, Croucher PJ, et al Response to infliximab treatment in Crohn's disease is not associated with mutations in the CARD15 (NOD2) gene: an analysis in 534 patients from two multicenter, prospective GCP‐level trials. Pharmacogenetics 2002; 12: 509–15. [DOI] [PubMed] [Google Scholar]
- 27. Mascheretti S, Hampe J, Kuhbacher T, et al Pharmacogenetic investigation of the TNF/TNF‐receptor system in patients with chronic active Crohn's disease treated with infliximab. Pharmacogenomics J 2002; 2: 127–36. [DOI] [PubMed] [Google Scholar]
- 28. Louis E, Vermeire S, Rutgeerts P, et al A positive response to infliximab in Crohn disease: association with a higher systemic inflammation before treatment but not with ‐308 TNF gene polymorphism. Scand J Gastroenterol 2002; 37: 818–24. [PubMed] [Google Scholar]
- 29. Louis E, El Ghoul Z, Vermeire S, et al Association between polymorphism in IgG Fc receptor IIIa coding gene and biological response to infliximab in Crohn's disease. Aliment Pharmacol Ther 2004; 19: 511–9. [DOI] [PubMed] [Google Scholar]
- 30. Pierik M, Vermeire S, Steen KV, et al Tumour necrosis factor‐alpha receptor 1 and 2 polymorphisms in inflammatory bowel disease and their association with response to infliximab. Aliment Pharmacol Ther 2004; 20: 303–10. [DOI] [PubMed] [Google Scholar]
- 31. Willot S, Vermeire S, Ohresser M, et al No association between C‐reactive protein gene polymorphisms and decrease of C‐reactive protein serum concentration after infliximab treatment in Crohn's disease. Pharmacogenet Genomics 2006; 16: 37–42. [DOI] [PubMed] [Google Scholar]
- 32. Dideberg V, Louis E, Farnir F, et al Lymphotoxin alpha gene in Crohn's disease patients: absence of implication in the response to infliximab in a large cohort study. Pharmacogenet Genomics 2006; 16: 369–73. [DOI] [PubMed] [Google Scholar]
- 33. Dideberg V, Theatre E, Farnir F, et al The TNF/ADAM 17 system: implication of an ADAM 17 haplotype in the clinical response to infliximab in Crohn's disease. Pharmacogenet Genomics 2006; 16: 727–34. [DOI] [PubMed] [Google Scholar]
- 34. Louis EJ, Watier HE, Schreiber S, et al Polymorphism in IgG Fc receptor gene FCGR3A and response to infliximab in Crohn's disease: a subanalysis of the ACCENT I study. Pharmacogenet Genomics 2006; 16: 911–4. [DOI] [PubMed] [Google Scholar]
- 35. Moroi R, Endo K, Kinouchi Y, et al FCGR3A‐158 polymorphism influences the biological response to infliximab in Crohn's disease through affecting the ADCC activity. Immunogenetics 2013; 65: 265–71. [DOI] [PubMed] [Google Scholar]
- 36. Medrano LM, Taxonera C, Marquez A, et al Role of TNFRSF1B polymorphisms in the response of Crohn's disease patients to infliximab. Hum Immunol 2014; 75: 71–5. [DOI] [PubMed] [Google Scholar]
- 37. Koder S, Repnik K, Ferkolj I, et al Genetic polymorphism in ATG16L1 gene influences the response to adalimumab in Crohn's disease patients. Pharmacogenomics 2015; 16: 191–204. [DOI] [PubMed] [Google Scholar]
- 38. Vermeire S, Louis E, Rutgeerts P, et al NOD2/CARD15 does not influence response to infliximab in Crohn's disease. Gastroenterology 2002; 123: 106–11. [DOI] [PubMed] [Google Scholar]
- 39. Hlavaty T, Pierik M, Henckaerts L, et al Polymorphisms in apoptosis genes predict response to infliximab therapy in luminal and fistulizing Crohn's disease. Aliment Pharmacol Ther 2005; 22: 613–26. [DOI] [PubMed] [Google Scholar]
- 40. Hlavaty T, Persoons P, Vermeire S, et al Evaluation of short‐term responsiveness and cutoff values of inflammatory bowel disease questionnaire in Crohn's disease. Inflamm Bowel Dis 2006; 12: 199–204. [DOI] [PubMed] [Google Scholar]
- 41. Cleynen I, Boucher G, Jostins L, et al Inherited determinants of Crohn's disease and ulcerative colitis phenotypes: a genetic association study. Lancet 2016; 387: 156–67. [DOI] [PMC free article] [PubMed] [Google Scholar]
- 42. Lee YH, Bae SC, Song GG. Functional FCGR3A 158 V/F and IL‐6 ‐174 C/G polymorphisms predict response to biologic therapy in patients with rheumatoid arthritis: a meta‐analysis. Rheumatol Int 2014; 34: 1409–15. [DOI] [PubMed] [Google Scholar]
- 43. Zhang X, Zhang D, Jia H, et al The oral and gut microbiomes are perturbed in rheumatoid arthritis and partly normalized after treatment. Nat Med 2015; 21: 895–905. [DOI] [PubMed] [Google Scholar]
- 44. Andersen V, Vogel U. Interactions between meat intake and genetic variation in relation to colorectal cancer. Genes Nutr 2015; 10: 448. [DOI] [PMC free article] [PubMed] [Google Scholar]
- 45. Andersen V, Ernst A, Christensen J, et al The polymorphism rs3024505 proximal to IL‐10 is associated with risk of ulcerative colitis and Crohns disease in a Danish case‐control study. BMC Med Genet 2010; 11: 82. [DOI] [PMC free article] [PubMed] [Google Scholar]
- 46. Jostins L, Ripke S, Weersma RK, et al Host‐microbe interactions have shaped the genetic architecture of inflammatory bowel disease. Nature 2012; 491: 119–24. [DOI] [PMC free article] [PubMed] [Google Scholar]
- 47. Goyette P, Boucher G, Mallon D, et al High‐density mapping of the MHC identifies a shared role for HLA‐DRB1*01:03 in inflammatory bowel diseases and heterozygous advantage in ulcerative colitis. Nat Genet 2015; 47: 172–9. [DOI] [PMC free article] [PubMed] [Google Scholar]
Associated Data
This section collects any data citations, data availability statements, or supplementary materials included in this article.
Supplementary Materials
Table S1. Search strategy with full list of search terms.
Figure S1. Forest plot of nonsignificant associations between polymorphisms and anti‐TNF treatment response.