Abstract
Purpose
Sebum may contribute to the composition of the tear film lipid layer naturally or as a contaminant artifact from collection. The aims of this study were to determine: if sebum changes the rheology of meibum surface films; if the resonance near 5.2 ppm in the 1H-NMR spectra of sebum is due to squalene (SQ); and if sebum or SQ, a major component of sebum, interacts with human meibum.
Methods
Human meibum was collected from the lid margin with a platinum spatula. Human sebum was collected using lipid absorbent tape. Langmuir trough technology was used to measure the rheology of surface films. Infrared spectroscopy was used to measure lipid conformation and phase transitions. We used 1H-NMR to measure composition and confirm the primary structure of SQ.
Results
The NMR resonance near 5.2 ppm in the spectra of human sebum was from SQ which composed 28 mole percent of sebum. Both sebum and SQ lowered the lipid order of meibum. Sebum expanded meibum films at lower concentrations and condensed meibum films at higher concentrations. Sebum caused meibum to be more stable at higher pressures (greater maximum surface pressure).
Conclusions
Physiological levels of sebum would be expected to expand or fluidize meibum making it spread better and be more surface active (qualities beneficial for tear film stability). Sebum would also be expected to stabilize the tear film lipid layer, which may allow it to withstand the high shear pressure of a blink.
Keywords: FTIR, langmuir trough, meibum, NMR, sebum, squalene, tear film
A thin film of lipids, called the tear film lipid layer (TFLL), covers the surface of the tear film. Although it forms only 0.3% of the thickness of the tear film,1–3 it is required for the spread and stabilization of the tear film.3,4–10
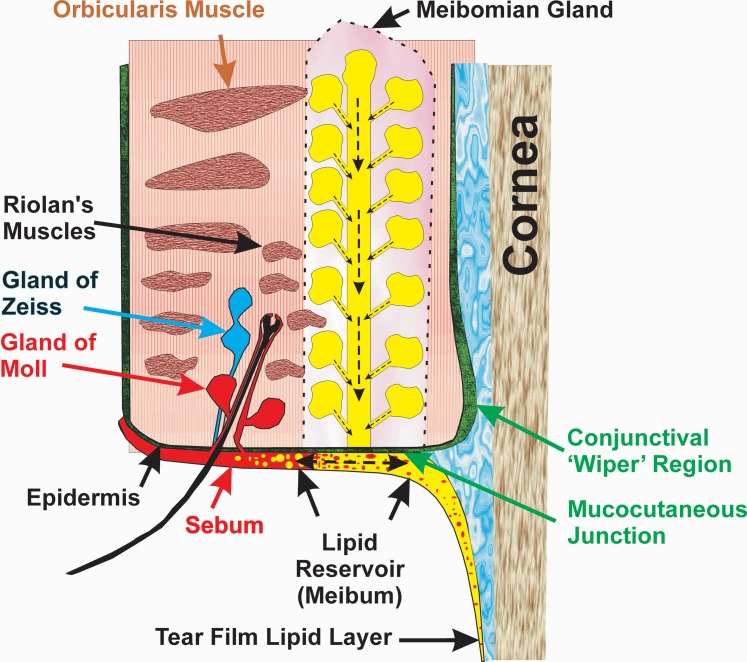
The source and lipid composition of the TFLL has been widely debated.11 Blinking restores the TFLL. When one blinks, 80% of the time the upper lid comes in contact with the stationary lower lid.12 While blinking, the muscular action of the orbicularis muscle and Riolan's muscles cause meibum to be released from the meibomian gland onto the surface of the posterior lid margin (Fig. 1). This “puddle of lipid” has been called the “lid margin reservoir.”8,13–15 Even with meibomian gland dysfunction, there is 17 to 53 times more lipid in this reservoir than found in the TFLL.16,17 The upward movement of the upper eyelid during blinking moves lipid “onto the tear meniscus and is pulled as a thin layer onto the preocular tear film…,”8,15,18–23 the tear film becomes thicker,24 and the amount of lipid on the lid margin increases.13 Lipophilic substances from the lower eyelid surface are able to reach the inferior tear meniscus supracutaneously and mix with the tear film lipid layer.25–27
Figure 1.
Cross-section through the eyelid adapted from Knop et al.8 Sebum (red) is shown mixing with meibum (yellow), which forms a continuous film over the ocular surface and eyelid.
There are only a few studies that mention tears and sebum together. Nicolaides28 coined the term “meibum” to differentiate it from “sebum.” A very early study suggested that sebum could destabilize rabbit tears.29 Sebum is produced from the glands of Zeis and Moll that are very near the meibomian glands (Fig. 1). As there is no physical boundary between meibum and sebum some mixing could occur.8,26,30 Lipids can migrate as much as 1.20 mm/hour in ordered (solid) membranes.31 One can envision that at night when meibum is not expressed or when the meibomian glands are blocked as in meibomian gland dysfunction, sebum could mix with meibum (Fig. 1). This could be especially relevant for young adults at an age when sebaceous gland activity reaches a maximum32 and meibum production is low.13 Further indirect evidence for the mixing of sebum and meibum comes from the observation that squalene (SQ) is found in the reservoir of lipids on the eyelid (6%) and in tears (8%).4,33 The concentration of SQ in sebum is 28%,34–36 but meibum contains no28 or very little (2%) SQ.37–41 In addition to a higher level of SQ in sebum compared to meibum, sebum contains much more free cholesterol (10%–20%)42,43 compared with meibum (0%–1%)4 and more glycerides (25%–50%)36,42,43 than meibum (1%–1.5%).36,44,45 As would be expected, if sebum and meibum mixed, tears were found to contain more free cholesterol (6%–15%)46,47 and more free glycerides (2.5%)45 compared with meibum, further supporting the idea that meibum and sebum mix and contribute to the TFLL.
In recent studies with heteronuclear single quantum correlation (HSQC) technique,38 we found that the level of SQ on the eyelid is 4 mole percent and in meibum it is 1%. The lower content of SQ in meibum, compared with the one in eyelid surface lipid and in whole tears,3,38 indicates that SQ on the ocular surface may come from nonmeibomian “exogenous” sources such as sebum from the glands of Zeiss and Moll, either naturally or as a contaminant artifact from meibum collection (Fig. 1). Therefore, due to the likelihood of variable amounts of sebum mixing with meibum and hence sebum being incorporated into the lipid layer of the tear film, it is of interest to determine if sebum alters the composition and biophysical properties of meibum.
In the earlier 1H NMR studies of sebum and meibum, resonances near 5.2 ppm were tentatively assigned to CH protons from terpenoids such as SQ.36–38,48–54 The precise quantification of a particular molecular compound (e.g., SQ), in a complex multicomponent natural mixture requires high resolution techniques. Thus, a goal of our study was to unambiguously confirm or correct the assignment of the NMR resonance at 5.2 ppm in the NMR spectrum of human sebum using HSQC for the first time to analyze skin sebum, which is one of the possible sources of SQ in tears. The HSQC technique involves the transfer of magnetization from the proton to the heteronucleus (carbon 13) and then back to proton, the more sensitive nucleus. The technique can discern between CH3 and CH moieties and CH2 moieties. There are numerous advantages to these experiments over the traditional heteronuclear correlation spectroscopy experiment, including increased sensitivity. Indeed an 8-fold increase in the signal-to-noise ratio compared with standard techniques is achieved.55 This is a result of the direct detection of 1H nuclei and indirect detection of heteroatoms such as 13C or 15N.55
The major aims of this study were to determine: if sebum changes the rheology of meibum surface films; if the resonance near 5.2 ppm in the 1H NMR spectra of sebum is due to SQ; and if sebum or SQ, a major component of sebum, interacts with human meibum.
One might expect that tears would contain more sebaceous lipids with the occlusion of meibomian glands with meibomian gland dysfunction, or in the morning after the meibomian glands were not expressed. As no one has carefully studied meibum-sebum interactions, we studied the interactions in a bulk solid state as on the surface of the eyelid and the rheology on an aqueous surface as on the tear film surface.
Materials and Methods
Materials
Silver chloride windows for infrared spectroscopy were obtained from Crystran Ltd. (Poole, UK). We obtained CDCl3, SQ, tetramethylsilane (TMS), and reagents from Sigma-Aldrich Corp. (St. Louis, MO, USA).
Collection and Processing of Human Meibum
Written, informed consent was obtained from all donors. Protocols and procedures were reviewed by the University of Louisville Institutional Review Board. All procedures were in accordance with the tenets of the Declaration of Helsinki. Meibomian glands were expressed by compressing the eyelid between cotton-tipped applicators with strict attention to avoid touching the eyelid margin during expression. All four eyelids were expressed, and approximately 0.5 mg meibum (ML) was collected per individual for direct spectroscopic study. The ML was collected with a platinum spatula and dissolved in a vial of chloroform.
Clinical Assessment
The subjects for NMR spectroscopic analysis were recruited from the Kentucky Lion's Eye Center (Louisville, KY, USA). Normal status was assigned when the subject's meibomian gland orifices showed no evidence of keratinization or plugging with turbid or thickened secretions, and no dilated blood vessels were observed on the eyelid margin.
Collection of Sebum for NMR and Langmuir Studies
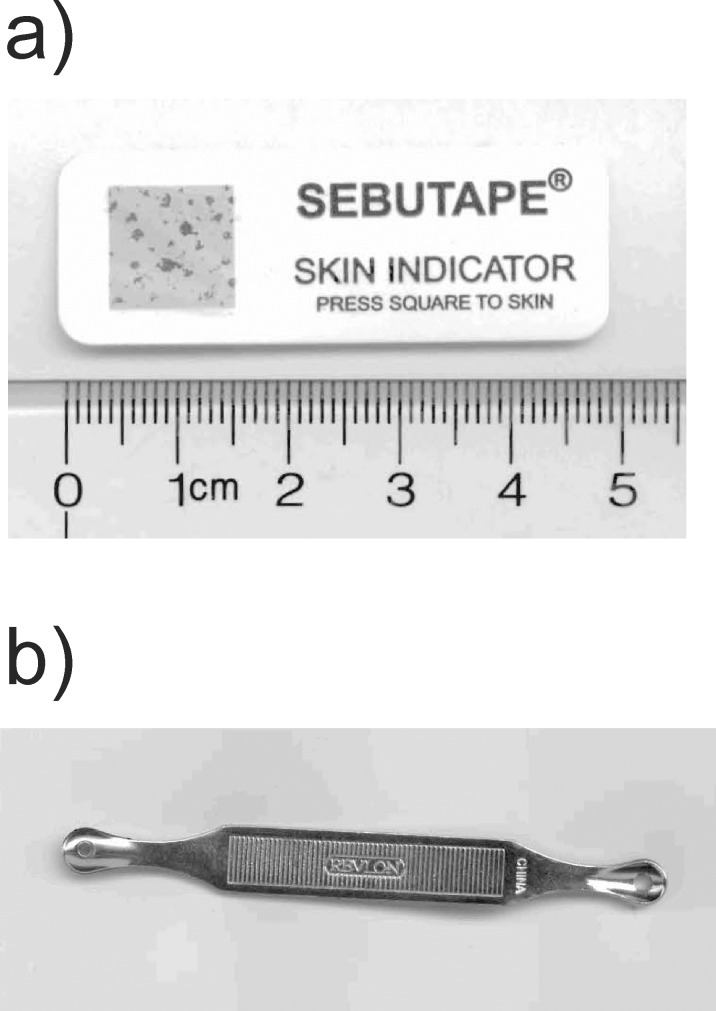
Lipid absorbent tape (Sebutape; CuDerm Corp., Dallas, TX, USA; Fig. 2a) is a microporous film that was designed to collect sebum from the skin.16,36 The tape (CuDerm Corp.) was pressed for 45 seconds onto the nose to collect sebum. As the SQ content in the nose and eyelid skin sebum is presumably identical, sebum from the skin of the nose was used because it is easier to collect higher sample amounts suitable for repetitive measurements. Sebum was collected from a 59-year-old Caucasian donor once in the morning and once at night for a period of a week. A total of 56 tape (CuDerm Corp.) samples were removed from the cardboard backing and placed directly into a 15-mL glass scintillation vial containing 5 mL chloroform. The samples were sonicated under an atmosphere of argon gas in an ultrasonic bath (Branson 1510; Branson Ultrasonics, Danbury, CT, USA) for 10 minutes. The tape (CuDerm Corp.) was removed from the vial and placed into another vial containing 5 mL chloroform. The sample was again sonicated. The tape (CuDerm Corp.) was removed and the chloroform from the two extractions was mixed and the chloroform was evaporated under a stream of nitrogen gas. We added CDCl3 (500 μL) to 33.4 mg of extracted sebum lipid. The sample was sonicated under an atmosphere of argon gas in an ultrasonic bath (Branson Ultrasonics) for 10 minutes and placed into an NMR tube for spectral measurement.
Figure 2.
(a) Sebutape (CuDerm Corp.) is a thin lipid absorbent surface that covers the gray box shown in the figure on a cardboard backing. Sebum lipid absorbed into the tape after pressing the tape onto the forehead is visible as dark dots on the gray surface. The length of the cardboard backing is 4.5 cm. The tape (CuDerm Corp.) can be removed from the cardboard backing and the amount and composition of lipid can be measured directly using infrared spectroscopy,16 or extracted and quantified by NMR spectroscopy as in this study or quantified chemically.16 (b) Sebum was also collected using a stainless steel blackhead remover (Revlon, Inc.) by rubbing the nose and forehead with the remover. Sebum was collected in the small holes at the ends of the device.
Sebum was also collected using a stainless steel blackhead remover (Revlon, Inc., New York, NY, USA) by rubbing the nose and forehead with the blackhead remover (Revlon, Inc.; Fig. 2b). Sebum was collected from the same 59-year-old Caucasian donor from which sebum was collected with tape (CuDerm Corp.). The sebum that accumulated in the small holes of the device was dislodged from the remover by placing it into a weighed 15-mL glass scintillation vial containing 2 mL chloroform and sonicated under an atmosphere of argon gas in an ultrasonic bath (Branson Ultrasonics) for 10 minutes. The solvent was dried under a stream of nitrogen gas. We added CDCl3 (500 μL) to the 11.9 mg of collected sebum lipid. The sample was sonicated under an atmosphere of argon gas in an ultrasonic bath (Branson Ultrasonics) for 10 minutes and placed into an NMR tube for spectral measurement.
NMR Spectral Measurements
Spectral data were acquired using a spectrometer (Varian VNMR 700 MHz NMR; Varian, Lexington, MA, USA) equipped with a 5 mm 1H{13C/15N} 13C–enhanced cold probe (Varian, Palo Alto, CA, USA). Spectra were acquired with a minimum of 250 scans, 45° pulse width, and a relaxation delay of 1.000 seconds. All spectra were obtained at 25°C. We performed HSQC using 512 increments with 16 scans per increment, 45° pulse width, and a relaxation delay of 1.000 seconds, mixing time of 0.080 seconds, and a one-bond coupling constant threshold of 140 Hz. Spectra were analyzed using chemistry software (MestReNova, version 7.1.2-10008; Mestrelab Research S.L., Santiago de Compostela, Spain). The resonance of TMS was set to 0 ppm. Commercial software (GRAMS 386; Galactic Industries Corp., Salem, NH, USA) was used for spectral deconvolution and curve fitting. The area of each band was used for the quantification of lipid composition.36,56
Fourier Transform Infrared Spectroscopy (FTIR)
Infrared spectroscopy was used to measure and quantify phase transitions of lipids as reported.57 Lipid on the AgCl window was placed in a temperature-controlled infrared cell. The cell was jacketed by an insulated water coil connected to a circulating water bath (model R-134A; Neslab Instruments, Newton NH, USA). The sample temperature was measured and controlled by a thermistor touching the sample cell window. The water bath unit was programmed to measure the temperature at the thermistor and to adjust the bath temperature so that the sample temperature could be set to the desired value. The rate of heating or cooling (1°C/15 minutes) at the sample was also adjusted by the water bath unit. Temperatures were maintained within ±0.01°C. Infrared spectra were measured using a Fourier transform infrared spectrometer (Nicolet 5000 Magna Series; Thermo Fisher Scientific, Inc., Waltham, MA, USA). Exactly 150 interferograms were recorded and averaged. Spectral resolution was set to 1.0 cm−1. Phase transitions were run four times with care taken to obtain data points in the sharp phase-transition temperature region. Replicate runs were combined and then the phase-transition parameters were calculated.
Infrared data analysis was then performed with commercial software (Galactic Industries). The frequency of the CH2 symmetric CH2 stretching band near (2850 cm−1) was used to estimate the content of trans and gauche rotamers in the hydrocarbon chains. Although the 2954 cm−1 asymmetric CH2 stretching band is useful for measuring phase-transition parameters, we chose to use the 2850 cm−1 band rather than the band near 2954 cm−1, because measurement of the asymmetric band frequency is complicated by the adjacent CH3 symmetric stretching band near 2955 cm−1 and the CH2 symmetric stretching band near 2852 cm−1. The symmetric stretch was calculated by first baseline leveling the OH-CH stretching region between 3500 and 2700 cm−1. The center of mass of the CH2 symmetric stretching band, Ν̃sym, was calculated by integrating the top 10% of the intensity of the band. The baseline for integrating the top 10% of the intensity of the band was parallel to the OH-CH region baseline. Lipid CH2 groups in the hydrocarbon chains are present as gauche rotamers, prevalent in disordered hydrocarbon chains, or trans rotamers, more abundant in ordered hydrocarbon chains. Thus, lipid hydrocarbon chain order may be evaluated in terms of the relative amount of CH2 trans rotamers. The frequency of the CH2 symmetric stretch is dependent on the amount of trans or gauche rotamers58,59 and has been used to characterize lipid phase transitions and to measure the trans rotamer content of lipid hydrocarbon chains with changes in temperature.60–62 Since rotamers are either in trans or gauche conformations, phase transitions can be described by a two-state sigmoidal equation, as described by Borchman et al.60 Lipid order at 33.4°C was calculated by extrapolating the Ν̃sym at 33.4°C from the fit of the phase transition and then converting Ν̃sym to the percentage of trans rotamers, a measure of lipid conformational order.60–61 The data for percentage of trans rotamers were used to calculate the phase-transition enthalpy and entropy from the slopes of Arrhenius plots, as described in Borchman et al.60
Langmuir Trough Studies
Surface pressure-area profiles of human meibum and human sebum were recorded using a computer-controlled single barrier Langmuir Teflon trough (Nima 102M; Nima Technology Ltd., Coventry, England) with a surface area of 15 to 90 cm2. The surface pressure was measured by a pressure sensor with a Wilhelmy plate (Whatman, Chr 1 filter paper). The trough was enclosed in a transparent PMMA (Perspex; Lucite International, Lancashire, UK) cabinet to avoid air currents and dust particles. The temperature of the trough was maintained at 35°C. The trough was filled with an artificial tear (AT) solution63 that emulated the salt composition of human tears (NaCl 6.6 g/L; KCl 1.7 g/L; NaHCO3 1.4 g/L; CaCl2.2H2O 0.15 g/L; NaH2PO4.H2O 0.1g/L; MOPS 4.18 g/L; pH 7.4). Purified water (Milli-Q, resistance >18.2 MΩ; Millipore Corp., Billerica, MA, USA) was used for preparing the AT solution. The AT solution surface was cleaned with a vacuum aspirator until a clean surface was achieved (pressure change <0.02 mN/m when the surface area was compressed and expanded completely). The lipid sample in chloroform was spread dropwise on the surface of the AT solution using a microsyringe (Hamilton Co., Bonaduz, Switzerland) and chloroform was allowed to evaporate for 10 minutes. The lipid film was compressed and expanded with a barrier speed of 15 cm2/minute and changes in pressure (Π) with area (A) were recorded as Π-A profiles. The sebum Π-A profiles (23.8 mg/mL) and meibum (1 mg/mL) alone was recorded. Sebum was mixed with meibum (S:M) at mole fraction ratios: 0.25:0.75, 0.70:0.30, and 0.97:0.03 (based on estimated molecular weights 490 and 720 g/mole, respectively)64–67 and Π-A profiles of mixtures were recorded. The excess area of mixing (Aex) of sebum and meibum in the mixed films was determined by the following equation68:
 |
where A1,2, A1, and A2 are the molecular areas of the mixture and the pure components, and X1 and X2 are the mole fractions of the two components in the mixture. A negative value means molecules in the mixture occupy less surface area than expected (condensation effect), while a positive value indicates the opposite, that is, an expansion effect.
Statistics
Data are presented as the average ± standard deviation of the mean. Experiments were repeated at least three times. A Student's t-test was used to compare means.
Results
Human Material
For the infrared spectroscopy meibum/sebum phase transition study, meibum was pooled from three donors: MC4, MC4, FC6. Meibum from children was used as a first test rather than meibum from adults since the difference between the phase transition temperature of meibum from children and sebum was greater than the difference between the phase transition temperature of meibum from adults and sebum. If we were to see a change with sebum, our best chance would be to first use meibum from children. For the infrared spectroscopy meibum/SQ phase transition study, meibum was pooled from seven donors: MA21, FC 21, FB21, MC59, MC22, FA 42, and FA19, where M is male, F is female, A is Asian, C is Caucasian, B is black, and the number is the age of the donor in years. This age range reflects the majority of adults without major age- or dry eye–related changes in their infrared phase transition parameters.69 For Langmuir trough studies, meibum was pooled from four donors: MC37, FC56, MC59, and MC67. Sebum for all studies was obtained from a 59-year-old Caucasian male. The phospholipid composition of this sample was typical of sebum collected from a wide range of donors (Table 1). The composition of sebum was identical within 1% for samples collected with tape (CuDerm Corp.) or expression.
Table 2.
Lipid Phase Transition Parameters

Langmuir Trough Studies
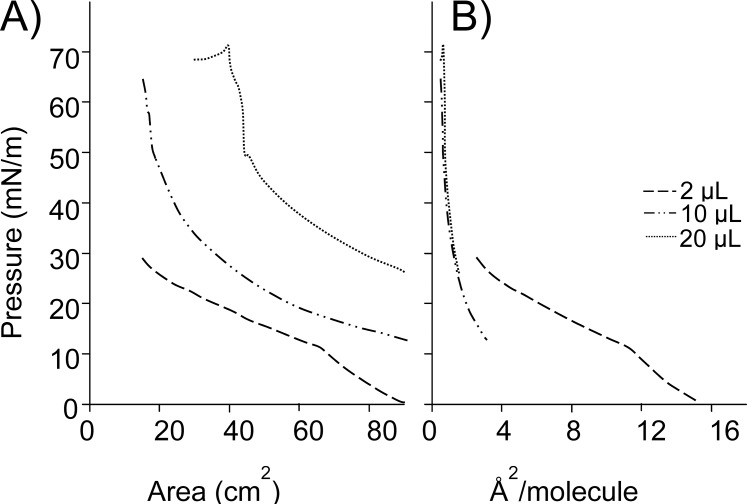
Sebum (20 μL) spread on an AT solution at the maximum area had a very high baseline spreading pressure (26 mN/m; Fig. 3). On compression, there was a continuous increase in pressure until approximately 50 mN/m. With further compression, there was a steep increase in pressure that continued until approximately 70 mN/m, after which the film collapsed. Since the baseline and surface pressures for sebum were quite high, lower volumes were also tested. The baseline pressure for 10 μL was also very high (∼13 mN/m) and a very low volume (2 μL) showed a baseline pressure near zero, but the increase in pressure was seen immediately on starting the compression (Fig. 3). Films prepared with lower amounts of sebum showed a continuous increase in pressure upon compression and were highly compressible. The pressure-area profile of 20 μL meibum was typical with a slow and continuous increase in pressure upon compression (Fig. 4), indicating that it formed a compressible liquid film.
Figure 3.
Pressure-area profiles of various volumes of sebum on the artificial tear solution at 35°C. (A) Profiles with surface areas. (B) Profiles with average molecular areas. Data show compression parts of the profiles for 2, 10, and 20 μL sebum.
Figure 4.
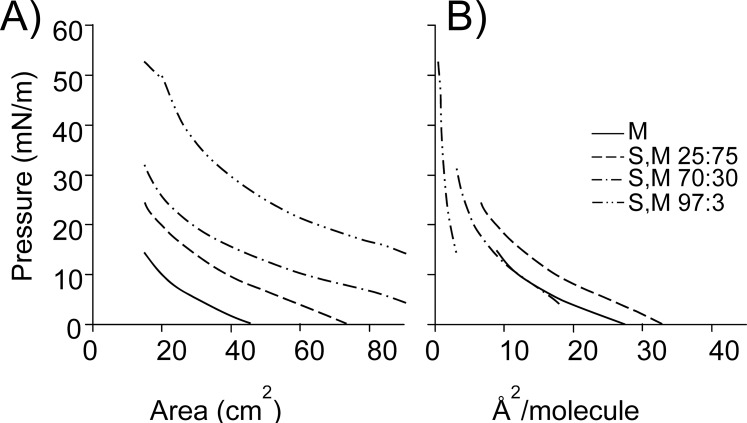
Pressure-area profiles of the mixtures of sebum with meibum on the artificial tear solution at 35°C. (A) Profiles with surface area. (B) Profiles with molecular area. Data show compression parts of the profiles of sebum:meibum mixtures (S:M in mole fraction ratios 0.25:0.75, 0.70:0.30, and 0.97:0.03) and meibum (M). Sebum increased the average molecular area in the 0.25:0.75 mixture, did not affect it much in the 0.70:0.30 mixture, and decreased it in the 0.97:0.03 mixture, in comparison with the molecular area of meibum alone.
Sebum was mixed with meibum to observe how it influenced the biophysical properties of meibum at the air-liquid interface. The pressure-area profile of 0.25:0.75 mixture showed first pressure rise upon compression nearly 30 cm2 earlier than that for meibum alone which shows that sebum caused meibum to expand by around 30 cm2 (Fig. 4A). Sebum also increased the surface pressure of the mixture at the maximum compression by around 10 mN/m. Increasing amounts of sebum caused an increase in the baseline pressures of mixtures 0.70:0.30 and 0.97:0.03 (Fig. 4). The surface pressure at the maximum compression also increased by 17 mN/m and 38 mN/m, respectively. The shape of the pressure-area curves for all mixtures showed a continuous increase in pressure with high compressibility, typical of liquid films. Although pressure-area profiles of meibum/sebum mixtures indicated an increase in surface area with increasing amount of sebum, plots of surface pressure versus molecular area show that sebum caused an increase in average molecular area for only 0.25:0.75 mixture with respect to that of meibum (Fig. 4B). The average molecular area of 0.70:0.30 mixture did not change much and that of 0.97:0.03 mixture was reduced substantially in comparison with meibum (Fig. 4B).
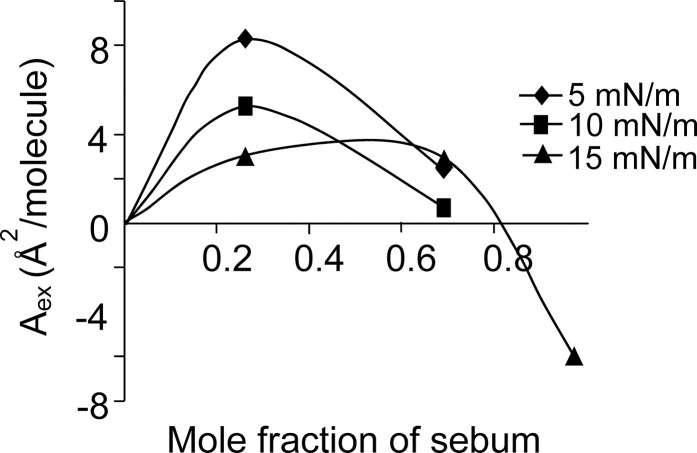
The excess area of mixing calculated for mixed films of sebum and meibum at different surface pressures (Fig. 5) showed that in 0.25:0.75 mole fraction mixture sebum caused an expansion effect (as indicated by the positive values of Aex). The 0.70:0.30 mole fraction mixture also showed slight expansion but the highest mole fraction of sebum (0.97:0.03) caused a condensation effect on the lipid mixture at the pressure of 15mN/m (as indicated by the negative values of Aex). The baseline pressure for 0.97:0.03 mixture was 15 mN/m, so Aex values below this pressure could not be calculated for this mixture. Similarly, the maximum surface pressure for meibum was 15 mN/m, so Aex values above this pressure could not be calculated for mixtures. In spite of these technical difficulties, the data indicated that sebum can cause expansion or condensation of meibum depending on its concentration in the mixture.
Figure 5.
Excess area of mixing of the mixed films of sebum and meibum at different surface pressures. The data indicate that sebum exhibits an expansion effect on meibum in 0.25:0.75 mole fraction ratio, a slight expansion effect in 0.70:0.30 mole fraction ratio, but a condensation effect in 0.97:0.03 mole fraction ratio.
FTIR Studies
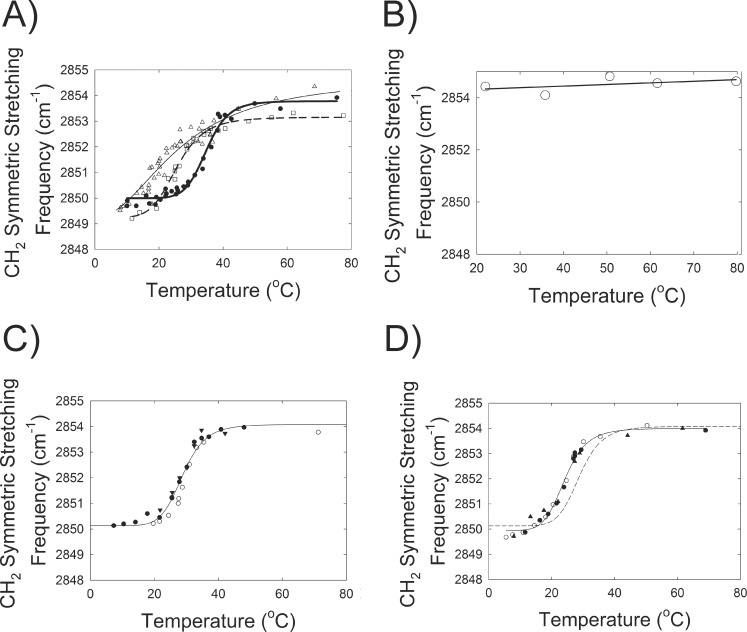
FTIR was used to measure the biophysical properties of meibum, sebum, SQ and meibum mixtures. The changes in hydrocarbon chain conformation with temperature (phase transition) of sebum or SQ have never been measured. Sebum exhibited a broad phase transition (Fig. 6A) centered at 27°C (Table 2). As expected from the melting temperature of SQ (−75°C), SQ was 87% disordered and did not undergo a phase transition between 20 and 80°C (Fig. 6B). The slight increase (0.4 cm−1) in the CH2 symmetric stretching frequency of SQ between 20 and 80°C may be due to increased bond rotational motion upon heating.
Figure 6.
Order-disorder lipid phase transitions were measured using infrared spectroscopy. The infrared CH2 symmetric stretching band center of mass (frequency) was measured to calculate trans/gauche rotamer ratios as a lipid order parameter. Higher center of mass values indicates more disorder in the hydrocarbon chains. (A) ( ) Lipid phase transition of sebum from a 61-year-old Caucasian male. (
 ) Lipid phase transition of meibum from children mixed with sebum (20% by weight). (
 ) Lipid phase transition of meibum pooled from children. Phase transition parameters are provided in Table 2. (B) No order-disorder transition was detected for squalene through the temperature range measured. (C) Phase transitions for a pool of human meibum pooled from adults. (D) Phase transitions for a pool of human meibum pooled from adults and squalene (3:1, weight:weight). (—) Curve fit of data from Figure 3C for comparison. Phase transition parameters for the phase transitions are found in Table 3. (—) Curve fit to data. Symbols are separate experiments conducted on different days.
Table 3.
Lipid Phase Transition Parameters

The lipid phase transition parameters of meibum from children (Table 2) were characteristic of those measured previously for children.69 Meibum from children was much more ordered than meibum from adults (Table 3) in agreement with a previous study.69 At physiological temperature, 33.4°C, sebum was less ordered than meibum from children (Table 2) and more ordered than meibum from adults (Table 3). Meibum from children was mixed with sebum to test if sebum had an effect on the phase transition parameters of meibum. When meibum from children was mixed with sebum (20% sebum by weight), the mixture became much less ordered compared with meibum alone and all of the phase transition parameters were significantly different (Fig. 6A; Table 2). Sebum lowered the enthalpy of the phase transition and lowered the phase transition temperature of meibum (Fig. 6A; Table 2) disrupting lipid-lipid interactions.
Table 4.
Confirmation of 1H and 13C NMR Resonance Assignments for Squalene and Human Sebum
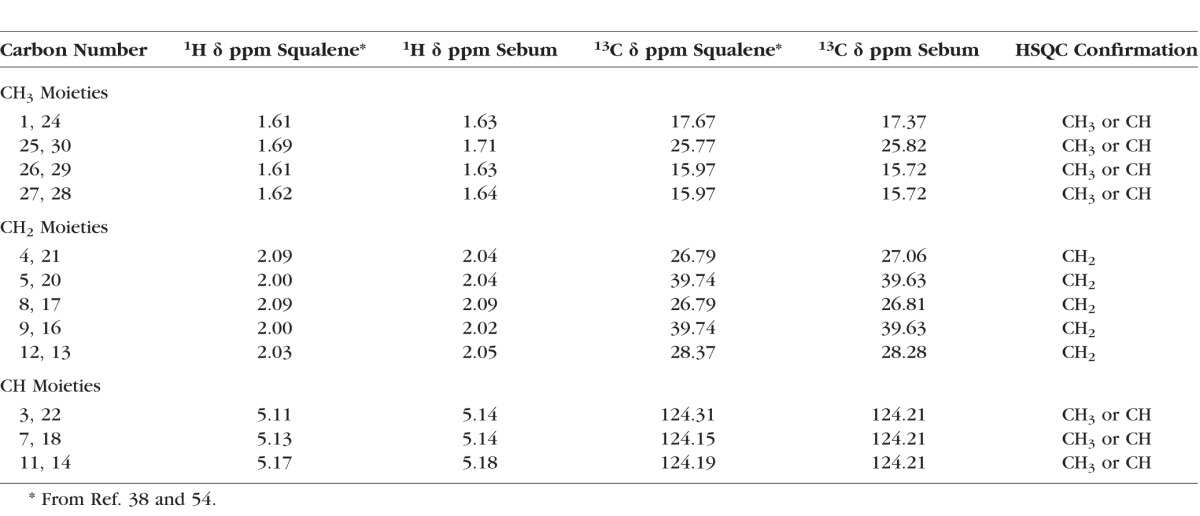
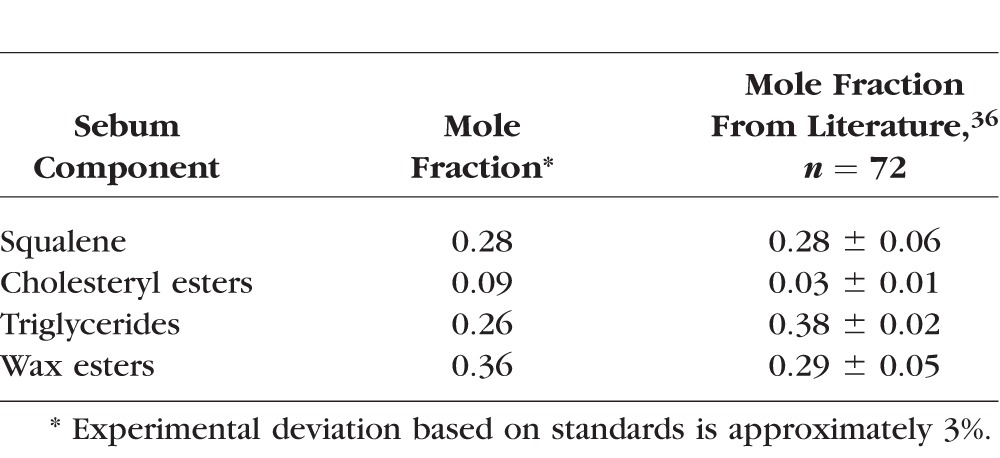
Sebum contains 28% SQ (Table 4) so we tested if SQ could contribute to the disordering of meibum by sebum. Squalene has a much lower melting point (−75°C) than the transition temperature of both sebum (Table 2) and meibum (28–35°C).57,69,70 A ratio of SQ well above expected physiological levels was used to clearly delineate an effect should one occur. Squalene caused significant (P < 0.05) changes in the phase transition parameters for a pool of human meibum (Figs. 6C, 6D; Table 3). Although SQ caused a small 5°C change in the phase transition temperature of meibum, because the phase transition temperature of adult meibum is close to physiological temperature, SQ caused a large (21%) decrease in meibum lipid order from 30% to 23.8%. The phase transition temperature, enthalpy, entropy and order at 34°C all decreased with SQ (Table 3).
Table 1.
Mole Fractions of Components of Human Sebum From A 59-Year-Old Caucasian Male and Literature
NMR Studies
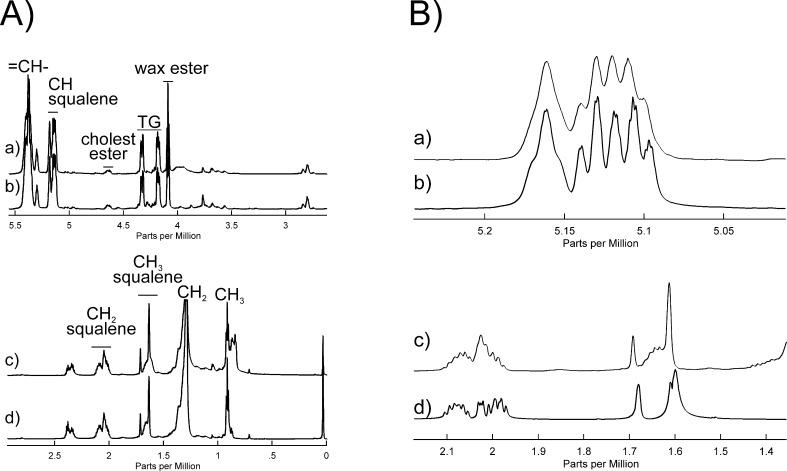
The =CH resonance region (Figs. 7a, 7Ab, 7Ba, 7Bb), and CH2 and CH3 regions (Figs. 7Ac, 7Ad, 7Bc, 7Bd) of the NMR spectra of human sebum extracted from tape (CuDerm Corp.; Figs. 7Aa, 7Ac) were almost identical to those observed in the spectrum of human sebum collected directly using an extractor tool (Fig. 7Ab, 7Ad). However, there were slight differences in the resonances at 2.38 and 0.847 ppm that were more intense in the NMR spectrum of human sebum extracted from Sebutape compared to sebum extracted directly.
Figure 7.
(A) 1H NMR spectra of sebum from a 59-year-old Caucasian donor. The =CH resonance regions of (a) sebum extracted from tape (CuDerm Corp.); (b) sebum collected directly. The CH2 and CH3 resonance regions of (c) sebum extracted from tape (CuDerm Corp.); (d) sebum collected directly. (B) 1H NMR spectra of: (a, c) sebum collected directly from a 59-year-old Caucasian donor; (b, d) squalene.
The =CH resonance region accounts for 6 of the 50 protons of SQ (Fig. 7Bb) that are characteristic of terpenoids (Fig. 8). The close correspondence between the NMR resonance intensities (Table 2) and chemical shifts (Table 3) of human sebum (Figs. 7Ba, 7Bc) and SQ (Figs. 7Bb, 7Bd) strongly suggests that the resonances in this region for human sebum are due to terpenoids such as SQ. Vicinal coupling constants (3JHH), the frequency difference between the split peaks, are larger for anticlinal than for synclinal isomers.71 The vicinal coupling constants for the peaks near 5.15 are 7.6 ± 0.7 Hz, thus confirming the proposed anticlinal isomer assignment.
Figure 8.
Numbering of carbons used throughout.
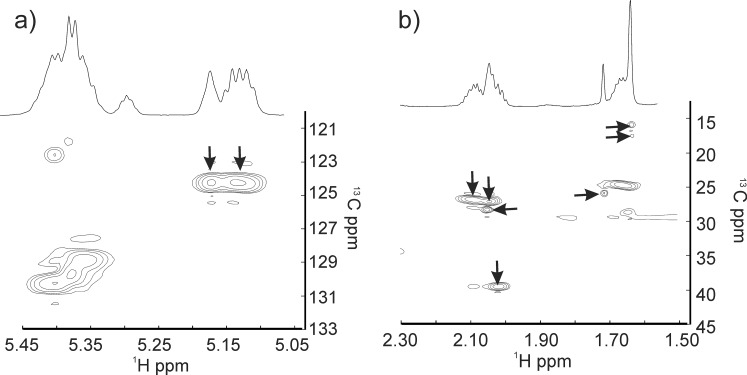
The largest resonance in this region was observed at 5.32 ppm with a shoulder at 5.35 ppm (Figs. 7Aa, 7Ab). These partially overlapped resonances are assigned to protons of the =CH moieties from hydrocarbon chains and to the proton attached to carbon #6 of cholesterol esters, respectively. The spectra HSQC confirm the resonance assignments for this region of the 1H and 13C spectra of human sebum (Fig. 9; Table 3).
Figure 9.
1H NMR spectra of human sebum collected directly from a 59-year-old Caucasian donor atop the HSQC spectra. Arrows show resonances assigned to squalene. (a) The =CH resonance region. (b) The CH2 and CH3 resonance region. The chemical shifts are listed in Table 3.
The 1H resonances from CH3 and CH2 moieties of SQ (Fig. 7Bd) are relatively well resolved in NMR spectra of human sebum (Fig. 7Bc) and HSQC spectra confirm the resonance assignments for the 1H and 13C spectra of human sebum (Fig. 9b; Table 3) for this region.
From the intensities of the NMR ester resonances in Figure 7Ab, we calculated the mole fractions of SQ, cholesteryl, and wax esters and triglycerides in a sample of human sebum (Table 4).
Discussion
As stated previously, sebum could mix with meibum on the eyelid margin (Fig. 1) either naturally or as a contaminant artefact of collection. The major aim of our study was to determine if sebum affected the surface properties of meibum. Using Langmuir trough technology, we found that the surfactant properties of a mixture of meibum and sebum were enhanced compared with meibum alone. Meibum itself forms a highly compressible liquid film that is suitable for repeated compression and expansion during blinking.67 The baseline pressure and surface activity of sebum films were much higher than that of meibum films. This is because of the difference in their molecular weight and composition.65 The estimated molecular weight of sebum is 490 g/mole and it is rich in triglycerides, which contribute to the high spreading pressure of its film, while the estimated molecular weight of meibum is 720 g/mole with a relatively lower level of triglycerides. So the presence of triglycerides in sebum might explain the high baseline spreading pressure observed in our sebum-meibum mixtures. The molecular areas of mixtures at highest compression, calculated by estimated molecular weights of two components and assuming all molecules were on the surface, were too small for a lipid molecule. These unusually small molecular areas were indicative of multilayer formation in which molecules continued to stack vertically under increasing compression but did not collapse even at high pressures.67,72 This would explain high compressibility and high surface pressures in the sebum-meibum mixtures.
Our infrared spectroscopic study showed that at physiological temperature, sebum was 30% less ordered (more fluid) than meibum with weaker lipid–lipid interactions. Ordered lipids with strong lipid–lipid interactions would be expected to aggregate into “islands” and not to exhibit strong spreading pressures. Conversely, sebum that is less ordered would be expected to exhibit a high spreading pressure. This hypothesis was confirmed in our Langmuir trough study. In another Langmuir trough/infrared spectroscopy study we showed that the major factor affecting the conformation (fluidity) of many lipid systems including meibum was hydrocarbon chain saturation.73 As confirmed in this study, meibum from adults were less ordered than meibum from children69 largely due to hydrocarbon chain saturation.73 Although hydrocarbon chain saturation is likely to contribute to the difference in lipid order between sebum and meibum from children, it has yet to be determined.
Sebum decreased the phase transition temperature and hydrocarbon chain order when mixed with meibum resulting in a more fluid film. This is in agreement with the Langmuir trough study which showed that sebum expanded meibum films at lower concentrations, fluidizing the meibum. A more fluid lipid film is beneficial for the better spread of the TFLL. Furthermore, sebum caused meibum to be more compressible and more surface active at higher pressures. Thus, sebum could stabilize the TFLL at the ocular surface.
A variety of techniques have been used to confirm squalene is present in sebum. In this study, using HSQC NMR spectroscopy, we confirmed that the resonances near 5.2 ppm tentatively assigned to SQ in human sebum36 are correct. Heteronuclear single quantum correlation, an inverse heteronuclear two-dimensional technique, constitutes one the most powerful methods available for tracing out the carbon skeleton of organic compounds. In our sebum sample, the molar percentage of SQ was 28% identical with the average values reported (Table 1). Based on the observed NMR resonance intensities and shifts observed, we can confidently confirm that squalene is present on the eyelid38 and in this study, sebum. However, it is possible that other terpenoids and derivatives of squalene such as epoxides52 and mono to tetramethylsqualene74 could be present as wide variety of terpenoids exist in nature. As our NMR spectra are complicated by a wide variety of lipids, NMR alone can not be used to confidently identify the many types of terpenoids that exist, especially if they are not abundant. We propose to determine if other terpenoids are present in sebum, tears, and meibum using gas chromatography/mass spectrometry along with NMR analysis as was done for other systems.74
Using infrared spectroscopy, we found that 20 weight percent SQ had a disordering effect on meibum. This is opposite the effect of SQ in other phospholipid systems where SQ may have a condensation or area-expansion effect in a lipid mixture depending on its content and film pressure.75,76 It exerts area condensing effects on polar lipids above 10 mole percent and in dense liquid-expanded or liquid-condensed phase.77 Although SQ causes the hydrocarbon chains of meibum lipid to be more fluid, SQ in sebum is unlikely to influence the rheology of meibum; in another study, SQ alone did not possess surfactant properties and when mixed with human meibum, it was shown that at a higher degree of film area compression SQ did not affect the surface pressure of the films.33 At low surface pressures, SQ localized over thinner regions of meibum films.33
We found that sebum expanded meibum films at lower concentrations and condensed meibum films at higher concentrations. It is likely that only a small quantity of sebum, less than 28%, is expected to mix with the tear film,33 so physiological levels of sebum would be expected to expand or fluidize meibum, making it spread better and be more surface active, the qualities beneficial for the tear film lipid layer. Sebum caused meibum to be more stable at higher pressures (greater maximum surface pressure). So sebum could stabilize meibum, allowing it to withstand the high shear pressure of a blink. From this study, we see sebum-meibum interaction appear to be relevant. In future studies, we hope to measure meibum-sebum interactions related to age, sex, race, and disease.
Acknowledgments
The authors thank Australian Nuclear Science and Technology Organisation for use of the Langmuir trough equipment.
Supported by Kentucky Lion's Eye Foundation; an unrestricted grant from Research to Prevent Blindness, Inc.; and National Institute of Health, Kentucky Biomedical Research Infrastructure Network grants (DG fellowship) and R01 EYO 26180, DB. The authors alone are responsible for the content and writing of the paper.
Disclosure: P. Mudgil, None; D. Borchman, None; D. Gerlach, None; M.C. Yappert, None
References
- 1. King-Smith PE,, Fink BA,, Fogt N,, Nichols KK,, Hill RM,, Wilson GS. The thickness of the human precorneal tear film: evidence from reflection spectra. Invest Ophthalmol Vis Sci. 2000; 41; 3348–3359. [PubMed] [Google Scholar]
- 2. King-Smith PE,, Hinel EA,, Nichols JJ. Application of a novel interferometric method to investigate the relation between lipid layer thickness and tear film thinning. Invest Ophthalmol Vis Sci. 2010; 51: 2418–2423. [DOI] [PMC free article] [PubMed] [Google Scholar]
- 3. Korb DR,, Baron DF,, Herman JP,, et al. Tear film lipid layer thickness as a function of blinking. Cornea. 1994; 13; 354–359. [DOI] [PubMed] [Google Scholar]
- 4. Butovich IA. On the lipid composition of human meibum and tears: comparative analysis of nonpolar lipids. Invest Ophthalmol Vis Sci. 2008; 49; 3779–3789. [DOI] [PMC free article] [PubMed] [Google Scholar]
- 5. Foulks GN. The correlation between the tear film lipid layer and dry eye disease. Surv Ophthalmol. 2007; 52: 369–374. [DOI] [PubMed] [Google Scholar]
- 6. Green-Church KB,, Butovich I,, Willcox M,, et al. The international workshop on meibomian gland dysfunction: report of the subcommittee on tear film lipids and lipid-protein interactions in health and disease. Invest Ophthalmol Vis Sci. 2011; 52; 1979–1993. [DOI] [PMC free article] [PubMed] [Google Scholar]
- 7. Holly FJ. Physical chemistry of the normal and disordered tear film. Trans Ophthalmol Soc UK. 1985; 104: 374–380. [PubMed] [Google Scholar]
- 8. Knop E,, Knop N,, Schirra F. Meibomian glands. Part II: physiology characteristics, distribution and function of meibomian oil. Ophthalmologe. 2009; 106: 884–892. [DOI] [PubMed] [Google Scholar]
- 9. Knop E,, Knop N,, Millar T,, Obata H,, Sullivan D. The international workshop on Meibomian gland dysfunction: report of the subcommittee on anatomy, physiology, and pathophysiology of the meibomian gland. Invest Ophthalmol Vis Sci. 2011; 52: 1938–1978. [DOI] [PMC free article] [PubMed] [Google Scholar]
- 10. Pucker AD,, Nichols JJ. Analysis of meibum and tear lipids. Ocul Surf. 2012; 10: 230–250. [DOI] [PubMed] [Google Scholar]
- 11. Pucker AD,, Haworth KM. The presence and significance of polar meibum and tear lipids. Ocul Surf. 2015; 13: 26–42. [DOI] [PubMed] [Google Scholar]
- 12. Owen RW,, Haubner R,, Würtele G,, Hull E,, Spiegelhalder B,, Bartsch H. Olives and olive oil in cancer prevention. Eur J Cancer Prev. 2004; 13: 319–326. [DOI] [PubMed] [Google Scholar]
- 13. Chew CK,, Hykin PG,, Jansweijer C,, Dikstein S,, Tiffany JM,, Bron AJ. The casual level of meibomian lipids in humans. Curr Eye Res. 1993; 12: 255–259. [DOI] [PubMed] [Google Scholar]
- 14. Nagymihályi A,, Dikstein S,, Tiffany JM. The influence of eyelid temperature on the delivery of meibomian oil. Exp Eye Res. 2004; 78: 367–370. [DOI] [PubMed] [Google Scholar]
- 15. Yokoi N,, Bron AJ,, Georgiev GA. The precorneal tear film as a fluid shell: the effect of blinking and saccades on tear film distribution and dynamics. Ocul Surf. 2014; 12: 252–266. [DOI] [PubMed] [Google Scholar]
- 16. Ashraf Z,, Pasha U,, Greenstone V,, et al. Quantification of human sebum on skin and human meibum on the eyelid margin using sebum tape, spectroscopy and chemical analysis. Curr Eye Res. 2011; 36: 553–562. [DOI] [PubMed] [Google Scholar]
- 17. Komuro A,, Yokoi N,, Kinoshita S,, Tiffany JM,, Bron AJ,, Suzuki T. Assessment of meibomian gland function by a newly-developed laser meibometer. Adv Exp Med Biol. 2002; 506 (part A): 517–520. [DOI] [PubMed] [Google Scholar]
- 18. Berger RE,, Corrsin S. A surface tension gradient mechanism for driving the pre-corneal tear film after a blink. J Biomech. 1974; 7: 225–238. [DOI] [PubMed] [Google Scholar]
- 19. Bron AJ,, Tiffany JM,, Gouveia SM,, Yokoi N,, Voon LW. Functional aspects of the tear film lipid layer. Exp Eye Res. 2004; 78: 347–360. [DOI] [PubMed] [Google Scholar]
- 20. King-Smith PE,, Fink BA,, Hill RM,, Koelling KW,, Tiffany JM. The thickness of the tear film. Curr Eye Res. 2004; 29: 357–368. [DOI] [PubMed] [Google Scholar]
- 21. Knop E,, Knop N. Conjunctiva immune surveillance. : Dartt DA,, Edelhauser HF, Encyclopedia of the Eye. Oxford: Elsevier; 2009: 63. [Google Scholar]
- 22. McDonald JE,, Brubaker S. Meniscus-induced thinning of tear films. Am J Ophthalmol. 1971; 72: 139–146. [DOI] [PubMed] [Google Scholar]
- 23. Yokoi N,, Bron AJ,, Tiffany JM,, Kinoshita S. Reflective meniscometry: a new field of dry eye assessment. Cornea. 2000; 19: S37–S43. [DOI] [PubMed] [Google Scholar]
- 24. Norn M. Expressibility of meibomian secretion. Relation to age lipid precorneal film, scales, foam, hair and pigmentation. Acta Ophthalmol (Copenh). 1987; 65: 137–142. [DOI] [PubMed] [Google Scholar]
- 25. Goto E,, Dogru M,, Fukagawa K,, et al. Successful tear lipid layer treatment for refractory dry eye in office workers by low-dose lipid application on the full-length eyelid margin. Am J Ophthalmol. 1999; 142: 264–270. [DOI] [PubMed] [Google Scholar]
- 26. Norn MS. Natural fat in external eye. Vital-stained by Sudan III powder. Acta Ophthalmol (Copenh). 1980; 58: 331–336. [DOI] [PubMed] [Google Scholar]
- 27. Tsubota K,, Monden Y,, Yagi Y,, Goto E,, Shimmura S. New treatment of dry eye: the effect of calcium ointment through eyelid skin delivery. Br J Ophthalmol. 1999; 83: 767–770. [DOI] [PMC free article] [PubMed] [Google Scholar]
- 28. Nicolaides N,, Kaitaranta JK,, Rawdah TN,, Macy JI,, Boswell FM,, III, Smith RE. Meibomian gland studies: comparison of steer and human lipids. Invest Ophthalmol Vis Sci. 1981; 20: 522–536. [PubMed] [Google Scholar]
- 29. Brown SI,, Dervichian DG. Hydrodynamics of blinking. In vitro study of the interaction of the superficial oily layer and the tears. Arch Ophthalmol. 1969; 82: 541–547. [DOI] [PubMed] [Google Scholar]
- 30. Tiffany JM. The lipid secretion of the meibomian glands. Adv Lipid Res. 1987; 22: 1–62. [DOI] [PubMed] [Google Scholar]
- 31. Forstner MB,, Kas J,, Martin D. Single lipid diffusion in Langmuir monolayers. Langmuir. 2001; 17: 567–570. [Google Scholar]
- 32. Zouboulis CC,, Boschnakow A. Chronological ageing and photoageing of the human sebaceous gland. Clin Exp Dermatol. 2001; 26: 600–607. [DOI] [PubMed] [Google Scholar]
- 33. Ivanova S,, Borchman D,, Yappert MC,, Tonchev V,, Yokoi N,, Georgiev G. Surface properties of squalene/meibum films and NMR confirmation of squalene in tears. International J Mol Sci. 2015; 9; 16: 21813–21831. [DOI] [PMC free article] [PubMed] [Google Scholar]
- 34. De Luca C,, Valacchi G. Surface lipids as multifunctional mediators of skin responses to environmental stimuli. Mediators Inflamm. 2010; 2010: 321494. [DOI] [PMC free article] [PubMed] [Google Scholar]
- 35. Kelly GS. Squalene and its potential clinical uses. Altern Med Rev. 1999; 4: 29–36. [PubMed] [Google Scholar]
- 36. Robosky LC,, Wade K,, Woolson D,, et al. Quantitative evaluation of sebum lipid components with nuclear magnetic resonance. J Lipid Res. 2008; 49: 686–692. [DOI] [PubMed] [Google Scholar]
- 37. Borchman D,, Foulks GN,, Yappert MC,, Milliner SE. Changes in human meibum lipid composition with age using nuclear magnetic resonance spectroscopy. Invest Ophthalmol Vis Sci. 2012; 53: 475–482. [DOI] [PMC free article] [PubMed] [Google Scholar]
- 38. Borchman D,, Yappert MC,, Milliner SE,, et al. Confirmation of SQ in human eyelid lipid by heteronuclear single quantum correlation spectroscopy. Lipids. 2013; 48: 1269–1277. [DOI] [PubMed] [Google Scholar]
- 39. Ehlers N. The precorneal film. Biomicroscopical, histological and chemical investigations. Acta Ophthalmol. 1965; 81: 1–134. [PubMed] [Google Scholar]
- 40. Keith GC. Seborrhoeic blepharo-kerato-conjunctivitis. Trans Ophthalmol Soc UK. 1967; 87: 85–103. [PubMed] [Google Scholar]
- 41. Tiffany JM. Individual variations in human meibomian lipid composition. Exp Eye Res. 1978; 27: 289–300. [DOI] [PubMed] [Google Scholar]
- 42. Downie MT,, Kealey T. Lipogenesis in the human sebaceous gland: glycogen and glycerophosphate are substrates for the synthesis of sebum lipids. J Invest Dermatol. 1998; 111: 199–205. [DOI] [PubMed] [Google Scholar]
- 43. Nakahara T,, Moroi Y,, Takayama K,, Nakanishi Y,, Furue M. Analysis of sebum lipid composition and the development of acneiform rash before and after administration of EGFR inhibitor. Curr Oncol. 2015; 22: e124–e127. [DOI] [PMC free article] [PubMed] [Google Scholar]
- 44. Borchman D,, Yappert MC,, Milliner S,, et al. 13C and 1H NMR ester region resonance assignments and the composition of human infant and child meibum. Exp Eye Res. 2013; 112: 151–159. [DOI] [PubMed] [Google Scholar]
- 45. Brown SH,, Kunnen CM,, Duchoslav E,, et al. A comparison of patient matched meibum and tear lipidomes. Invest Ophthalmol Vis Sci. 2013; 54: 7417–7424. [DOI] [PubMed] [Google Scholar]
- 46. Wollensak G,, Mur E,, Mayr A,, Baier G,, Göttinger W,, Stöffler G. Effective methods for the investigation of human tear film proteins and lipids. Graefes Arch Clin Exp Ophthalmol. 1990; 228: 78–82. [DOI] [PubMed] [Google Scholar]
- 47. Lam SM,, Tong L,, Duan X,, Petznick A,, Wenk MR,, Shui GJ. Extensive characterization of human tear fluid collected using different techniques unravels the presence of novel lipid amphiphiles. Lipid Res. 2014; 55: 289–298. [DOI] [PMC free article] [PubMed] [Google Scholar]
- 48. Delahais V,, Metzger P. Four polymethylsqualene epoxides and one acyclic tetraterpene epoxide from Botryoccus braunii. Phytochemistry. 1997; 44: 671–678. [Google Scholar]
- 49. Foulks GN,, Borchman D,, Yappert M,, Kakar S. Topical azithromycin and oral doxycycline therapy of meibomian gland dysfunction: a comparative clinical and spectroscopic pilot study. Cornea. 2013; 32: 44–53. [DOI] [PMC free article] [PubMed] [Google Scholar]
- 50. Huang Z,, Poulter CD. Tetramethylsqualene, a triterpene from Botryococcus braunii var. show A. Phytochemistry. 1989; 28: 1467–1470. [Google Scholar]
- 51. Krenzer KL,, Dana MR,, Ullman MD,, et al. Effect of androgen deficiency on the human meibomian gland and ocular surface. J Clin Endocrinol Metab. 2000; 85: 4874–4882. [DOI] [PubMed] [Google Scholar]
- 52. Pogliani L,, Ceruti M,, Ricchiardi G,, Viterbo D,, An NMR. and molecular mechanics study of squalene and squalene derivatives. Chem Phys Lipids. 1994; 70: 21–34. [DOI] [PubMed] [Google Scholar]
- 53. Quang DN,, Hashimoto T,, Tanaka M,, et al. Concentoils B, C and D, three squalene-type triterpenoids from the ascomycete Daldinia concentrica. Phytochemistry. 2002; 61: 345–353. [DOI] [PubMed] [Google Scholar]
- 54. Sozzani, P,, Di Silvestro G. New assignment of C-13 NMR-spectrum of squalene. Gazzetta Chimica Italiana. 1988; 118: 385–389. [Google Scholar]
- 55. Jacobsen NE. NMR Spectroscopy Explained: Simplified theory Applications and Examples for Organic Chemistry and Structural Biology. Hoboken, NJ: Wiley-Interscience; 2007. [Google Scholar]
- 56. Shrestha RK,, Borchman D,, Foulks GN,, Yappert MC,, Milliner SE. Analysis of the composition of lipid in human meibum from normal infants, children, adolescents, adults, and adults with meibomian gland dysfunction using 1H-NMR spectroscopy. Invest Ophthalmol Vis Sci. 2011; 52: 7350–7358. [DOI] [PMC free article] [PubMed] [Google Scholar]
- 57. Borchman D,, Foulks GN,, Yappert MC,, et al. Human meibum lipid conformation and thermodynamic changes with meibomian-gland dysfunction. Invest Ophthalmol Vis Sci. 2011; 52: 3805–3817. [DOI] [PMC free article] [PubMed] [Google Scholar]
- 58. Kóta Z,, Debreczeny M,, Szalontai B. Separable contributions of ordered and disordered lipid fatty acyl chain segments to CH2 bands in model and biological membranes: a Fourier transform infrared spectroscopic study. Biospectroscopy. 1999; 5: 169–178. [DOI] [PubMed] [Google Scholar]
- 59. Moore DJ,, Wyrwa M,, Reboulleau CP,, Mendelsohn R. Quantitative IR studies of acyl chain conformational order in fatty acid homogeneous membranes of live cells of Acholeplasma laidlawii B. Biochemistry. 1993; 32: 6281–6287. [DOI] [PubMed] [Google Scholar]
- 60. Borchman D,, Foulks GN,, Yappert MC,, Ho DV. Temperature-induced conformational changes in human tear lipids hydrocarbon chains. Biopolymers. 2007; 87: 124–133. [DOI] [PubMed] [Google Scholar]
- 61. Borchman D,, Foulks GN,, Yappert MC,, Tang D,, Ho DV. Spectroscopic evaluation of human tear lipids. Chem Phys Lipids. 2007; 147: 87–102. [DOI] [PubMed] [Google Scholar]
- 62. Mantsch HH,, McElhaney RN. Phospholipid phase transitions in model and biological membranes as studied by infrared spectroscopy. Chem Phys Lipids. 1991; 57: 213–226. [DOI] [PubMed] [Google Scholar]
- 63. Mirejovsky D,, Patel AS,, Rodriguez DD,, Hunt TJ. Lipid adsorption onto hydrogel contact lens materials. Advantages of Nile red over oil red O in visualization of lipids. Optom Vis Sci. 1991; 68: 858–864. [DOI] [PubMed] [Google Scholar]
- 64. Butovich IA. Lipidomics of human meibomian gland secretions: chemistry biophysics, and physiological role of meibomian lipids. Prog Lipid Res. 2011; 50: 278–301. [DOI] [PMC free article] [PubMed] [Google Scholar]
- 65. Holly FJ. Formation and stability of the tear film. Int Ophthalmol Clin. 1973; 13: 73–96. [PubMed] [Google Scholar]
- 66. Miano F,, Calcara M,, Millar TJ,, Enea V. Insertion of tear proteins into a Meibomian lipids film. Colloids Surf B Biointerfaces. 2005; 44: 49–55. [DOI] [PubMed] [Google Scholar]
- 67. Mudgil P,, Millar TJ. Surfactant properties of human meibomian lipids. Invest Ophthalmol Vis Sci. 2011; 52: 1661–1670. [DOI] [PubMed] [Google Scholar]
- 68. Mudgil P,, Dennis GR,, Millar TJ. The surface pressure dynamics and appearance of mixed monolayers of cholesterol and different sized polystyrene at an air-water interface. Langmuir. 2005; 21: 1338–1345. [DOI] [PubMed] [Google Scholar]
- 69. Borchman D,, Foulks GN,, Yappert MC,, et al. Physical changes in human meibum with age as measured by infrared spectroscopy. Ophthalmic Res. 2010; 44: 34–42. [DOI] [PMC free article] [PubMed] [Google Scholar]
- 70. Lu H,, Wojtowicz JC,, Butovich IA. Differential scanning calorimetric evaluation of human meibomian gland secretions and model lipid mixtures: transition temperatures and cooperativity of melting. Chem Phys Lipids. 2013; 170-171: 55–64. [DOI] [PMC free article] [PubMed] [Google Scholar]
- 71. Williams DH,, Fleming I. Spectroscopic Methods in Organic Chemistry. 4th ed., revised. London: McGraw-Hill Book Company; 1989. [Google Scholar]
- 72. Petrov PG,, Thompson JM., Abdul Rahman IB,, et al. Two-dimensional order in mammalian pre-ocular tear film. Exp Eye Res. 2007; 84: 1140–1146. [DOI] [PubMed] [Google Scholar]
- 73. Mudgil P,, Borchman D,, Yappert MC,, et al. Lipid order, saturation and surface property relationships: a study of human meibum saturation. Exp Eye Res. 2013; 116: 79–85. [DOI] [PubMed] [Google Scholar]
- 74. Achitouv E,, Metzger P,, Rager M,, Largeau C. C31-C34 methylated squalenes from a Bolivian strain of Botryococcus braunii. Phytochemistry. 2004; 65: 3159–3165. [DOI] [PubMed] [Google Scholar]
- 75. Ambike A,, Rosilio V,, Stella B,, Lepêtre-Mouelhi S,, Couvreur P. Interaction of self assembled squalenoyl gemcitabine nanoparticles with phospholipid-cholesterol monolayers mimicking a biomembrane. Langmuir. 2011; 27: 4891–4899. [DOI] [PubMed] [Google Scholar]
- 76. Castelli F,, Sarpietro MG,, Micieli D,, Stella B,, Rocco F,, Cattel L. Enhancement of gemcitabine affinity for biomembranes by conjugation with squalene: differential scanning calorimetry and Langmuir-Blodgett studies using biomembrane models. J Colloid Interface Sci. 2007; 316: 43–52. [DOI] [PubMed] [Google Scholar]
- 77. Gilmore SF,, Yao AI,, Tietel Z,, Kind T,, Facciotti MT,, Parikh AN. Role of squalene in the organization of monolayers derived from lipid extracts of Halobacterium salinarum. Langmuir. 2013; 29: 7922–7930. [DOI] [PMC free article] [PubMed] [Google Scholar]


