Abstract
OBJECTIVE
Although intrauterine nutritional stress is known to result in offspring obesity and metabolic phenotype, the underlying cellular/molecular mechanisms remain incompletely understood.We tested the hypothesis that compared to the controls, the bone marrow-derived mesenchymal stem cells (BMSCs) of the intrauterine growth restricted (IUGR) offspring exhibit to a more adipogenic phenotype.
METHODS
A well-established rat model of maternal food restriction (MFR), i.e., 50% global caloric restriction during the later-half of pregnancy and ad libitum diet following birth that is known to result in an obese offspring with a metabolic phenotype was used. BMSCs at 3 weeks of age were isolated, and then molecularly and functionally profiled.
RESULTS
BMSCs of the intrauterine nutritionally-restricted offspring demonstrated an increased proliferation and an enhanced adipogenic molecular profile at miRNA, mRNA and protein levels, with an overall up-regulated PPARγ (miR-30d, miR-103, PPARγ, C/EPBα, ADRP, LPL, SREBP1), but down-regulated Wnt (LRP5, LEF-1, β-catenin, ZNF521 and RUNX2) signaling profile. Following adipogenic induction, compared to the control BMSCs, the already up-regulated adipogenic profile of the MFR BMSCs, showed a further increased adipogenic response.
CONCLUSIONS
Markedly enhanced adipogenic molecular profile and increased cell proliferation of MFR BMSCs suggest a possible novel cellular/mechanistic link between the intrauterine nutritional stress and offspring metabolic phenotype including obesity, providing new potential predictive and therapeutic targets against these conditions in the IUGR offspring.
Keywords: Adipogenesis, bone marrow mesenchymal stem cells, intrauterine growth restriction, fetal programming, childhood obesity
INTRODUCTION
Despite intense research the underlying cellular/molecular mechanisms resulting in obesity and the associated metabolic phenotype remain incompletely understood. Although “caloric imbalance”, is an important contributor to obesity 1, it is abundantly clear that maternal nutrition is a major intrauterine environmental factor for the expression of the fetal genome, with lifelong consequences on the health of the offspring, including the development of obesity and metabolic syndrome 2. This phenomenon, termed “fetal programming” and the consequent “fetal origins of adult diseases” has been well-described in offspring following intrauterine growth restriction (IUGR) 3-5, but the underlying cellular/molecular link between the two remains unknown. Though a shift towards increased adipogenic programming in adipose tissue of IUGR infants has been demonstrated 6, whether this effect is also seen in mesenchymal stem cells (MSCs) in other locations, i.e., specifically in the bone marrow, is not known. If proven to be so, it would implicate a much broader bearing of IUGR in altering offspring cellular/molecular programming in general and setting the stage for obesity and metabolic syndrome rather than its effects only on the adipocyte precursors in the adipose tissue.
Mesenchymal stem cells including those derived from the bone marrow are pluripotent cells that under appropriate conditions differentiate into adipocytes, osteoblasts, myocytes, and other cell-types. The multi-lineage and self-renewal potential allows MSCs to play critical roles in cell differentiation, proliferation, homeostasis and injury repair in a variety of organs 7. Adipogenesis involves the differentiation of adipocytes from MSCs via a complex and highly controlled gene expression programming, characterized by a tight balance between PPARγ, the master adipogenic switch and Wnt signaling pathways 8-10. We hypothesized that the bone marrow-derived MSCs (BMSCs) of the IUGR offspring are skewed towards adipogenic differentiation, reflecting a generalized obesogenic molecular programming in these infants. To test this hypothesis, we used a well-established rat model of maternal food restriction (MFR) during pregnancy that leads to later offspring obesity and metabolic syndrome 11-15.
MATERIALS AND METHODS
Rat model of maternal food restriction during pregnancy
All studies were approved by the local Institutional Animal Care and Use Committee (IACUC) and were performed, as described previously, in accordance with the NIH and IACUC guidelines 11, 12, 15. First-time pregnant Sprague Dawley rat dams were purchased from Charles River Laboratories Inc., Hollister, CA and were housed in a facility with constant temperature and humidity, in a controlled 12 h light and 12 h dark cycle. At 10 days of gestation, the dams were provided either an ad libitum diet of standard laboratory rat chow (LabDiet 5001, Brentwood, MO: protein 23%, fat 4.5%, metabolized energy 3,030 kcal/kg) or a 50% food-restricted diet, as determined by the quantification of the normal intake in the ad libitum fed rats. Following delivery, both control and maternal food restricted pups were fed ad libitum by foster dams. To minimize bias towards selecting either heavier or lighter pups, on postnatal day 1 (PND1), all pups from each litter were weighed (MFR pups: males = 5.0 ± 0.6 g and females = 5.2 ± 0.6 g demonstrated significantly (p ≤ 0.05) lower birth weights than that of control pups: males = 6.8 ± 0.6 g and females = 7.0 ± 0.7 g) and 6 pups (3 females and 3 males) closest to the median body weight (according to gender) were included in the study; the other pups were culled to keep the number of pups/litter for experimentation purposes at 6. All studies maintained a similar number of pups per dam between the control and experimental groups.
Isolation of bone marrow mesenchymal stem cells (BMSCs)
At postnatal day 21 (PND21), offspring were sacrificed and marrow was extracted from tibias and femur and BMSCs isolated and cultured following previously described protocol 16, 17. Briefly, the medullary cavities of rat femurs were flushed with MEM Alpha (1×) + GlutaMax™−1 (Cat No.: 32561-037, Life Technologies) containing 1% penicillin-streptomycin (anti-anti). The cells were washed once with MEM and plated at 1 × 10⁶ cells per 100-mm cell culture dish (Corning, Corning, NY) in the complete media: MEM Alpha containing 10% fetal bovine serum (FBS) and 1% anti-anti (Gibco, Life Technologies, Grand Island, NY, catalog# 15240-062), and cultured at 37°C in 5% CO2. Non-adherent cells were removed and fresh media was added every 48 h. At confluence, the cells were harvested and using magnetic beads (Miltenyi Biotech, Auburn, CA), macrophages were depleted with anti-CD11b antibody, and other hematopoietic cells were removed using an anti-CD45 (both from BD Biosciences, Palo Alto, CA). Due to > 95% purity of cells at passage (P) 3, all experiments were conducted at P3.
Flow cytometry of BMSCs
Adherent BMSCs cells at P3 in T75 flasks were removed by trypsinization, washed with Ca2+, Mg2+-containing 1X PBS and blocked with 3% FBS in PBS for 30 min at 4°C. Cells were aliquoted (100 μl/tube) for binding and staining with 2.5 μg/mL of FITC- or Alexa Fluor (AF)-conjugated antibodies. Sorting was performed using a BD Biosciences FACS DiVa High-Speed Cell Sorter (San Diego, CA) with 350 nm, 488 nm, and 633 nm lasers. Anti-CD31, anti-CD73, and anti-Stro-1 were conjugated to Alexa Fluor 488, anti-CD45 to FITC, anti-CD90 to PE, anti-CD105 to Alexa Fluor 647, and to the appropriate isotype controls (all from BD Pharmingen Inc., San Diego, CA except anti-Stro-1, which was obtained from Invitrogen, Carlsbad, CA). Analysis was performed on a FACS Aria III BD (Becton Dickinson, Franklin Lakes, NJ), and the data were analyzed using FlowJo software (Tree Star, San Carlos, CA). Propidium iodide was used to exclude dead cells, and percentages of positively stained-cells were calculated by subtracting the value of isotype controls. Cells were negatively selected for CD31 and CD45 and positively selected for Stro-1, CD73 and CD105 binding. Cells were collected in 1 mL DMEM supplemented with 10% FBS and cultured and passaged to P3 for further studies.
Adipocyte induction
For adipogenic induction, BMSCs cultured in 6-well plates were treated with adipogenic induction media (MEM plus 10% FBS, supplemented with 10 μM dexamethasone, 0.5 mM 3-isobutyl-1-methylxanthine, 10 μg/ml insulin, and 50 μM indomethacin) for 7-9 days, following which adipocyte induction was assessed by Oil Red O (ORO) staining. The control (ad libitum) and MFR BMSCs exposed to adipocyte induction media were fixed in 4% paraformaldehyde for 15 min and washed with 1× PBS. 300 μl of ORO was added to the slides and kept for 30 min at RT. The slides were washed with 1× PBS and allowed to react with hematoxylin and then mounted with aqueous mounting medium.
Myocytes induction
Myogenic differentiation was induced by addition of 10 ng/mL transforming growth factor (TGF)-β, 1 μg/mL insulin, 0.55 μg/mL transferrin and 670 ng/mL selenium (Invitrogen, Carlsbad, CA) for 6 days, following which cells were immunostained for α-smooth muscle actin (SMA).
Osteogenic induction (Alizarin red s staining)
Osteogenic differentiation was accomplished by culturing cells in MEM, supplemented with 5% FBS, 100 nM dexamethasone, 10 mM b-glycerophosphate and 50μg/mL ascorbic acid for 10-14 days, as described 18. Formalin-fixed cells were stained for calcium phosphate with alizarin red S.
Western blotting analysis
Cells from control and MFR conditions were lysed using cell lysis buffer (Pierce Protein Research Products, Rockford, IL, Cat. No.: 89900) containing protease inhibitors. Samples were homogenized, and the resulting lysates were centrifuged to obtain clear supernatant. Protein concentration was determined by BCA protein assay (Pierce BCA Protein Assay Kit, Rockford, IL, prod # 23225). Fifty microgram of protein lysate from each sample was resolved by SDS-PAGE gel electrophoresis and data analyzed, following our previously described methods 11, 19. The specific primary antibodies used included PPARγ (H-100, Cat. No.: sc-7196, 1:200), adipocyte differentiation-related protein (ADRP) (H-80, (Cat. No.: sc-32888, 1:150), CCAAT/enhancer binding protein α (C/EBPα) (14AA, Cat. No.: sc-61, 1:200), β-catenin (E-5, Cat. No.: sc-7963, 1:250), lymphoid enhancer-binding factor 1 (LEF1) (H-70, Cat. No.: sc-28687, 1:250), All of the above primary antibodies were purchased from Santa Cruz Biotechnology, Inc, Santa Cruz, CA. Mouse stro-1 (1:500) (eBioscience, Cat. No.: 14-6688-80) and goat anti-Rat endoglin/CD105 antigen affinity-purified polyclonal antibody (Novus, Cat. No.: AF6440) (1:1000) were purchased from their respective vendors.
RNA isolation and quantitative real-time PCR
Total RNA was isolated from cultured BMSCs using Qiagen RNAeasy plus mini kit (Qiagen Applied Biosystems, Foster City, CA, Cat. No.: 74134); the extracted RNA was quantitated by absorbance using a nanodrop spectrophotometer (Nanodrop Instruments, Wilmington, DE) and processed for q-RT-PCR according to our previously described methods 12, 15. All PCR primers were obtained from Sigma-Aldrich (St. Louis, MO), which included 18S: 5’- GGACAGGATTGACAGATTGATAGC -3’ (forward) and 5’- GGTTATCGGAATTAACCAGACAA -3’ (reverse); ADRP: 5’- ATTCTGGACCGTGCCGATT -3’ (forward) and 5’- CTGCTACTGATGCCATTTTTCCT -3’ (reverse); SREBP1: 5’- GTGGTCTTCCAGAGGCTGAG -3’ (forward) and 5’- GGGTGAGAGCCTTGAGACAG -3’ (reverse); C/EBPα: 5’- AGTTGACCAGTGACAATGACCG -3’ (forward) and 5’- TCAGGCAGCTGGCGGAAGAT -3’ (reverse); PPARγ: 5’- CCAAGTGACTCTGCTCAAGTATGG -3’ (forward) and 5’- CATGAATCCTTGTCCCTCTGATATG -3’ (reverse); LPL: 5’- TGAAGACACAGCTGAGGACA -3’ (forward) and 5’- GATCACCACAAAGGTTTTGC -3’ (reverse); LRP5: 5’- TGTGAACACCGAGATCAATG -3’ (forward) and 5’- CCATCTAGGTTGGCACATTC -3’ (reverse); LRP6: 5’- CCAAGTGACTCTGCTCAAGTATGG -3’ (forward) and 5’- CATGAATCCTTGTCCCTCTGATATG -3’ (reverse); β-catenin: 5’- CCGTTCGCCTTCATTATGGA -3’ (forward) and 5’- GGGCAAGGTTTCGGATCAAT -3’ (reverse); GSK-3β: 5’- CAGCAGCCTTCAGCTTTTGG -3’ (forward) and 5’- CCGGAACATAGTCCAGCACCAG -3’ (reverse); LEF1: 5’- GAGCACGAACAGAGAAAGGAACA -3’ (forward) and 5’- TTGATAGCTGCGCTCTCCTTTA -3’ (reverse); ZNF521: 5’- CAACGTGTGCTCTCGAACCTT -3’ (forward) and 5’- GCCTAGGTGGGTCTGCATATG -3’ (reverse) and RUNX2: 5’- GCCGGGAATGATGAGAACTA -3’ (forward) and 5’- GGACCGTCCACTGTCACTTT -3’ (reverse). All RT-qPCRs were performed in triplicate on an ABI StepOnePlus System. The relative mRNA levels were calculated using the 2−ΔΔCT method, with β-actin mRNA as a normalizer. For miRNA detection, all primers were designed as described previously 20.
Immunohistochemistry
Slides with BMSCs from control and experimental conditions were fixed with 4% paraformaldehyde and processed for immunohistochemistry for mouse α-SMA (Sigma-Aldrich, Cat. No.: A2547, 1:100), mouse Stro-1 and Goat Anti-Rat Endoglin/CD105 (1:100), rabbit ZNP521 (Santa Cruz, Cat. No.: sc-84808, 1:50) and mouse RUNX2 (Santa Cruz, Cat. No.: sc-390351, 1:50), following previously described methods 11.
Cell proliferation assay
Cell proliferation was assessed using tetrazolium dye assay following manufacturer's protocol [CellTiter 96® Non-Radioactive Cell Proliferation Assay (MTT) in 96-well plate (5×10³ cells/well), Catalog # G4000, Promega, Madison, WI] and by determining thymidine incorporation. For thymidine incorporation assay, BMSCs were grown in MEM with 10% FBS in 6-well (5×10⁴ cells/well) plates; at 80% confluence, 1μl of 3H-thymidine [methyl-3H] (PerkinElmer, NET027001MC) was added to each well for 24h, following which radioactivity in the DNA recovered from the cells was determined using a scintillation beta-counter. The counts were normalized per mg protein.
Statistical analysis
Statistical analysis performed using a 2-tailed Student's t-test for comparison of the two groups (α = 0.05) and Bonferroni post hoc correction. Values are expressed as mean ± SEM.
RESULTS
Characterization of BMSCs and their pluripotent potential
On PND21, MFR pups demonstrated lower weights than control pups (MFR pups: males = 47.5 ± 1.6 g and females = 46.2 ± 1.8 g vs. control pups: males = 54.5.0 ± 3.5 g and females = 53.2 ± 2.5 g; p < 0.05). As described, above, BMSCs were isolated and subjected to FACS analysis to determine specific cell surface markers. More than 97% of cells stained negative for CD31 and CD45; >50% stained positive for CD73 and >95% stained positive for CD90; only 5-7% stained positive for CD105 and Stro-1 (Figure 1A). However, Western blotting and immunostaining provided clear evidence for the abundant positivity for these antigens (Figure 1A), indicating technical reasons for the ineffectiveness of FACS analysis in detecting CD105 and Stro-1 by the antibodies used by us. Furthermore, using well-described methods 18, 21, pluripotent potential of the control BMSCs was confirmed by their induction to adipocytes (positive ORO staining), myocytes (positive α-SMA staining), and osteocytes (positive Alizarin red S staining) (Figure 1B). Taken together, these and the FACS data confirm the nonendothelial MSC nature of the isolated cells.
Figure 1.
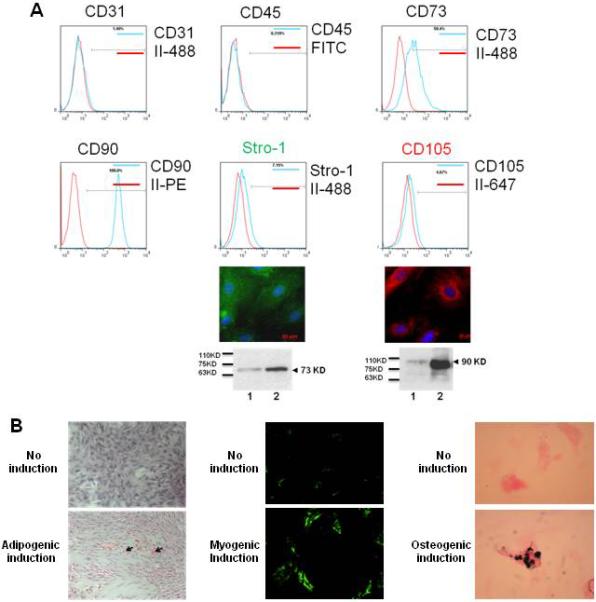
Characterization of bone marrow-derived mesenchymal stem cells (BMSCs).
Effect of MFR on the expression of key adipogenic mRNA and protein levels by BMSCs
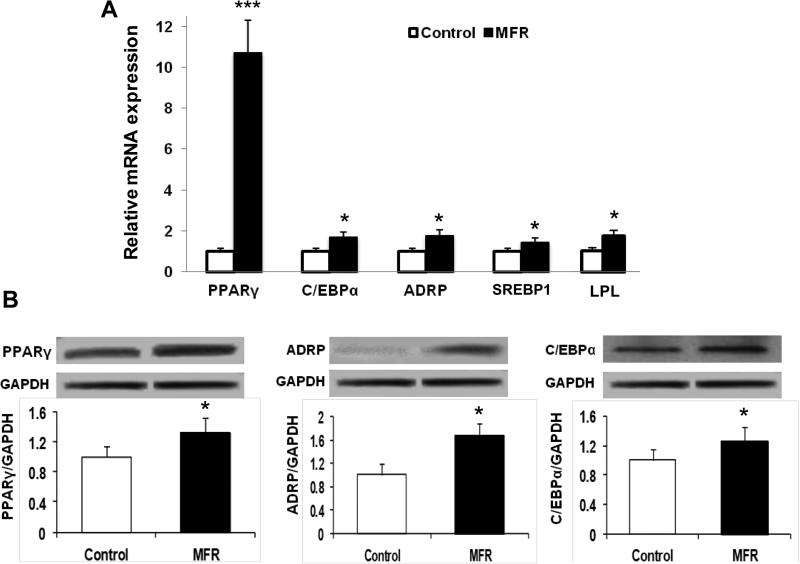
Compared to control BMSCs, mRNA expression of key adipogenic genes was up-regulated in MFR BMSCs [PPARγ (10.2-fold) and C/EBPα (1.6-fold)], which was accompanied by the up-regulation of their downstream target genes [ADRP (1.7-fold), sterol regulatory element-binding protein 1 (SREBP1) (1.4-fold), and lipoprotein lipase (LPL) (1.7-fold), Figure 2A). In line with these data, protein levels of PPARγ (1.3-fold), ADRP (1.6-fold), and C/EBPα (1.3-fold) were up-regulated in MFR BMSCs compared to control cells (Figure 2B).
Figure 2.
Effect of maternal food restriction (MFR) on the expression of key adipogenic mRNAs in bone marrow-derived mesenchymal stem cells (BMSCs) of the resultant offspring. (A) By qRT-PCR, PPARγ and C/EBPα, and their downstream target genes ADRP, SREBP1, and LPL mRNA were up-regulated in MFR BMSCs compared to control cells. (B) Levels of adipogenic protein in BMSCs of the MFR offspring. By Western blot analysis, the protein levels of PPARγ, ADRP, and C/EBPα were up-regulated in MFR BMSCs compared to control cells (N=3, * p <.05, ***p<0.01 vs control).
Effect of MFR on the expression of key Wnt mRNA and protein levels in BMSCs
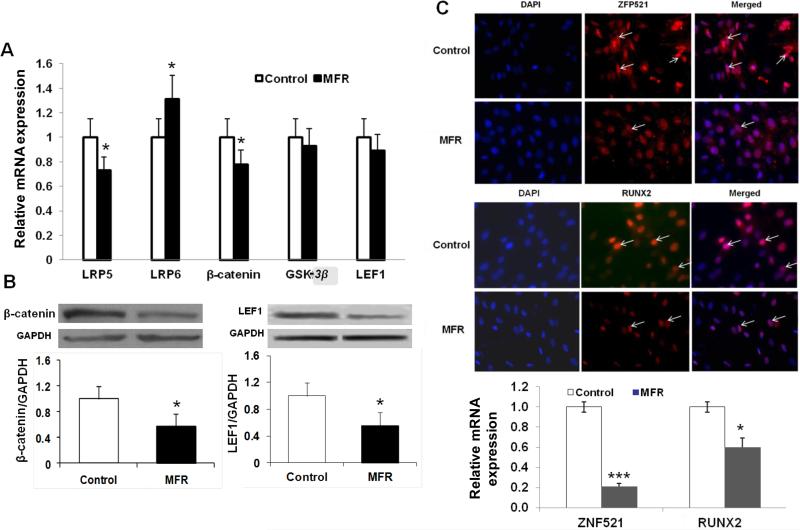
Next, we determined the effect of MFR on several key intermediates of Wnt signaling, which is known to be antagonistic to the adipogenic program 22-24; most of the examined intermediates were down-regulated [LRP5 (0.75-fold), β-catenin (0.78-fold), GSK-3β (0.95-fold) and LEF1 (0.89-fold)], though this did not reach statistical significance for GSK-3β and LEF-1]; in contrast LRP6 (1.35-fold) was significantly up-regulated (Figure 3A). In line with the mRNA data indicating the down-regulation of Wnt signaling, the protein levels of β-catenin and LEF1 levels were significantly reduced (0.56-fold and 0.48-fold, respectively) in MFR offspring BMSCs compared to controls (Figure 3B). We next examined the protein levels of ZFP521 25 and RUNX2 26-28, both known strong repressors of adipogenesis. By immunostaining, both ZFP521 and RUNX2 had weaker staining in BMSCs derived from the MFR group compared to the control group. Consistent with this, mRNA expression of both ZFP521 and RUNX2 was reduced in the MFR group, supporting overall enhanced adipogenesis and suppressed myogenesis in MFR BMSCs (Figure 3C).
Figure 3.
Effect of maternal food restriction (MFR) on the expression of key adipogenic mRNAs in bone marrow-derived mesenchymal stem cells (BMSCs) of the resultant offspring. (A) The mRNA levels of LRP5, β-catenin, GSK3β and LEF1 showed downward trend, though it didn't reach statistical significance for GSK3β and LEF-1; in contrast the mRNA levels of LRP6 were significantly upregulated. (B) Levels of key Wnt proteins in BMSCs of the MFR offspring. The protein levels of β-catenin and LEF1 levels were down-regulated in MFR BMSCs compared to controls (N=3, *p<0.05 vs. control). (C) Expression of ZFP521 and RUNX2 proteins and mRNAs in bone marrow-derived mesenchymal stem cells (BMSCs) of the maternal food restricted (MFR) offspring. White arrows indicate the specific signals. ZFP521 staining was strong, whereas, RUNX2 staining was weaker in BMSCs derived from the MFR group compared to the control group. Consistently, mRNA expression of ZEP521 and RUNX2 show significantly reduction in BMSCs derived from the MFR group compared to the control group. (N=3, *p<0.05, ***p<0.01 vs. control).
Effect of MFR on BMSC Proliferation
Since, in addition to adipocyte differentiation and hypertrophy, increase in cell number is a key component in the pathogenesis of obesity, we next determined the effect of MFR on BMSC proliferation. Compared with control BMSCs, MFR BMSCs demonstrated significantly increased cell proliferation, as determined by 3H-thymidine incorporation, which increased by 38% and MTT assay, which indicated a 29% increase (Figure 4).
Figure 4.
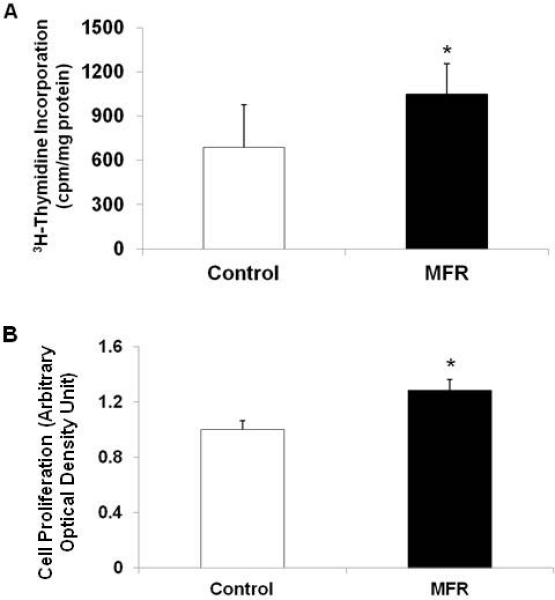
Effect of maternal food restriction (MFR) on cell proliferation in bone marrow-derived mesenchymal stem cells (BMSCs) of the resultant offspring. Compared with control BMSCs, MFR BMSCs demonstrated significantly increased cell proliferation, as determined by 3H- thymidine incorporation (A) and MTT assays (B) (N=5, *p<0.05 vs. control).
Effect of MFR on the adipogenic differentiation potential of BMSCs
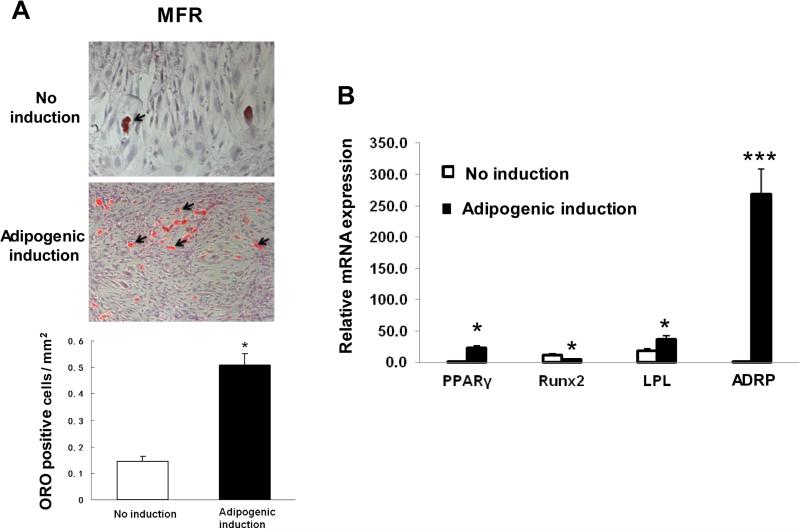
After establishing that the BMSCs of the MFR offspring demonstrate enhanced adipogenic programming (up-regulation of the adipogenic genes and down-regulation of the Wnt signaling genes) under basal conditions, we next examined their further adipogenic potential with appropriate adipogenic stimuli under in vitro conditions. On treatment with adipogenic induction media, compared with no induction condition, MFR BMSCs showed a 5-fold increase in adipogenic potential, as determined by the ratio of the number of differentiated adipocytes (positive ORO staining)/total cell number per mm2 (Figure 5A).
Figure 5.
Effect of maternal food restriction (MFR) on the adipogenic differentiation potential of bone marrow-derived mesenchymal stem cells (BMSCs). (A) Compared with the control BMSCs, MFR BMSCs showed 5-fold increase in adipogenic potential, as determined by the ratio of the number of differentiated adipocytes (positive ORO staining)/total cell number per mm2. (B) Although at baseline compared to the controls, the mRNA levels of key adipogenic markers were already higher, following adipogenic induction, the levels of adipogenic genes PPARγ (29-fold), LPL (36-fold) and ADRP (267-fold) increased significantly in the MFR group vs. the control group, whereas, in contrast, RUNX2 mRNA expression was 4-fold lower in MFR BMSCs compared to controls (N=3, *p<0.05, ***p<0.01 vs. control).
Next, by q-RT-PCR, the expression of key adipogenic markers was determined. Although, at baseline compared to the controls, the mRNA levels of key adipogenic markers were already significantly higher, as shown in Figure 2A, following adipogenic induction, the levels of PPARγ and the related adipogenic genes, LPL and ADRP showed even further significant increases in the MFR group; PPARγ expression increased by 29-fold, LPL by 2-fold, and ADRP by 267-fold; in contrast, the RUNX2 mRNA expression decreased 4-fold in MFR BMSCs vs. controls (Figure 5B).
Expression of key adipogenic microRNAs in BMSCs
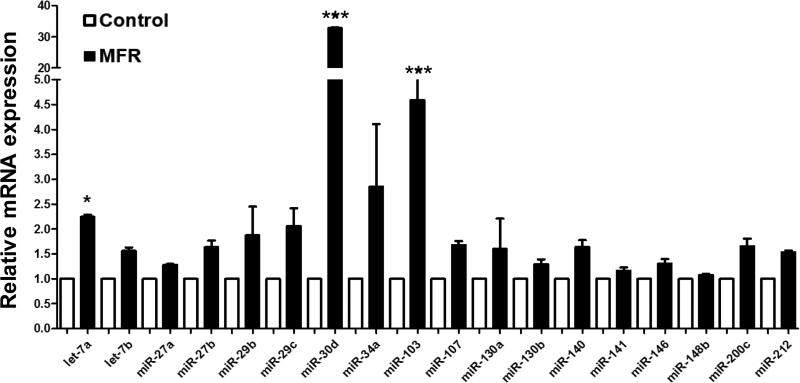
Since miRNAs play a central role in adipocyte differentiation 29, several selected key adipogenic miRNAs were examined by qRT-PCR. As shown in Figure 6, in general, the expression of a number of miRNAs promoting adipogenesis was increased in the MFR BMSCs; in particular, miR-30d, which suppresses RUNX2 and is known to be a key player in determining mesenchymal cell lineage, increased 33-fold; let-7a and miR103, two other important regulator of adipogenesis, increased 2.2-fold and 4.6-fold, respectively. However, the increases in miR-27 and miR-130, which are also known to target PPARγ, did not reach statistical significance (Figure 6), indicating the activation of only selective adipogenic pathways in IUGR following MFR.
Figure 6.
Effect of maternal food restriction (MFR) on the expression of key adipogenic microRNAs in bone marrow-derived mesenchymal stem cells (BMSCs) of the resultant offspring. The expression of adipogenic miRNAs, let-7a (2.2-fold), miR-103 (4.6-fold), and miR-30d (33-fold), was increased in the MFR BMSCs; however, the increases in miR-27 and miR-130, which are also known to be adipogenic did not reach statistical significance (N=3, *p<0.05, ***p<0.01 vs. control).
DISCUSSION
Characterization of BMSCs by cell surface marker staining (negative staining for CD31 and CD45, but positive staining for CD73, CD90, CD105, and Stro-1) and by demonstration of their pluripotent potential (induction to adipocytes, myocytes and osteocytes) established their non-hematopoietic MSC nature. The up-regulation of adipogenic markers at both mRNA (PPARγ, C/EBPα, ADRP, SREBP1, and LPL) and protein (PPARγ, C/EBPα, and ADRP) levels pointed to an enhanced adipogenic differentiation of the MFR BMSCs even under basal conditions. Their enhanced adipogenic potential was further confirmed by exposing to adipogenic induction media. Furthermore, in contrast to the up-regulation of adipogenesis programming, Wnt signaling genes, at both mRNA (LRP5 and β-catenin) and protein (β-catenin and LEF1) levels were down-regulated in the MFR BMSCs compared to controls. In addition, in the MFR BMSCs, both ZFP521 and RUNX2 (negative regulators of adipogenesis) were down-regulated. In line with these data, miRNA profile of BMSCs also showed significant changes in expression profile favoring adipogenesis. A 33-fold increase in adipogenic miR-30d, 4.6–fold increase in miR-103, and 2.2-fold increase in let-7a, suppressed myogenic RUNX2, which targets PPARγ, indicated up-regulated adiopogenic transcription programming of the MFR BMCSs. These data support the notion that BMSCs of the MFR offspring demonstrate suppressed Wnt signaling, favoring adipogenesis, providing a novel mechanistic explanation for the predisposition to obesity and metabolic phenotype seen in IUGR infants. Thus our both in vitro and in vivo data strongly suggest that MFR offspring BMSCs are capable of readily differentiating to adipocytes under suitable condition, via up-regulation of the adiopogenic, but suppression of the myogenic genes, supporting our hypothesis that MFR enhances adipogenesis of BMSCs, likely contributing to offspring obesity and the associated metabolic phenotype.
Though extensively researched, the molecular mechanisms leading to obesity and metabolic phenotype remain poorly understood. It is conceivable that an individual's obesogenic molecular profile plays an important contributory role. For example, in addition to altered glucocorticoid signaling and chromatin remodeling, IUGR fetuses have been shown to display enhanced adipogenic programming of adipocytes, all of which presumably contribute to an increased risk for obesity and metabolic syndrome 30, 31. This is in line with the concept of “fetal origins of later life diseases”, i.e., a stimulus occurring at a critical period during development has a long lasting effect on individual's health. Of note both excessive and low birth weights are associated with later obesity and metabolic syndrome, leading to an apparent paradox for predisposition to these conditions at both ends of the birth weight spectrum. For the present work, we rationalized that determining the molecular programming of BMSCs in IUGR infants, a group that is known to be at a greater risk of childhood obesity and metabolic syndrome, can provide fundamental insights to the mechanisms underlying these conditions.
Our central premise was that the intrauterine nutritional stress leads to persistent changes in cellular and gene expression in cells critical for determining obesogenic and metabolic phenotype seen in affected infants. Mechanistic studies on alterations in the molecular programming of adipocytes in IUGR offspring are limited. Enhanced adipogenic programming of the adipocytic precursors in adipose tissue following exposures to both over- and under-nutrition during development has been reported 32, 33; however, similar effects in BMSCs have not been previously described. Though it is now clear that following developmental nutritional restriction, both non-marrow and marrow adipocytic precursors are more robustly programmed towards an adipogenic phenotype, the significance of this finding remains somewhat unclear. On the one hand, in line with our hypothesis, it might represent an obesogenic state, while on the other hand, by conferring increased expandability of adipose storage sites in the face of excess dietary intake, it might represent a protective adaptation 34, 35. The former is likely to a more plausible explanation since the rat model of MFR during pregnancy used by us is well documented to be associated with offspring obesity and metabolic syndrome 13-15.
Potential limitations of our study need to be noted. The nutrient challenge used by us is only one of the several potential factors that could result in IUGR; therefore, our data might not be applicable to IUGR that is not due to nutrient insufficiency. In fact, even nutrient insufficiency in an IUGR setting could result under a variety of circumstances, e.g., insufficiency of a specific dietary nutrient such as protein rather than the global caloric restriction, as used in the study, limiting the generalizability of our findings to all IUGR infants. In rat models of IUGR, following either maternal protein restriction or utero placental insufficiency, increased visceral adiposity and expression of adipogenic genes in visceral adipose tissue have been demonstrated 32, 33. A previous study utilizing protein deficiency during pregnancy in a rat model found delayed skeletal maturity profile of MSCs 36, perhaps in line with the suppressed Wnt signaling found in our study. Furthermore, response of BMSCs to nutrient stress might be different compared to stem cells from other sites. For example, adult stem cells respond to increased levels of free fatty acids in a site-specific manner 37.
Our data showing an enhanced adiopogenic, but suppressed Wnt signaling in BMSCs lends credence to a generalized altered differentiation programming in IUGR infants. However, since we did not analyze BMSCs immediately after birth, i.e., on PND1, it is possible that molecular programming at that stage might have be different from the one detected on PND21. Moreover, since postnatal diet is a strong determinant of offspring obesity, the molecular and functional profiles of BMSCs might have been different if a different postnatal feeding regimen had been used. This is particularly relevant since the rapidity of postnatal catch-up growth markedly increases the risk of developing adult obesity and metabolic syndrome 38. Our study suggests that in addition to a number of previously identified hormonal and molecular factors, including transcription factors, miRNAs, and epigenetic mechanisms that determine catch-up growth, an altered BMSC programming might be an additional contributing factor to this risk. Though all of the above-enumerated considerations require further explorations, our study provides novel data, suggesting a generalized adipogenic profile of MSCs in the setting of intrauterine nutrition restriction, which is likely to be highly relevant not only to the development of obesity, but also to the mechanisms underlying the associated metabolic phenotype and altered injury-repair seen in the affected offspring.
CONCLUSION
In summary, BMSCs isolated from rat offspring subjected to global nutritional restriction during the later-half of pregnancy showed markedly enhanced adipogenic, but suppressed Wnt signaling profile, along with an increase in cell proliferation. Taken together, this molecular and functional profile of MFR BMSCs suggests a new possible cellular/mechanistic link between the intrauterine nutritional stress and the later offspring obesity and metabolic syndrome, providing novel potential predictive and therapeutic targets against these conditions in the IUGR offspring.
ACKNOWLEDGEMENTS
Funding: This research was funded by grants from the NIH (HD058948, HL107118, HD071731, HD127237) and the TRDRP (17RT-0170, and 23RT-0018). The authors had full access to all of the data and take responsibility for the integrity of the data and the accuracy of analysis.
Footnotes
Authors’ contributions: VKR conceived this work. MG, SA, RS, and JL carried out the experiments. VKR, MG, RS, MI analyzed the data. VKR, MG, and SA drafted the paper. All authors have the approval of the submitted work.
CONFLICT OF INTEREST
The authors declare no conflict of interest.
Reference List
- 1.Garver WS, Newman SB, Gonzales-Pacheco DM, Castillo JJ, Jelinek D, Heidenreich RA, et al. The genetics of childhood obesity and interaction with dietary macronutrients. Genes Nutr. 2013;8(3):271–287. doi: 10.1007/s12263-013-0339-5. [DOI] [PMC free article] [PubMed] [Google Scholar]
- 2.Harding JE. The nutritional basis of the fetal origins of adult disease. Int J Epidemiol. 2001;30(1):15–23. doi: 10.1093/ije/30.1.15. [DOI] [PubMed] [Google Scholar]
- 3.Barker DJ, Osmond C. Infant mortality, childhood nutrition, and ischaemic heart disease in England and Wales. Lancet. 1986;1(8489):1077–1081. doi: 10.1016/s0140-6736(86)91340-1. [DOI] [PubMed] [Google Scholar]
- 4.Hales CN, Barker DJ. Type 2 (non-insulin-dependent) diabetes mellitus: the thrifty phenotype hypothesis. Diabetologia. 1992;35(7):595–601. doi: 10.1007/BF00400248. [DOI] [PubMed] [Google Scholar]
- 5.Tarantal AF, Berglund L. Obesity and lifespan health--importance of the fetal environment. Nutrients. 2014;6(4):1725–1736. doi: 10.3390/nu6041725. [DOI] [PMC free article] [PubMed] [Google Scholar]
- 6.Martin RJ, Hausman GJ, Hausman DB. Regulation of adipose cell development in utero. Proc Soc Exp Biol Med. 1998;219(3):200–210. doi: 10.3181/00379727-219-44333. [DOI] [PubMed] [Google Scholar]
- 7.Nombela-Arrieta C, Ritz J, Silberstein LE. The elusive nature and function of mesenchymal stem cells. Nat Rev Mol Cell Biol. 2011;12(2):126–131. doi: 10.1038/nrm3049. [DOI] [PMC free article] [PubMed] [Google Scholar]
- 8.Lowe CE, O'Rahilly S, Rochford JJ. Adipogenesis at a glance. J Cell Sci. 2011;124(Pt 16):2681–2686. doi: 10.1242/jcs.079699. [DOI] [PubMed] [Google Scholar]
- 9.Pittenger MF, Mackay AM, Beck SC, Jaiswal RK, Douglas R, Mosca JD, et al. Multilineage potential of adult human mesenchymal stem cells. Science. 1999;284(5411):143–147. doi: 10.1126/science.284.5411.143. [DOI] [PubMed] [Google Scholar]
- 10.Tontonoz P, Hu E, Spiegelman BM. Regulation of adipocyte gene expression and differentiation by peroxisome proliferator activated receptor gamma. Curr Opin Genet Dev. 1995;5(5):571–576. doi: 10.1016/0959-437x(95)80025-5. [DOI] [PubMed] [Google Scholar]
- 11.Paek DS, Sakurai R, Saraswat A, Li Y, Khorram O, Torday JS, et al. Metyrapone alleviates deleterious effects of maternal food restriction on lung development and growth of rat offspring. Reprod Sci. 2015;22(2):207–222. doi: 10.1177/1933719114537712. [DOI] [PMC free article] [PubMed] [Google Scholar]
- 12.Rehan VK, Li Y, Corral J, Saraswat A, Husain S, Dhar A, et al. Metyrapone blocks maternal food restriction-induced changes in female rat offspring lung development. Reprod Sci. 2014;21(4):517–525. doi: 10.1177/1933719113503404. [DOI] [PMC free article] [PubMed] [Google Scholar]
- 13.Desai M, Gayle D, Babu J, Ross MG. Programmed obesity in intrauterine growth-restricted newborns: modulation by newborn nutrition. Am J Physiol Regul Integr Comp Physiol. 2005;288(1):R91–R96. doi: 10.1152/ajpregu.00340.2004. [DOI] [PubMed] [Google Scholar]
- 14.Desai M, Gayle D, Babu J, Ross MG. The timing of nutrient restriction during rat pregnancy/lactation alters metabolic syndrome phenotype. Am J Obstet Gynecol. 2007;196(6):555–557. doi: 10.1016/j.ajog.2006.11.036. [DOI] [PMC free article] [PubMed] [Google Scholar]
- 15.Karadag A, Sakurai R, Wang Y, Guo P, Desai M, Ross MG, et al. Effect of maternal food restriction on fetal rat lung lipid differentiation program. Pediatr Pulmonol. 2009;44(7):635–644. doi: 10.1002/ppul.21030. [DOI] [PMC free article] [PubMed] [Google Scholar]
- 16.Tseng FW, Tsai MJ, Yu LY, Fu YS, Huang WC, Cheng H. Comparative effects of bone marrow mesenchymal stem cells on lipopolysaccharide-induced microglial activation. Oxid Med Cell Longev. 2013;2013:234179. doi: 10.1155/2013/234179. [DOI] [PMC free article] [PubMed] [Google Scholar]
- 17.Miranda SC, Silva GA, Hell RC, Martins MD, Alves JB, Goes AM. Three-dimensional culture of rat BMMSCs in a porous chitosan-gelatin scaffold: A promising association for bone tissue engineering in oral reconstruction. Arch Oral Biol. 2011;56(1):1–15. doi: 10.1016/j.archoralbio.2010.08.018. [DOI] [PubMed] [Google Scholar]
- 18.Hennrick KT, Keeton AG, Nanua S, Kijek TG, Goldsmith AM, Sajjan US, et al. Lung cells from neonates show a mesenchymal stem cell phenotype. Am J Respir Crit Care Med. 2007;175(11):1158–1164. doi: 10.1164/rccm.200607-941OC. [DOI] [PubMed] [Google Scholar]
- 19.Morales E, Sakurai R, Husain S, Paek D, Gong M, Ibe B, et al. Nebulized PPARgamma agonists: a novel approach to augment neonatal lung maturation and injury repair in rats. Pediatr Res. 2014;75(5):631–640. doi: 10.1038/pr.2014.8. [DOI] [PMC free article] [PubMed] [Google Scholar]
- 20.Sharbati-Tehrani S, Kutz-Lohroff B, Bergbauer R, Scholven J, Einspanier R. miR-Q: a novel quantitative RT-PCR approach for the expression profiling of small RNA molecules such as miRNAs in a complex sample. BMC Mol Biol. 2008;9:34. doi: 10.1186/1471-2199-9-34. [DOI] [PMC free article] [PubMed] [Google Scholar]
- 21.Pittenger MF, Mackay AM, Beck SC, Jaiswal RK, Douglas R, Mosca JD, et al. Multilineage potential of adult human mesenchymal stem cells. Science. 1999;284(5411):143–147. doi: 10.1126/science.284.5411.143. [DOI] [PubMed] [Google Scholar]
- 22.Bilkovski R, Schulte DM, Oberhauser F, Gomolka M, Udelhoven M, Hettich MM, et al. Role of WNT-5a in the determination of human mesenchymal stem cells into preadipocytes. J Biol Chem. 2010;285(9):6170–6178. doi: 10.1074/jbc.M109.054338. [DOI] [PMC free article] [PubMed] [Google Scholar]
- 23.Christodoulides C, Lagathu C, Sethi JK, Vidal-Puig A. Adipogenesis and WNT signalling. Trends Endocrinol Metab. 2009;20(1):16–24. doi: 10.1016/j.tem.2008.09.002. [DOI] [PMC free article] [PubMed] [Google Scholar]
- 24.Laudes M. Role of WNT signalling in the determination of human mesenchymal stem cells into preadipocytes. J Mol Endocrinol. 2011;46(2):R65–R72. doi: 10.1530/JME-10-0169. [DOI] [PubMed] [Google Scholar]
- 25.Addison WN, Fu MM, Yang HX, Lin Z, Nagano K, Gori F, et al. Direct transcriptional repression of Zfp423 by Zfp521 mediates a bone morphogenic protein-dependent osteoblast versus adipocyte lineage commitment switch. Mol Cell Biol. 2014;34(16):3076–3085. doi: 10.1128/MCB.00185-14. [DOI] [PMC free article] [PubMed] [Google Scholar]
- 26.Bialek P, Kern B, Yang X, Schrock M, Sosic D, Hong N, et al. A twist code determines the onset of osteoblast differentiation. Dev Cell. 2004;6(3):423–435. doi: 10.1016/s1534-5807(04)00058-9. [DOI] [PubMed] [Google Scholar]
- 27.Muruganandan S, Roman AA, Sinal CJ. Adipocyte differentiation of bone marrow-derived mesenchymal stem cells: cross talk with the osteoblastogenic program. Cell Mol Life Sci. 2009;66(2):236–253. doi: 10.1007/s00018-008-8429-z. [DOI] [PMC free article] [PubMed] [Google Scholar]
- 28.Kobayashi H, Gao Y, Ueta C, Yamaguchi A, Komori T. Multilineage differentiation of Cbfa1-deficient calvarial cells in vitro. Biochem Biophys Res Commun. 2000;273(2):630–636. doi: 10.1006/bbrc.2000.2981. [DOI] [PubMed] [Google Scholar]
- 29.Kang T, Lu W, Xu W, Anderson L, Bacanamwo M, Thompson W, et al. MicroRNA-27 (miR-27) targets prohibitin and impairs adipocyte differentiation and mitochondrial function in human adipose-derived stem cells. J Biol Chem. 2013;288(48):34394–34402. doi: 10.1074/jbc.M113.514372. [DOI] [PMC free article] [PubMed] [Google Scholar]
- 30.Gnanalingham MG, Mostyn A, Symonds ME, Stephenson T. Ontogeny and nutritional programming of adiposity in sheep: potential role of glucocorticoid action and uncoupling protein-2. Am J Physiol Regul Integr Comp Physiol. 2005;289(5):R1407–R1415. doi: 10.1152/ajpregu.00375.2005. [DOI] [PubMed] [Google Scholar]
- 31.Tobi EW, Lumey LH, Talens RP, Kremer D, Putter H, Stein AD, et al. DNA methylation differences after exposure to prenatal famine are common and timing- and sex-specific. Hum Mol Genet. 2009;18(21):4046–4053. doi: 10.1093/hmg/ddp353. [DOI] [PMC free article] [PubMed] [Google Scholar]
- 32.Desai M, Guang H, Ferelli M, Kallichanda N, Lane RH. Programmed upregulation of adipogenic transcription factors in intrauterine growth-restricted offspring. Reprod Sci. 2008;15(8):785–796. doi: 10.1177/1933719108318597. [DOI] [PMC free article] [PubMed] [Google Scholar]
- 33.Joss-Moore LA, Wang Y, Campbell MS, Moore B, Yu X, Callaway CW, et al. Uteroplacental insufficiency increases visceral adiposity and visceral adipose PPARgamma2 expression in male rat offspring prior to the onset of obesity. Early Hum Dev. 2010;86(3):179–185. doi: 10.1016/j.earlhumdev.2010.02.006. [DOI] [PMC free article] [PubMed] [Google Scholar]
- 34.Slawik M, Vidal-Puig AJ. Adipose tissue expandability and the metabolic syndrome. Genes Nutr. 2007;2(1):41–45. doi: 10.1007/s12263-007-0014-9. [DOI] [PMC free article] [PubMed] [Google Scholar]
- 35.Bluher M. Adipose tissue dysfunction contributes to obesity related metabolic diseases. Best Pract Res Clin Endocrinol Metab. 2013;27(2):163–177. doi: 10.1016/j.beem.2013.02.005. [DOI] [PubMed] [Google Scholar]
- 36.Oreffo RO, Lashbrooke B, Roach HI, Clarke NM, Cooper C. Maternal protein deficiency affects mesenchymal stem cell activity in the developing offspring. Bone. 2003;33(1):100–107. doi: 10.1016/s8756-3282(03)00166-2. [DOI] [PubMed] [Google Scholar]
- 37.Wu CL, Diekman BO, Jain D, Guilak F. Diet-induced obesity alters the differentiation potential of stem cells isolated from bone marrow, adipose tissue and infrapatellar fat pad: the effects of free fatty acids. Int J Obes (Lond) 2013;37(8):1079–1087. doi: 10.1038/ijo.2012.171. [DOI] [PMC free article] [PubMed] [Google Scholar]
- 38.Nobili V, Alisi A, Panera N, Agostoni C. Low birth weight and catch-up-growth associated with metabolic syndrome: a ten year systematic review. Pediatr Endocrinol Rev. 2008;6(2):241–247. [PubMed] [Google Scholar]


