Abstract
Purpose
Netarsudil is a Rho kinase/norepinephrine transporter inhibitor currently in phase 3 clinical development for glaucoma treatment. We investigated the effects of its active metabolite, netarsudil-M1, on outflow facility (C), outflow hydrodynamics, and morphology of the conventional outflow pathway in enucleated human eyes.
Methods
Paired human eyes (n = 5) were perfused with either 0.3 μM netarsudil-M1 or vehicle solution at constant pressure (15 mm Hg). After 3 hours, fluorescent microspheres were added to perfusion media to trace the outflow patterns before perfusion-fixation. The percentage effective filtration length (PEFL) was calculated from the measured lengths of tracer distribution in the trabecular meshwork (TM), episcleral veins (ESVs), and along the inner wall (IW) of Schlemm's canal after global and confocal imaging. Morphologic changes along the trabecular outflow pathway were investigated by confocal, light, and electron microscopy.
Results
Perfusion with netarsudil-M1 significantly increased C when compared to baseline (51%, P < 0.01) and to paired controls (102%, P < 0.01), as well as significantly increased PEFL in both IW (P < 0.05) and ESVs (P < 0.01). In treated eyes, PEFL was significantly higher in ESVs than in the IW (P < 0.01) and was associated with increased cross-sectional area of ESVs (P < 0.01). Percentage effective filtration length in ESVs positively correlated with the percentage change in C (R2 = 0.58, P = 0.01). A significant increase in juxtacanalicular connective tissue (JCT) thickness (P < 0.05) was found in treated eyes compared to controls.
Conclusions
Netarsudil acutely increased C by expansion of the JCT and dilating the ESVs, which led to redistribution of aqueous outflow through a larger area of the IW and ESVs.
Keywords: trabecular meshwork, Schlemm's canal, Rho kinase inhibitor, netarsudil, effective filtration area, episcleral veins, ocular perfusion, morphology, light microscopy, confocal microscopy, transmission electron microscopy
Glaucoma is the second most common cause of blindness and the third most common cause of visual impairment worldwide.1 Primary open-angle glaucoma (POAG) is the major type of glaucoma, accounting for 74% of all glaucoma cases.2 The number of people affected by POAG in the United States was 2.71 million in 2011, which is expected to increase to 7.32 million by 2050.3,4
Elevated intraocular pressure (IOP), resulting from increased resistance to aqueous humor outflow, is a major risk factor for the development and progression of POAG.5,6 Previous multicenter clinical trials have demonstrated that reduction and tight control of IOP in patients can delay or prevent the progression of vision loss associated with POAG, including patients with IOP in the normal range at diagnosis.7–11 Therefore, reduction of IOP via medical, laser, or surgical means remains the sole clinical objective for the treatment of this blinding disease.12,13
Intraocular pressure is maintained within a normal range through a dynamic balance of aqueous humor production and outflow.14,15 Aqueous humor flows out of the eye via two pathways: the conventional (or trabecular) and the unconventional (or uveoscleral) outflow pathways. Although indirect estimation of uveoscleral outflow suggests that it may account for up to half of the aqueous outflow,16 direct measurements using a tracer show that under normal physiological conditions, the trabecular outflow pathway is the major outflow pathway, accounting for up to 90% of aqueous outflow in aged human eyes.17 In this pathway, aqueous humor drains from the anterior chamber sequentially through the uveal and corneoscleral meshwork beams, juxtacanalicular connective tissue (JCT) region, and inner wall (IW) endothelial cells of Schlemm's canal (SC) until finally entering the lumen of SC. From SC, aqueous humor drains into the collector channels, intrascleral plexus, episcleral veins (ESVs), and finally into the blood circulation.
In the trabecular meshwork (TM), experimental evidence suggests that most of the outflow resistance is generated in the JCT region6,18,19 and is modulated by the IW endothelial cells of SC and their pores.20 However, experiments involving the complete removal of the TM6,21 or precisely removing portions of sclera distal to the outer wall of SC22 suggest that one-third to one-half of the total outflow resistance is located distal to SC. The mechanisms that regulate the aqueous outflow resistance in each of these regions have not been fully investigated in normal eyes.
In glaucomatous eyes, elevation of IOP results from an abnormally increased resistance to outflow in the trabecular outflow pathway. The causes of this increased outflow resistance are also not fully understood, but current evidence supports an increase in the contractile tone and stiffness of the TM, changes in extracellular matrix composition, and/or a decrease in the conductance of the IW of SC.23–30
Although the TM represents a major site of pathology in glaucomatous eyes, it is not the primary target for most of the glaucoma drugs currently on the market.31 In fact, the most commonly prescribed drugs for decreasing IOP work by increasing uveoscleral outflow or suppressing aqueous humor production. Because current medications leave the diseased TM untreated, IOP often continues to rise over time owing to continuous deterioration and dysfunction of the TM.32 Therefore, there is a critical need to develop new pharmacologic agents that specifically target the trabecular outflow pathway. One class of such drugs that is far along in clinical development is the Rho kinase inhibitors. Rho kinase is a serine/threonine kinase, whose activity increases actomyosin contraction in smooth muscle–like cells, including the myofibroblast–like cells of the TM. Rho kinase inhibitors have been shown to relax the overall tone of the contractile cells in TM,29,33–36 alter tissue architecture in such a way to expand the JCT region29,37 and increase the permeability of cultured SC cell monolayers.29
The therapeutic potential of Rho kinase inhibitors was initially demonstrated in preclinical studies using the Rho kinase inhibitor Y-27632. In previous studies, Y-27632 has been found to increase outflow facility in enucleated rabbit,36 porcine,29 bovine,38 monkey,39 and human37 eyes. Increased outflow facility correlates positively with an increase in effective filtration areas, measured by percentage effective filtration length (PEFL),37–39 which is associated with an increased expansion in the JCT.29,37
Since the development of Y-27632, there have been seven different selective Rho kinase inhibitors tested in human clinical trials in the United States, Europe, and Japan. Among them, ripasudil has been recently approved in Japan as a treatment for glaucoma and ocular hypertension.40 Netarsudil (a.k.a., AR-13324) is the first of a new class of Rho kinase inhibitors that also has inhibitory activity against the norepinephrine transporter (NET). In a recent phase 2 clinical trial, once-daily dosing of netarsudil in patients with elevated IOP produced reductions in mean diurnal IOP ranging from 5.7 to 6.2 mm Hg.41 Netarsudil is currently being evaluated in phase 3 clinical trials.
There have been several preclinical studies aimed at defining the mechanisms by which netarsudil reduces IOP. At the cellular level, netarsudil has been shown to induce cell shape changes, loss of actin stress fibers, loss of focal adhesions, and changes in extracellular matrix composition of TM cells.42 In monkeys, topical ocular application of netarsudil decreases IOP by 25% and increases outflow facility by 53%.43 In a rabbit model, application of netarsudil eye drops induces a significant reduction of episcleral venous pressure (EVP), which accounted for 42% of the measured IOP reduction.44 Increased outflow facility in mice by netarsudil is accompanied by decreased IOP, increased tracer distribution in TM tissues, plus increased lumen area of SC and intrascleral vessels.45 However, the effects of netarsudil on the tissues of the human trabecular outflow pathway have not been previously studied.
Recently, a global imaging technique has been developed to visualize outflow patterns in the TM and ESVs of whole anterior eye segments.46 By combining this global imaging method with confocal microscopy to examine the fluorescent tracer distribution at the IW of SC, we are now able to investigate the effect of a drug on the areas of active outflow in three distinct locations (TM, IW, and ESVs) along the trabecular outflow pathway.
The goal of the current study was to test our hypothesis that an increase in outflow facility by netarsudil-M1, the active metabolite of netarsudil, is associated with morphologic changes along the trabecular outflow pathway that produce an increase in PEFL in the TM, IW of SC, and ESVs of human eyes.
Materials and Methods
Five pairs of enucleated human eyes from anonymous donors were obtained from the Miracles in Sight Eye Bank (Winston-Salem, NC, USA). The study protocol adhered to the Tenets of the Declaration of Helsinki. The mean donor age was 62 years (range, 32–74). The mean postmortem time to the beginning of perfusion was 19 hours (range, 7.5–28). There was no known history of ocular disease or surgery in four pairs of eyes; however, one pair of eyes presented with an intraocular lens (IOL). Each eye was examined under a dissecting microscope. Four of five pairs of eyes were confirmed to be grossly healthy, and one pair of eyes (without IOL) showed early signs of macular degeneration.
The perfusate was Dulbecco's phosphate-buffered saline (pH 7.3; GIBCO, Carlsbad, CA, USA) containing 5.5 mM D-glucose (collectively referred to as GPBS). FluoSpheres Carboxylate-Modified Microspheres (Ex/Em: 505/515, 200 nm; Molecular Probes, Eugene, OR, USA) at 0.002% vol/vol concentration were used to visualize aqueous humor outflow patterns. The specific sizes and concentration of fluorescent microspheres were chosen on the basis of a previous study that showed negligible obstruction of aqueous outflow through the TM.47 Netarsudil-M1 (10 mM in DMSO) stock solution was obtained from Aerie Pharmaceuticals, Inc. (Durham, NC, USA) and kept at −20°C. Netarsudil-M1 working solution was diluted in GPBS to a final 0.3 μM concentration immediately before perfusion.
Ocular Perfusion
The perfusion procedure has been described in detail in our previous work.48 All eyes were initially perfused with GPBS at 15 mm Hg to establish a stable baseline facility for 30 minutes. Perfusion was halted and anterior chamber fluid from one eye of each pair was exchanged with 5 mL 0.3 μM netarsudil-M1 with 0.42 mM DMSO in GPBS, while its contralateral eye was exchanged with 0.42 mM DMSO in GPBS. Perfusion was restarted with netarsudil-M1 or GPBS and continued for 3 hours. To label outflow hydrodynamics, perfusion was stopped and anterior chamber fluid from both eyes was exchanged for 5 mL GPBS containing fluorescent microspheres. Perfusion was restarted and both eyes were perfused with a fixed volume (150 μL) of the microsphere solution. Perfusion was again stopped and anterior chamber fluid from both eyes was exchanged with a modified Karnovsky's fixative (2.5% glutaraldehyde and 2% paraformaldehyde, pH 7.3), and the eyes were perfusion-fixed at 15 mm Hg for 30 minutes. After perfusion was completed, a small cut was made along the equator, and each eye was immersed in the same fixative overnight. All eyes were then stored in PBS at 4°C until further processing. In this study, all eyes were perfused and perfusion-fixed at Duke University (Durham, NC, USA) and shipped to Boston University School of Medicine (Boston, MA, USA) for further processing, imaging, and analysis.
Global Imaging
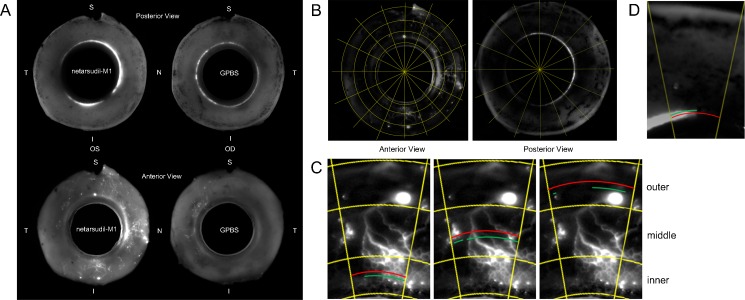
All perfused eyes were processed to image the active outflow areas along the entire outflow pathway as previously described.46 Eyes were first dissected along the equator into anterior and posterior segments. Anterior segments of all eyes were further processed by removing the iris, ciliary body, cornea (with a 10-mm trephine), vitreous, and excess conjunctiva. To visualize active outflow areas, the remaining anterior segments were then imaged globally with blue LED epi-illumination on both their scleral (anterior view) and TM (posterior view) surfaces with a fixed exposure time of 5 seconds (Fig. 1A) by using a 300-mm lens on a 4000MP VersaDock imaging system (Bio-Rad Laboratories, Hercules, CA, USA) operated by Quantity One (Bio-Rad Laboratories).
Figure 1.
Global image analysis. (A) Global images of anterior segments of perfused human eyes showing the outflow tracer patterns in the posterior (TM) and anterior (ESV) views (N, nasal; T, temporal; S, superior; I, inferior). (B) Each global image was digitally separated into 16 wedges after background subtraction. (C–D) Percentage effective filtration length was calculated in each wedge. The green lines represent total filtration length (TFL), and the red lines represent TSL. PEFL = ΣTFL/ΣTSL. In the anterior view global image (C), ESV PEFL of each wedge was calculated by averaging the PEFL measured at three locations: inner, middle, and outer. In the posterior view global image (D), TM PEFL was measured only in one location.
Analysis of PEFL From Global Images
Acquired global images were analyzed to quantify areas of active outflow in the ESVs and TM. To avoid including the autofluorescent sclera as a false-positive signal, each global image underwent background subtraction by using a fixed value (60 pixels) in ImageJ (http://imagej.nih.gov/ij/; provided in the public domain by the National Institutes of Health, Bethesda, MD, USA). Images were then digitally separated into 16 “wedges” (Fig. 1B).
We termed the percentage of the scleral or TM surface that was labeled with fluorescent tracers as the effective filtration area, which was represented by PEFL. To calculate PEFL, global images of the TM and scleral surfaces were measured for the total scleral length (TSL) and total tracer-labeled length (TFL). Three distinct measurements (inner, middle, outer) for TSL and TFL were taken from global images of the scleral surface (Fig. 1C), and the PEFL was calculated as PEFL = [(ΣTFL/ΣTSL)inner + (ΣTFL/ΣTSL)middle + (ΣTFL/ΣTSL)outer]/3 in each digital wedge. The overall ESV PEFL was calculated by determining the mean PEFL of all 16 wedges. For determining TM PEFL, only one measurement was necessary to obtain both TSL and TFL (Fig. 1D). Trabecular meshwork PEFL was calculated as TM PEFL = ΣTFL/ΣTSL. The ESV/TM PEFL of each group is the average of five eyes. All measurements in this study were done in a masked fashion.
Confocal Microscopy
Following global imaging and analysis, anterior segments were further dissected into 16 radial wedges, from which frontal sections were cut along a plane tangential to the corneoscleral limbus and perpendicular to the ocular surface38,49 to bisect SC and TM. All the frontal dissections were performed by an experienced investigator (HG). Each frontal section was permeabilized with 0.01% (vol/vol) Triton X-100 (Sigma-Aldrich Corp., St. Louis, MO, USA) and counterstained with either 4′,6-diamidino-2-phenylindole (DAPI) (Sigma-Aldrich Corp.) or TO-PRO 3 Iodide (Life Technologies, Grand Island, NY, USA). Sections were then mounted and examined with an Axiovert LSM 700 (Carl Zeiss, Oberkochen, Germany) with a 20× objective. Images were taken in all sections containing SC, so that the distribution of the tracer along the IW and the TM could be properly analyzed. A minimum of 75 images was taken for each eye.
Analysis of PEFL From Confocal Images
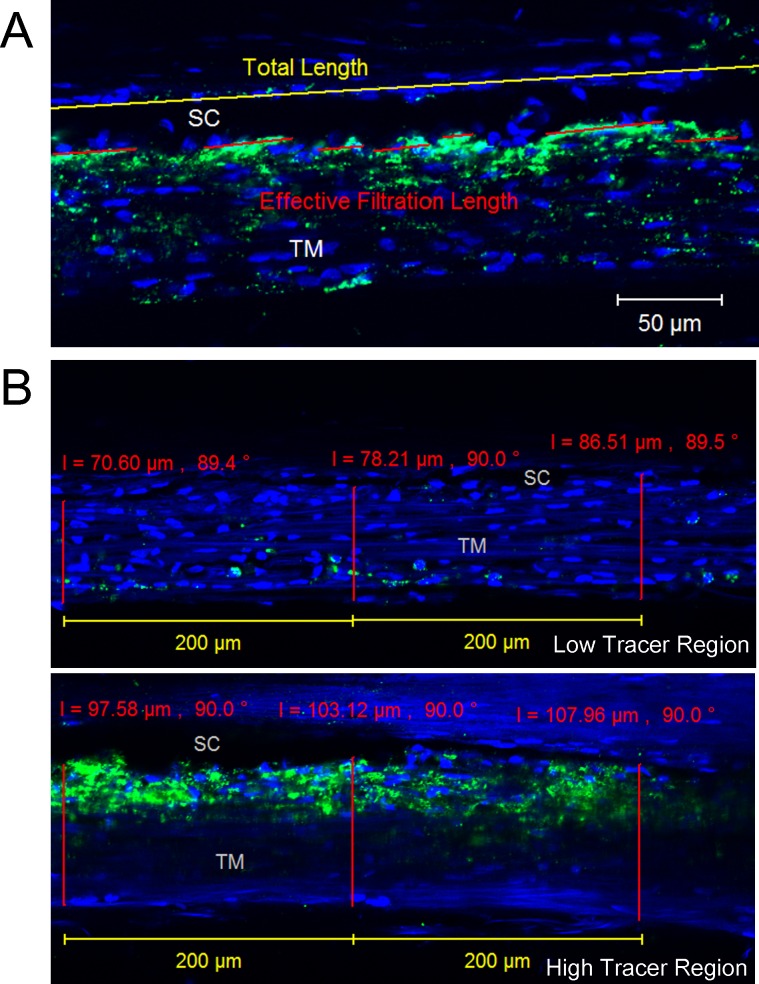
Similar to the ESV PEFL and TM PEFL calculations from global images, the total length (TL) of the IW of SC and fluorescent-decorated length (FL) of the IW in each image was measured by using ZEN 2010 (Carl Zeiss), and the average PEFL (IW PEFL = ΣFL/ΣTL × 100%) in each eye was calculated (Fig. 2A).
Figure 2.
Confocal image analysis. (A) Inner wall PEFL measurement. The red lines represent effective filtration length (FL), and the yellow line represents TL of the IW of SC. The green represents the tracer distribution, and the blue represents the nuclei. The average IW PEFL in each perfused human eye was calculated as IW PEFL = ΣFL/ΣTL. (B) Trabecular meshwork thickness measurement. The red line represents the thickness of TM from the innermost uveoscleral beam to the IW endothelium of SC, which was measured at every 200-μm length of IW. Low tracer and high tracer regions were determined by the tracer distribution shown in green.
Trabecular Meshwork Thickness Measurements
For the TM thickness measurement, the TM was designated as three regions from the following criteria: (1) high tracer regions: IW PEFL > 50%/200 μm, (2) medium tracer regions: IW PEFL < 50%/200 μm but either IW EFL or the tracer-decorated TM > 5%/200 μm and (3) low tracer regions: both IW PEFL and the tracer-decorated TM < 5%/200 μm. Trabecular meshwork thickness (the length from the innermost uveoscleral beams to the IW endothelium of SC) was measured for all confocal images with clearly visible SC and innermost uveoscleral beams at every 200 μm of IW length (Fig. 2B). The average thickness of TM in high tracer, medium tracer, and low tracer regions of each eye, as well as the overall TM thickness [TM thicknessoverall = TM thicknesshigh tracer region × IW PEFL + TM thicknesslow tracer region × (1 − IW PEFL)], was then calculated and analyzed. The criterion for TM thickness measurement was different from the PEFL measurement above, where only the IW of SC needed to be clearly visible, while both IW of SC and the innermost uveoscleral beams needed to be clearly visible for the TM thickness measurement. Therefore, the total length measured for the TM thickness was shorter than the total length measured for the IW PEFL.
Light Microscopy for General Morphology
Unlike the high/medium/low tracer regions for TM thickness analysis in confocal images, which were determined by their local tracer distribution, the high/low tracer sections processed for light microscope images were selected on the basis of the average IW PEFL of each wedge, and two frontal sections with the highest tracer distribution and two frontal sections with the lowest tracer distribution were further processed for light microscopy. All chosen frontal sections were stained with 1% osmium tetroxide and 1.5% potassium ferrocyanide for 2 hours, en bloc stained with 2% uranyl acetate for 90 minutes, dehydrated in an ascending series of ethanol and propylene oxide, and embedded in Epon-Araldite. Semithin sections (2 μm) were cut and stained with 1% Toluidine Blue (Fisher Scientific, Pittsburgh, PA, USA). Light microscope images were taken by using a 20× objective along the IW of SC.
Episcleral Vessel Size Measurements
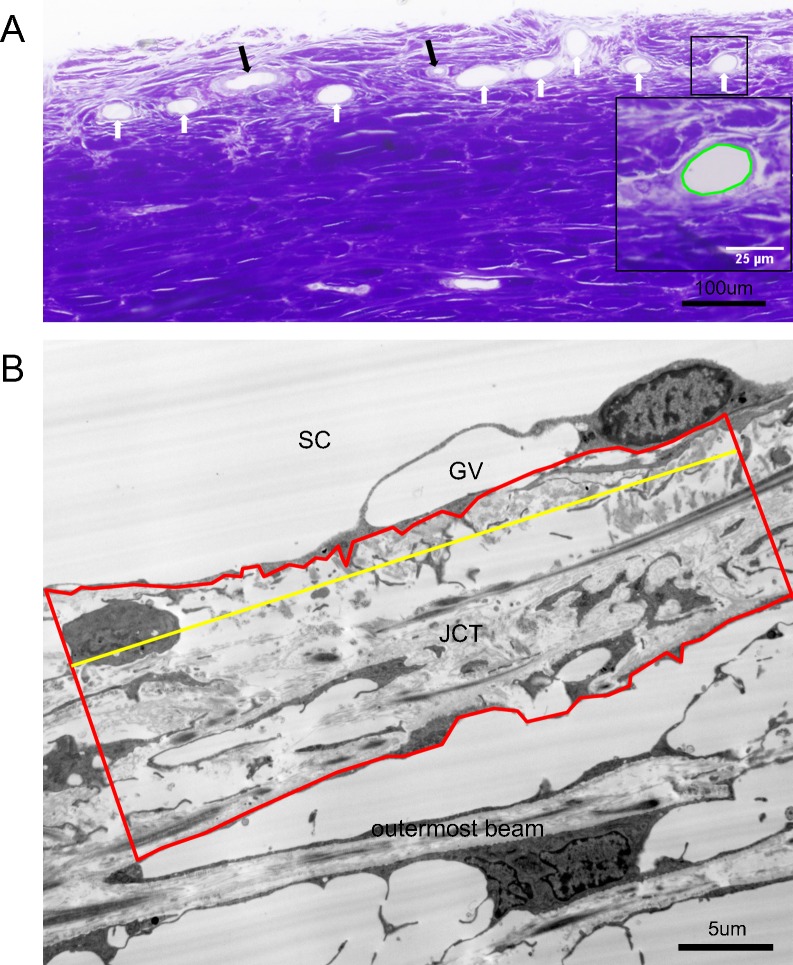
Frontal sections (2 μm) from radial wedges containing high tracer in both the IW and the ESVs from all 10 eyes were processed for light microscopy and imaged. The morphology of the episcleral blood vessels was examined and episcleral arteries were excluded by their typical circular appearance enclosed by muscular walls (Fig. 3A). The remainder of the ESVs were measured and analyzed. The size of each ESV was measured by cross-section area, using ImageJ (Fig. 3A). The major and minor axes, dubbed the x- and y-axes, were also measured. Veins with aspect ratios (x:y) ≥ 5.0 were also removed from the data pool owing to the possibility that they were oblique sections, not radial. Twenty veins were then selected from each of the 10 eyes via simple random sampling (n = 100 each for control and treated) for further analysis.
Figure 3.
Light and electron microscopic analyses. (A) Methods of ESV measurements. Cross-sections of ESVs (white arrows) and episcleral arteries (black arrows) were shown in a light microscopic image. The cross-sectional areas of ESVs were measured and calculated by ImageJ. The perimeter of the area measured is shown in green in the inset, which is a zoomed-in view of the squared area. (B) Methods of juxtacanalicular connective tissue thickness measurement. Juxtacanalicular connective tissue area (red) and JCT length (yellow) were measured in an electron microscopic image and the average JCT thickness (ΣJCT area/ΣJCT length) was then calculated accordingly. GV, giant vacuole.
Electron Microscopy
Among the sections processed for light microscopy, one high tracer frontal section and one low tracer frontal section from each eye were randomly selected for further processing for electron microscopy. Ultrathin sections (80 nm) were cut and examined with a transmission electron microscope (JEOL JEM-1011; JEOL Ltd., Tokyo, Japan). Electron microscope images were taken along the IW of SC in all selected sections.
Juxtacanalicular Connective Tissue Thickness Measurements
Juxtacanalicular connective tissue area was measured in 3000× electron microscopic images by selecting the area from the basal side of the IW endothelium to the empty space adjacent to the outermost corneoscleral beams and measuring the cross-section area by using ImageJ (Fig. 3B). Juxtacanalicular connective tissue length was also measured in ImageJ. Average JCT thickness (ΣJCT area/ΣJCT length) was calculated for both high and low tracer sections of each eye as well as the mean overall JCT thickness [JCT thicknessoverall = JCT thicknesshigh tracer region × PEFL + JCT thicknesslow tracer region × (1 − PEFL)].
Statistical Analysis
Student's t-test, linear regression analysis, and the linear mixed-effects model for repeated measures were applied with a required significance level of P < 0.05. All data are shown as mean ± SEM.
Results
Outflow Facility
While clamping pressure at 15 mm Hg, outflow of both netarsudil-M1–treated and control groups (n = 5 each) was continually measured and outflow facility was calculated at baseline and at 30 minutes, 2 hours, and 3 hours after drug or vehicle application (Fig. 4A; Table). Outflow facility increased over time in the netarsudil-M1–treated group, while remaining unchanged in the control group. Outflow facility of the netarsudil-M1 group versus the GPBS group was 0.28 ± 0.05 vs. 0.21 ± 0.03 μL/min/mm Hg (P = 0.08; 1-tailed, paired t-test) at baseline, 0.34 ± 0.05 vs. 0.20 ± 0.03 μL/min/mm Hg (P = 0.005) at 30 minutes after perfusion, 0.40 ± 0.04 vs. 0.21 ± 0.03 μL/min/mm Hg (P = 0.0002) at 2 hours after perfusion, and 0.43 ± 0.05 vs. 0.21 ± 0.04 μL/min/mm Hg (P = 0.0002) at 3 hours after perfusion. When compared to its own baseline, the netarsudil-M1 group had shown a significant increase after 30 minutes perfusion (P = 0.046 at 30 minutes, 0.004 at 2 hours, and 0.0006 at 3 hours; 1-tailed, paired t-test). In contrast, the GPBS group had no change in outflow facility over the entire 3-hour perfusion when compared to its own baseline (P = 0.35 at 30 minutes, 0.42 at 2 hours, and 0.45 at 3 hours).
Figure 4.
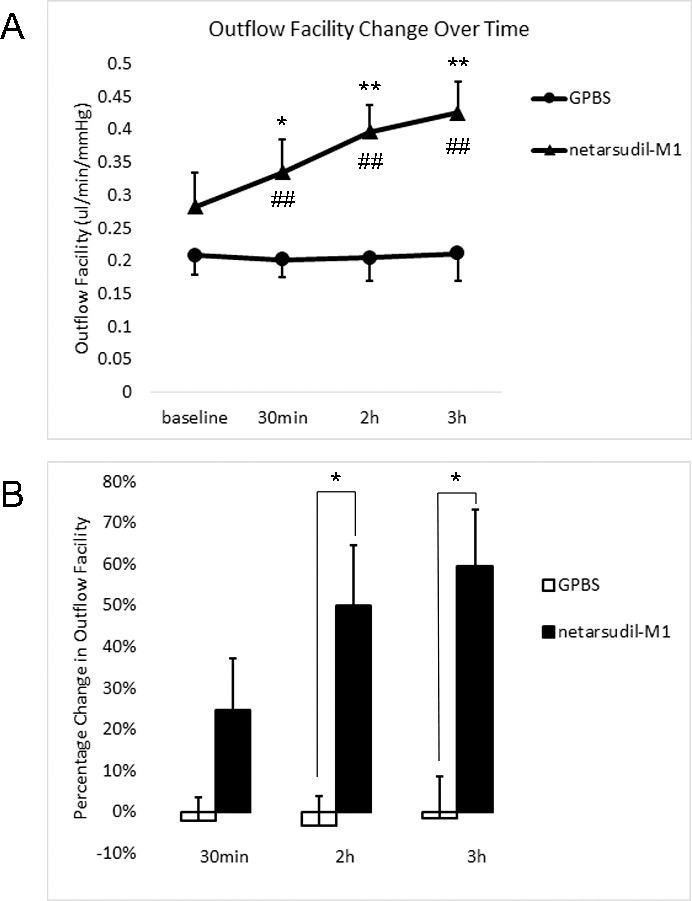
Outflow facility. (A) Netarsudil-M1 treatment increased outflow facility over time. Netarsudil-M1–treated eyes showed significantly increased outflow facility at all time points when compared to the controls (##P < 0.01). There was also a significant increase when compared to its own baseline (*P < 0.05; **P < 0.01). (B) The percentage change in outflow facility in netarsudil-M1–treated eyes also showed a significant increase when compared to the controls after 2 hours and 3 hours of perfusion (*P < 0.05) (n = 5).
Table.
Outflow Facility Change Over Time
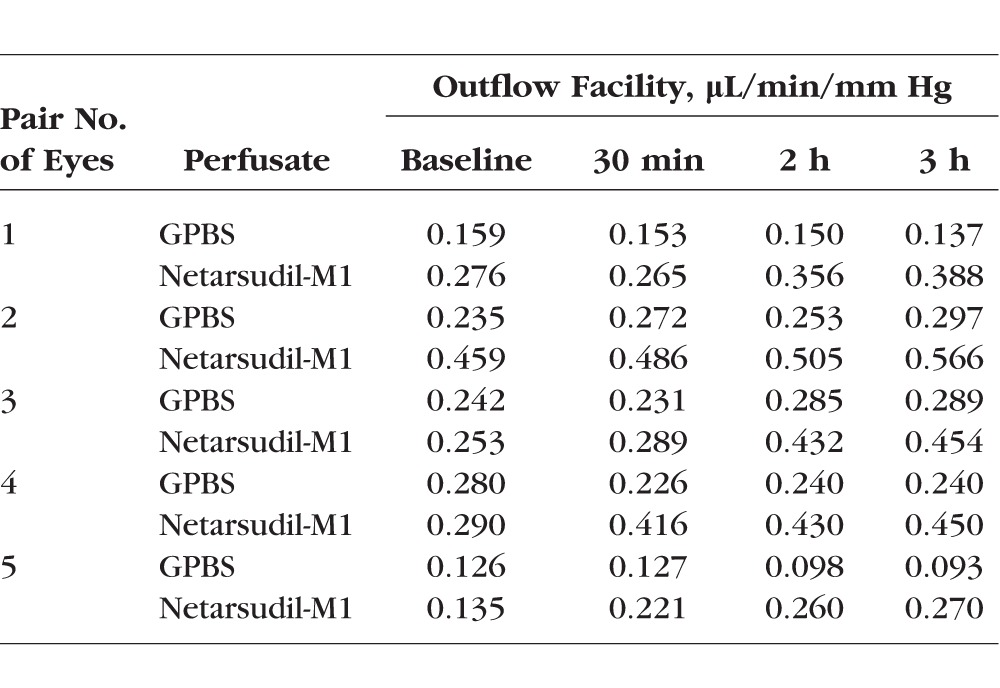
Percentage change in outflow facility in netarsudil-M1–treated eyes increased in a perfusion time–dependent manner, while remaining unchanged in control eyes (Fig. 4B). The percentage change in outflow facility of the netarsudil-M1 versus GPBS groups was 24.66% ± 12.57% vs. −2.21% ± 5.62% (P = 0.08; 1-tailed, paired t-test) at 30 minutes, 50.13% ± 14.64% vs. −3.35% ± 7.24% (P = 0.02) at 2 hours, and 59.70% ± 13.65% vs. −1.70% ± 10.34% (P = 0.02) at 3 hours.
Outflow facility change from baseline at the last time point (3 hours) was further analyzed by using the linear mixed-effects model for repeated measures. The analysis included the fixed categorical effects of treatment, time point, treatment-by-time-point interaction, and the covariate of baseline outflow facility measurement, with the baseline outflow facility measurement-by-time-point interaction adjusted in the model. The restricted maximum likelihood method with a compound symmetry covariance structure shared across treatment groups was used to model the within-patient errors. The Kenward-Roger method was used to estimate denominator degrees of freedom and adjust standard errors. The least square (LS) means of the control and treatment group were −0.02 and 0.12, respectively. At the 3-hour time point, the difference in LS mean change from baseline between the control and treatment groups (−0.14) was statistically significant (P < 0.001, t = −9.47 and df = 18.5). This increasing value in outflow facility change from baseline at the last time point (3 hour) indicates a positive drug effect.
Percentage Effective Filtration Length
Percentage effective filtration length was calculated for ESVs (anterior view) and TM (posterior view) by using global imaging of the anterior segments and for the IW of SC by using confocal imaging of frontal sections. At all three locations, the outflow patterns were segmental, having both high and low tracer regions. Percentage effective filtration length at ESVs was 45.64% ± 3.61% in the netarsudil-M1 group, which was significantly greater than the control group ESV PEFL of 22.58% ± 1.50% (P = 0.007; 2-tailed, paired t-test) (Fig. 5A). Although TM PEFL increased in four of five eyes after netarsudil-M1 treatment, the difference in mean TM PEFL compared to controls did not reach statistical significance (83.05% ± 5.55% vs. 72.19% ± 5.72%, P = 0.28). Percentage effective filtration length at the IW was 35.27% ± 5.14% in the netarsudil-M1 group, which was significantly greater than the control group IW PEFL of 21.26% ± 2.84% (P = 0.007). However, while PEFL at the ESVs and IW was similar to each other in controls (P = 0.63), the increase in PEFL at ESVs was significantly greater than the increase in PEFL at the IW in netarsudil-M1–treated eyes (P = 0.03). Furthermore, there is a significant positive correlation between ESV PEFL and the percentage change in outflow facility (R2 = 0.58, P = 0.01) (Fig. 5B). Inner wall PEFL, on the other hand, did not correlate to the percentage change in outflow facility (R2 = 0.28, P = 0.11).
Figure 5.
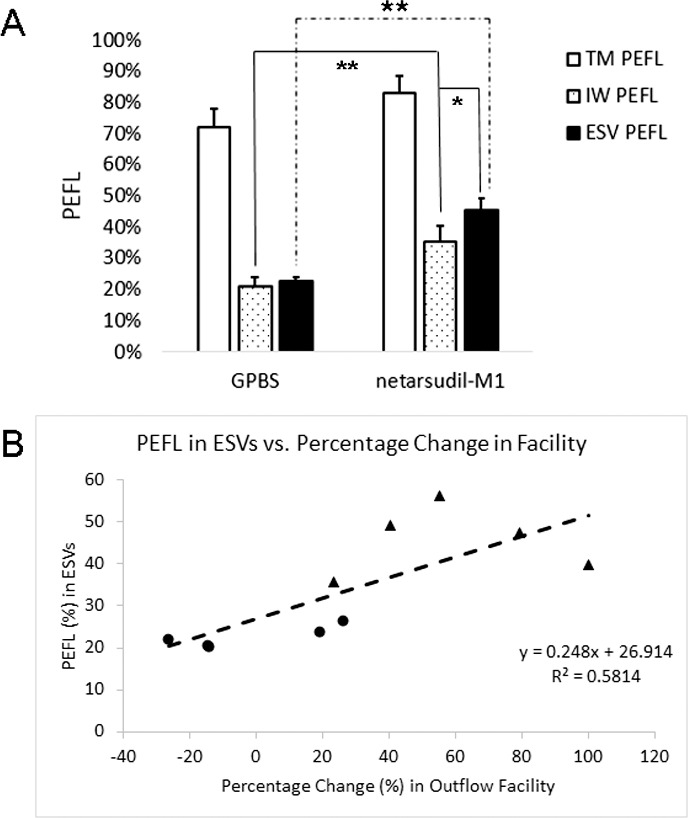
Episcleral vein PEFL and IW PEFL. (A) Netarsudil-M1 treatment induced a significant increase in both ESV and IW PEFL when compared to controls. While ESV PEFL and IW PEFL remained similar to each other in control eyes, ESV PEFL in treated eyes showed a significant increase beyond the increase observed for the IW PEFL (*P < 0.05; **P < 0.01) (n = 5). (B) Episcleral vein PEFL was found to have a positive correlation with percentage change in outflow facility (R2 = 0.58; P = 0.01; solid circles: control eyes; solid triangles: netarsudil-M1–treated eyes).
Trabecular Meshwork Thickness
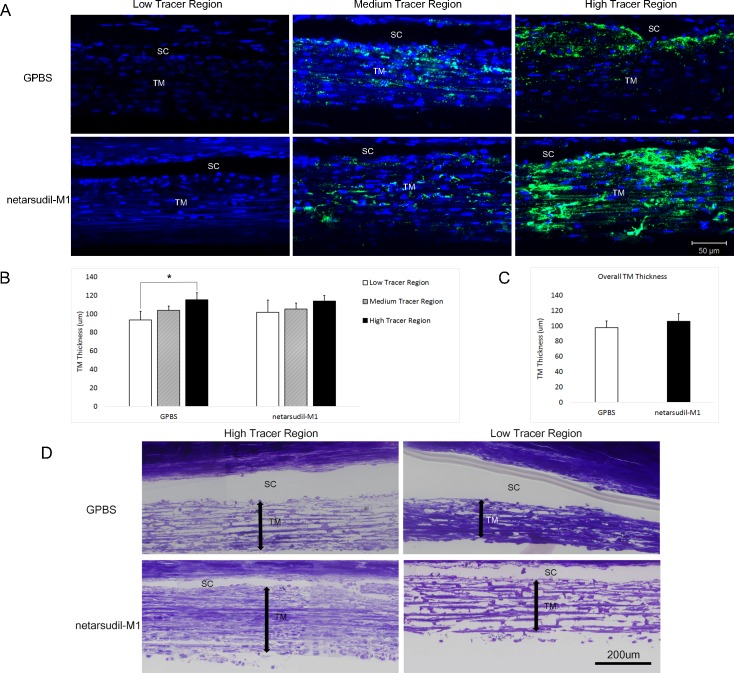
Trabecular meshwork regions were designated as low tracer (local PEFL and local tracer presence in TM < 5%/200 μm IW), medium tracer (local PEFL or local tracer presence in TM > 5%/200 μm IW but local PEFL < 50%/200 μm IW), or high tracer (local PEFL > 50%/200 μm IW) regions (Fig. 6A). In the control eyes, the TM thickness was 93.52 ± 9.22 μm in low tracer regions, 103.71 ± 4.77 μm in medium tracer regions, and 115.20 ± 7.48 μm in high tracer regions. The increase in tracer presence was associated with an increase in the average TM thickness, and TM thickness in high tracer regions was significantly greater than that in low tracer regions (P = 0.02; 2-tailed, paired t-test) (Fig. 6B). However, after netarsudil-M1 treatment, the difference in TM thickness between low tracer and high tracer regions was not significant (P = 0.32). After careful comparison, we found that TM thickness was similar between the treated and control groups in medium tracer regions (105.25 ± 6.37 vs. 103.71 ± 4.77 μm, P = 0.80) and high tracer regions (113.86 ± 5.92 vs. 115.20 ± 7.48 μm, P = 0.77); however, in low tracer regions, the mean TM thickness was increased in the treated group compared to the control group (101.69 ± 13.08 vs. 93.52 ± 9.22 μm). Although this increase was not statistically significant (P = 0.60), it may contribute to the loss of statistical significance between the low and high tracer regions after netarsudil-M1 treatment. The overall TM thickness increased by 8.42 μm (from 97.61 ± 8.82 μm to 106.03 ± 9.84 μm) after netarsudil-M1 treatment, but this increase did not reach statistical significance (P = 0.47) (Fig. 6C).
Figure 6.
Trabecular meshwork thickness. (A) Representative confocal images of TM and SC are shown in low tracer, medium tracer, and high tracer regions of control (GPBS) and netarsudil-M1–treated eyes, respectively. The green represents the distribution of tracer. The blue represents the nuclei. (B) Trabecular meshwork thickness in high tracer regions was significantly higher than in low tracer regions in control eyes. However, there was no significant difference between low tracer and high tracer regions in netarsudil-M1–treated eyes (*P < 0.05) (n = 5). (C) The overall TM thickness was not significantly different between the netarsudil-M1–treated and control eyes. (D) Representative light microscopic images show the morphology in high tracer versus low tracer regions of control and treated eyes. Double arrows represent TM thickness. Trabecular meshwork structure was more expanded in high tracer regions than in low tracer regions in control eyes. More expanded TM was also observed in the low tracer regions of treated eyes when compared to controls.
Light Microscopy
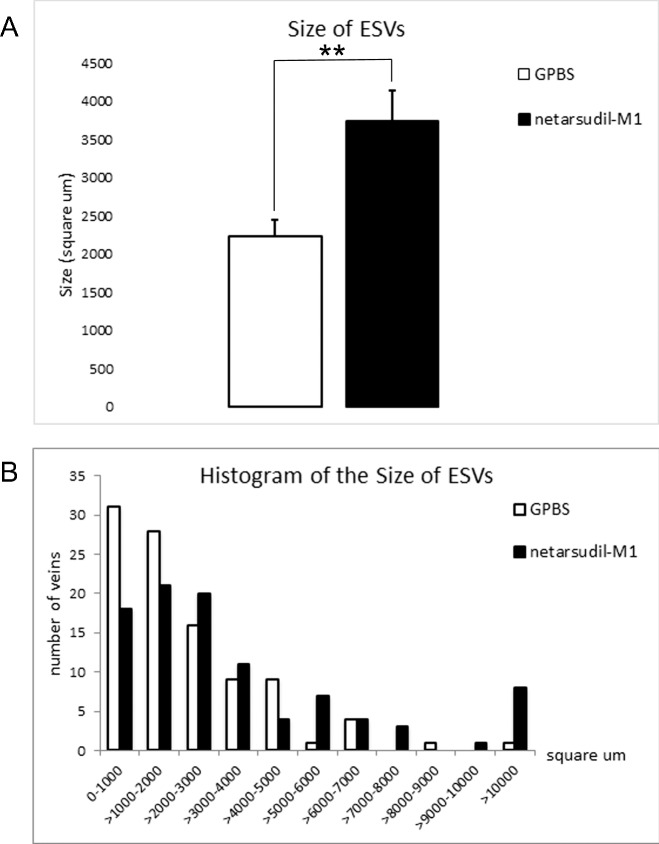
Our morphologic observation of TM thickness by light microscopy was consistent with our confocal results. The TM was more expanded in the high tracer regions compared to low tracer regions in control eyes, and an expansion of the TM was observed in the low tracer region of netarsudil-M1–treated eyes (Fig. 6D). In addition, examination of ESV morphology in high tracer regions revealed a significantly larger average cross-sectional area of ESVs in netarsudil-M1–treated eyes compared to control eyes (3735 ± 405 vs. 2231 ± 217 μm2, P = 0.001; 2-tailed, unpaired t-test) (Fig. 7A). The distribution of ESV cross-sectional area showed a shift to the right (larger size) (Fig. 7B), suggesting vessel dilation occurred across a range of vessel sizes in netarsudil-M1–treated eyes.
Figure 7.
Size of ESVs. (A) Netarsudil-M1 treatment significantly increased the average cross-sectional area of ESVs as compared to GPBS control (**P < 0.01) (n = 100). (B) In treated eyes, the distribution of ESV cross-sectional area was shifted to the right (larger).
Electron Microscopy
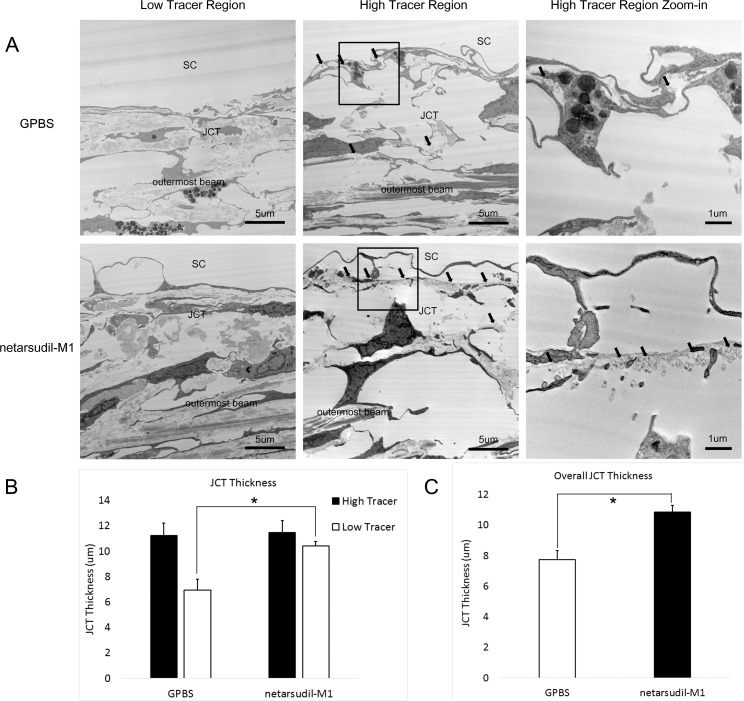
Average JCT thickness in IW high tracer regions of control eyes (11.22 ± 1.00 μm) was greater than that in low tracer regions (6.93 ± 0.87 μm). This difference in JCT thickness approached but did not reach statistical significance (P = 0.08; 2-tailed, paired t-test) (Fig. 8). No significant difference in JCT thickness was found between high tracer regions and low tracer regions in netarsudil-M1–treated eyes (P = 0.35). In netarsudil-M1–treated eyes, mean JCT thickness in high tracer regions was similar to control eyes (11.47 ± 0.93 μm, P = 0.84), while mean JCT thickness in low tracer regions of netarsudil-M1-treated eyes was significantly increased when compared to the low tracer region of controls (10.41 ± 0.37 vs. 6.93 ± 0.87 μm, P = 0.02) (Fig. 8B). The mean overall JCT was significantly increased (P = 0.02) after netarsudil-M1 treatment as compared to controls (10.85 ± 0.43 vs. 7.73 ± 0.62 μm) (Fig. 8C).
Figure 8.
Juxtacanalicular connective tissue thickness. (A) Representative electron microscope images of JCT from low tracer and high tracer regions of GPBS control (top row) and netarsudil-M1–treated eyes (bottom row). Rightmost column presents a larger view of the squared region in middle column. The presence of tracers is indicated with black arrows. (B) A more expanded JCT was found in the high tracer regions than low tracer regions in control eyes. Netarsudil-M1 treatment induced a significant increase in the JCT thickness in low tracer regions compared to low tracer regions in control eyes (*P < 0.05) (n = 5). (C) The overall JCT thickness was increased in netarsudil-M1–treated eyes when compared to the controls (*P < 0.05) (n = 5).
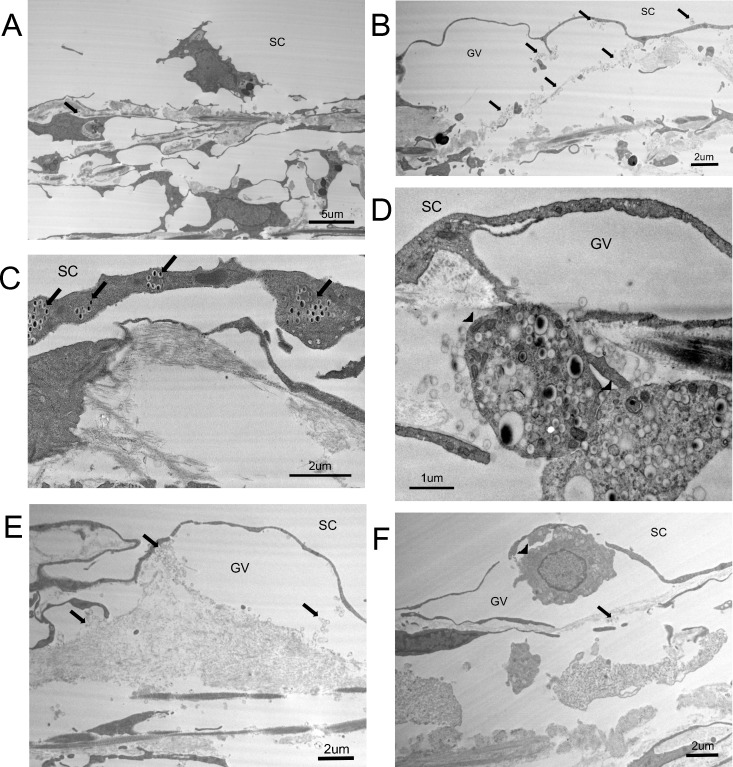
Except for the change in JCT thickness in low tracer regions of netarsudil-M1–treated eyes, there were no other obvious morphologic changes found in high and low tracer regions when comparing treated and control eyes. However, certain characteristics in high tracer regions seem to be observed more often in treated eyes than in controls. One example is the detachment of IW cells from their basement membrane (Fig. 9A). Although this is not a common phenomenon, there was 249 μm (11.15%) of detached IW observed in the 2233-μm total IW length analyzed in the high tracer regions of treated eyes, while this ratio was 177 μm/2252 μm (7.86%) in the high tracer regions of control eyes. In the low tracer regions, this ratio was 49 μm/1712 μm in treated and 9 μm/2147 μm in control eyes. Therefore, although observed in high tracer regions of both treated and control eyes, this detachment seems present more often in both high and low tracer regions of treated eyes. Six such morphologic changes observed more frequently in treated eyes are shown in Figure 9. Besides the detachment of IW cells, there was a greater incidence in treated eyes of joint giant vacuoles (several giant vacuoles merging together; Fig. 9B), IW cells engulfing tracers (Fig. 9C), TM cells engulfing tracers (Fig. 9D), extracellular matrix present within giant vacuoles (Fig. 9E), and cells in the giant vacuoles (Fig. 9F).
Figure 9.
Characteristic morphologies in high tracer regions in both netarsudil-M1–treated and untreated eyes. Black arrows indicate the presence of tracer beads. (A) The detachment of an IW cell. (B) The merging of two GVs. (C) Inner wall cells engulfing tracer. (D) Trabecular meshwork cells (arrowheads) engulfing tracers and flowing into the JCT region. (E) Extracellular matrix and tracer beads in a GV. (F) A cell (arrowhead) in a GV.
Discussion
In this study, we investigated the effects of netarsudil-M1, a dual inhibitor for Rho kinase and NET, on aqueous humor outflow facility, outflow hydrodynamics, and morphology after a 3-hour perfusion in enucleated human eyes. We found that, similar to a previous study of aqueous humor dynamics in monkey eyes,43 netarsudil-M1 acutely increased outflow facility in human eyes. The percentage change in outflow facility was time dependent. By carefully evaluating hydrodynamic and morphologic changes, we found that netarsudil-M1 induced an increase in both JCT thickness and cross-sectional areas of ESVs, both of which correlated with a significant increase in the PEFL at the IW of SC and in the ESVs. Additionally, we found a significantly larger increase in the PEFL in ESVs than in the IW, and PEFL in the ESVs was positively correlated to the percentage increase in outflow facility. Our results support our hypothesis that an increase in outflow facility by netarsudil-M1, the active metabolite of netarsudil, is associated with morphologic changes along the trabecular outflow pathway that produce an increase in the active filtration areas in the IW of SC and ESVs of human eyes.
Compared to a previous study in which the effects of the Rho kinase inhibitor Y-27632 on outflow facility, outflow hydrodynamics, and morphology after perfusion in enucleated human eyes have been investigated,37 a similar increase in the percentage change of outflow facility was induced by netarsudil-M1 (24.66% ± 12.57% for 30 minutes and 59.70% ± 13.65% for 3 hours) as by Y-27632 (29.0% ± 10.6% for 30 minutes and 60.6% ± 16.9% for 3 hours). However, the concentration of netarsudil-M1 (0.3 μM) used in this study was 167-fold lower than the working concentration of Y-27632 (50 μM) in the previous study, signifying that netarsudil-M1 is more potent for increasing outflow facility and reducing IOP.
Aqueous outflow is segmental along the conventional outflow pathway in nonhuman38,39,50,51 and human eyes.37,46,52–54 Previous studies have demonstrated that the active filtration area, represented by PEFL, is a critical parameter for indicating changes in outflow facility37–39,48,50,51 and IOP.55 In the previous study with Y-27632, in which PEFL is measured only at the IW but not at ESV, Y-27632-treated eyes show an increase in IW PEFL as well as a positive correlation between IW PEFL and percentage change in outflow facility. However, in our current study, after 3-hour netarsudil-M1 perfusion, IW PEFL increased 11.3% when compared to the controls (33.91% ± 5.36% vs. 22.62% ± 3.91%). Although this increase was significant, it was smaller than the 17.4% increase (63.6% ± 58.% vs. 46.2% ± 4.8%) caused by perfusion with Y-27632 in the previous study. Additionally, we did not find a significant positive correlation between the IW PEFL and percentage change in outflow facility as that reported in the previous studies with Y-27632 in bovine,38 monkey,39 and human eyes.37 We would expect that the smaller increase in IW PEFL by netarsudil-M1 should produce a smaller increase in outflow facility. However, the total increase in outflow facility was similar between netarsudil-M1–treated and Y-27632-treated eyes. These data led us to hypothesize that similar increase in outflow facility induced by netarsudil-M1 as by Y-27632 may be due to an additional increase in PEFL distal to the IW of SC in the conventional outflow pathway. To address this possibility, we compared the active filtration areas (represented by PEFL) in three locations in the trabecular outflow pathway: TM, IW, and ESV, by combining confocal microscopy with a recently developed global imaging technique.46 To the best of our knowledge, it is the first time this approach was used to investigate the drug's effect along trabecular outflow pathway in human eyes. We found that netarsudil-M1 significantly increased PEFL in both IW of SC and ESVs, and the ESV PEFL was significantly larger than the IW PEFL when compared to similar PEFLs between the IW and ESVs in control eyes. Although the increase in IW PEFL did not show a positive correlation with the percentage change in outflow facility, a significant positive correlation was found for the increase in ESV PEFL. These data supported our hypothesis that netarsudil-M1 induced an additional increase in PEFL distal to SC, which contributed to the increase in outflow facility.
The mechanism(s) by which netarsudil may cause decreased resistance in the distal outflow pathway cannot be fully explained by our data. Netarsudil has been reported to significantly reduce EVP in rabbits after topical application, which contributes substantially to the reduction of IOP.44 Given that Rho kinase inhibitors can cause vasodilation,56,57 we hypothesized that netarsudil-M1–treated eyes may induce dilation of ESVs. Our histologic findings support our hypothesis by showing that netarsudil-M1 significantly increased the size (cross-sectional area) of ESVs. This dilation of ESVs is consistent with the reduction in EVP seen in rabbits. According to our measurements, most (>55%) ESVs in control eyes have a cross-sectional area of less than 2000 μm2. These data suggest that the size of most ESVs is similar to that of venules, which are 15 to 50 μm in diameter58 and estimated to have a cross-sectional area of 180 to 2000 μm2, if calculating on the basis of their diameter. The size of venules is small enough to cause postcapillary resistance to blood flow. Venules can also respond to the application of vasoactive substances and result in changes in venular resistance,59 which implies that they play a role in controlling blood flow. Although the resistance to aqueous outflow in this study should be much less than resistance to blood flow owing to the significantly lower viscosity that our perfusate had, it is possible for the ESVs to account for a portion of the resistance to the distal outflow. Our data showed that there is a 67% increase in the mean cross-sectional area of individual veins after netarsudil treatment. According to Poiseuille's Law, flow resistance would be the fourth power dependence upon the radius. Therefore, after netarsudil treatment, flow resistance caused by ESVs would be approximately one-third of the original resistance. In addition, it is possible that greater distal resistance to outflow is present in the smaller, more tortuous vessels of the intrascleral plexus (which could not be assessed in the current study), and that netarsudil-induced dilation of these vessels reduced the resistance to aqueous outflow even more and thereby increased the total outflow facility.
Although global imaging of the TM revealed that PEFL increased in four of five netarsudil-M1–treated eyes, this increase did not reach statistical significance when compared to controls. Global imaging also revealed that in both control and treated eyes, the PEFL at the TM (70%–80%) was substantially larger than the PEFL at the IW (20%–30%). This is consistent with the previous findings suggesting that most of the outflow resistance is located in JCT and IW regions,6,18–20 causing a significant decrease in active filtration area when the aqueous flows through the JCT and IW regions.
Similar to our previous studies,37,46 we found a significantly greater TM thickness in high tracer regions than in low tracer regions in untreated control eyes. Morphologically, a looser or more expanded TM structure was observed in the high tracer regions, suggesting the region with lower outflow resistance, while a more compacted TM structure was observed in low tracer regions, indicative of regions with higher outflow resistance. Although overall TM thickness was increased by 8.42 μm after netarsudil-M1 treatment, this increase did not reach statistical significance (P = 0.47) owing to a small N and variability between individuals. Netarsudil-M1 treatment did produce a statistically significant increase in overall JCT thickness of 3.13 μm (P = 0.02).
Interestingly, we found that TM thickness in high/medium tracer regions after netarsudil-M1 treatment was similar to controls, and JCT thickness was also similar to controls in high tracer regions. In contrast, we found that JCT/TM thickness was increased in low tracer regions after netarsudil-M1 treatment. One possible explanation for this observation is that the TM/JCT thickness in high tracer regions is already expanded and thus less affected by drug treatment. The increase in IW PEFL induced by netarsudil-M1 treatment may result primarily from its ability to change the more compacted TM structure of low tracer regions to a looser or more expanded structure. When such morphologic changes reach a threshold, previous low flow regions could become medium or high flow regions, resulting in an overall increase in the PEFL in the outflow pathway.
Our study has provided evidence of hydrodynamic and morphologic changes induced by netarsudil-M1 along the trabecular outflow pathway, which may be responsible for the measured increase in outflow facility. However, there were some limitations to this study owing to the experiments being performed in enucleated eyes. Using enucleated eyes allowed us to functionally isolate the conventional outflow tract and perform detailed morphologic evaluations post drug perfusion. Unlike in vivo conditions, however, this model cannot evaluate the impact of aqueous humor production, normal ciliary body tone, episcleral venous pressure, or uveoscleral outflow, which has recently been reported to increase with treatment of Rho kinase inhibitor Y-27632 in monkey eyes.60 Since we were not able to evaluate netarsudil's effects on aqueous humor production, its function as a NET inhibitor was not investigated in this study. In addition, since the episcleral venous pressure is zero in enucleated eyes, compared to approximately 7 mm Hg in the in vivo condition,61 the 15-mm-Hg pressure we used for perfusion produced a relatively higher pressure gradient across the TM than is typical for normotensive eyes. With these known limitations, we were only able to investigate a subset of the mechanisms through which netarsudil-M1 may increase outflow facility in human eyes. Further animal studies or clinical studies will be needed to investigate other potential effects of this drug.
In summary, we found that the active metabolite of netarsudil, netarsudil-M1, acutely increases outflow facility in human eyes by increasing the area of active filtration in the trabecular outflow pathway. Morphologic correlations with this increase include expansion of the TM/JCT and dilation of ESVs. A significantly larger increase in PEFL was found in ESVs than in the IW, suggesting netarsudil may reduce outflow resistance distal to the IW of SC, which needs to be confirmed with further in vivo study. It will be interesting to see the impact of these drug effects on the long-term function of the diseased trabecular outflow pathway in glaucomatous patients.
Acknowledgments
Supported by Aerie Pharmaceuticals, Inc., National Institute of Health (NIH) EY022634, EY019696, and The Massachusetts Lions Eye Research Fund.
Disclosure: R. Ren, None; G. Li, None; T.D. Le, None; C. Kopczynski, Aerie Pharmaceuticals, Inc. (E); W.D. Stamer, None; H. Gong, None
References
- 1. WHO Facts: International Agency for the Prevention of Blindness. Available at: http://www.iapb.org/vision-2020/global-facts. Accessed December 16, 2015.
- 2. Tham Y-C,, Li X,, Wong TY,, Quigley HA,, Aung T,, Cheng C-Y. Global prevalence of glaucoma and projections of glaucoma burden through 2040: a systematic review and meta-analysis. Ophthalmology. 2014; 121: 2081–2090. [DOI] [PubMed] [Google Scholar]
- 3. Vajaranant TS,, Wu S,, Torres M,, Varma R. The changing face of primary open-angle glaucoma in the United States: demographic and geographic changes from 2011 to 2050. Am J Ophthalmol. 2012; 154: 303–314.e3. [DOI] [PMC free article] [PubMed] [Google Scholar]
- 4. Vajaranant TS,, Wu S,, Torres M,, Varma R. A 40-year forecast of the demographic shift in primary open-angle glaucoma in the United States. Invest Ophthalmol Vis Sci. 2012; 53: 2464–2466. [DOI] [PubMed] [Google Scholar]
- 5. McMonnies CW. Intraocular pressure spikes in keratectasia, axial myopia, and glaucoma. Optom Vis Sci. 2008; 85: 1018–1026. [DOI] [PubMed] [Google Scholar]
- 6. Grant WM. Experimental aqueous perfusion in enucleated human eyes. Arch Ophthalmol. 1963; 69: 783–801. [DOI] [PubMed] [Google Scholar]
- 7. Heijl A,, Leske MC,, Bengtsson B,, et al. Reduction of intraocular pressure and glaucoma progression: results from the Early Manifest Glaucoma Trial. Arch Ophthalmol. 2002; 120: 1268–1279. [DOI] [PubMed] [Google Scholar]
- 8. Leske MC,, Heijl A,, Hyman L,, et al. Predictors of long-term progression in the early manifest glaucoma trial. Ophthalmology. 2007; 114: 1965–1972. [DOI] [PubMed] [Google Scholar]
- 9. Gordon MO,, Beiser JA,, Brandt JD,, et al. The Ocular Hypertension Treatment Study: baseline factors that predict the onset of primary open-angle glaucoma. Arch Ophthalmol. 2002; 120: 714–720. [DOI] [PubMed] [Google Scholar]
- 10. Kass MA,, Heuer DK,, Higginbotham EJ,, et al. The Ocular Hypertension Treatment Study: a randomized trial determines that topical ocular hypotensive medication delays or prevents the onset of primary open-angle glaucoma. Arch Ophthalmol. 2002; 120: 701–713. [DOI] [PubMed] [Google Scholar]
- 11. Collaborative Normal-Tension Glaucoma Study Group. Comparison of glaucomatous progression between untreated patients with normal-tension glaucoma and patients with therapeutically reduced intraocular pressures. Am J Ophthalmol. 1998; 126: 487–497. [DOI] [PubMed] [Google Scholar]
- 12. Fiscella RG,, Lesar TS,, Edward DP. Pharmacotherapy: A Pathophysiologic Approach. 9th ed. New York City, NY: McGraw-Hill Education/Medical; 2014. [Google Scholar]
- 13. Marquis RE,, Whitson JT. Management of glaucoma: focus on pharmacological therapy. Drugs Aging. 2005; 22: 1–21. [DOI] [PubMed] [Google Scholar]
- 14. Sommer A. Intraocular pressure and glaucoma. Am J Ophthalmol. 1989; 107: 186–188. [DOI] [PubMed] [Google Scholar]
- 15. Quigley HA. Open-angle glaucoma. N Engl J Med. 1993; 328: 1097–1106. [DOI] [PubMed] [Google Scholar]
- 16. Toris CB,, Yablonski ME,, Wang YL,, Camras CB. Aqueous humor dynamics in the aging human eye. Am J Ophthalmol. 1999; 127: 407–412. [DOI] [PubMed] [Google Scholar]
- 17. Bill A,, Phillips CI. Uveoscleral drainage of aqueous humour in human eyes. Exp Eye Res. 1971; 12: 275–281. [DOI] [PubMed] [Google Scholar]
- 18. Mäepea O,, Bill A. Pressures in the juxtacanalicular tissue and Schlemm's canal in monkeys. Exp Eye Res. 1992; 54: 879–883. [DOI] [PubMed] [Google Scholar]
- 19. Mäepea O,, Bill A. The pressures in the episcleral veins Schlemm's canal and the trabecular meshwork in monkeys: effects of changes in intraocular pressure. Exp Eye Res. 1989; 49: 645–663. [DOI] [PubMed] [Google Scholar]
- 20. Johnson M,, Shapiro A,, Ethier CR,, Kamm RD. Modulation of outflow resistance by the pores of the inner wall endothelium. Invest Ophthalmol Vis Sci. 1992; 33: 1670–1675. [PubMed] [Google Scholar]
- 21. Rosenquist R,, Epstein D,, Melamed S,, Johnson M,, Grant WM. Outflow resistance of enucleated human eyes at two different perfusion pressures and different extents of trabeculotomy. Curr Eye Res. 1989; 8: 1233–1240. [DOI] [PubMed] [Google Scholar]
- 22. Schuman JS,, Chang W,, Wang N,, de Kater AW,, Allingham RR. Excimer laser effects on outflow facility and outflow pathway morphology. Invest Ophthalmol Vis Sci. 1999; 40: 1676–1680. [PubMed] [Google Scholar]
- 23. Sumida GM,, Stamer WD. Sphingosine-1-phosphate enhancement of cortical actomyosin organization in cultured human Schlemm's canal endothelial cell monolayers. Invest Ophthalmol Vis Sci. 2010; 51: 6633–6638. [DOI] [PMC free article] [PubMed] [Google Scholar]
- 24. Ramos RF,, Sumida GM,, Stamer WD. Cyclic mechanical stress and trabecular meshwork cell contractility. Invest Ophthalmol Vis Sci. 2009; 50: 3826–3832. [DOI] [PMC free article] [PubMed] [Google Scholar]
- 25. WuDunn D. Mechanobiology of trabecular meshwork cells. Exp Eye Res. 2009; 88: 718–723. [DOI] [PubMed] [Google Scholar]
- 26. Zhang M,, Maddala R,, Rao PV. Novel molecular insights into RhoA GTPase-induced resistance to aqueous humor outflow through the trabecular meshwork. Am J Physiol Cell Physiol. 2008; 295: C1057–C1070. [DOI] [PMC free article] [PubMed] [Google Scholar]
- 27. Faralli JA,, Newman JR,, Sheibani N,, Dedhar S,, Peters DM. Integrin-linked kinase regulates integrin signaling in human trabecular meshwork cells. Invest Ophthalmol Vis Sci. 2011; 52: 1684–1692. [DOI] [PMC free article] [PubMed] [Google Scholar]
- 28. Schwinn MK,, Gonzalez JM,, Gabelt BT,, Sheibani N,, Kaufman PL,, Peters DM. Heparin II domain of fibronectin mediates contractility through an alpha4beta1 co-signaling pathway. Exp Cell Res. 2010; 316: 1500–1512. [DOI] [PMC free article] [PubMed] [Google Scholar]
- 29. Rao PV,, Deng PF,, Kumar J,, Epstein DL. Modulation of aqueous humor outflow facility by the Rho kinase-specific inhibitor Y-27632. Invest Ophthalmol Vis Sci. 2001; 42: 1029–1037. [PubMed] [Google Scholar]
- 30. Aga M,, Bradley JM,, Keller KE,, Kelley MJ,, Acott TS. Specialized podosome- or invadopodia-like structures (PILS) for focal trabecular meshwork extracellular matrix turnover. Invest Ophthalmol Vis Sci. 2008; 49: 5353–5365. [DOI] [PMC free article] [PubMed] [Google Scholar]
- 31. Bucolo C,, Salomone S,, Drago F,, Reibaldi M,, Longo A,, Uva MG. Pharmacological management of ocular hypertension: current approaches and future prospective. Curr Opin Pharmacol. 2013; 13: 50–55. [DOI] [PubMed] [Google Scholar]
- 32. Kopczynski CC,, Epstein DL. Emerging trabecular outflow drugs. J Ocul Pharmacol Ther. 2014; 30: 85–87. [DOI] [PMC free article] [PubMed] [Google Scholar]
- 33. Pattabiraman PP,, Epstein DL,, Rao PV. Regulation of adherens junctions in trabecular meshwork cells by Rac GTPase and their influence on intraocular pressure. J Ocul Biol. 2013; 1: 0002. [DOI] [PMC free article] [PubMed] [Google Scholar]
- 34. Pattabiraman PP,, Maddala R,, Rao PV. Regulation of plasticity and fibrogenic activity of trabecular meshwork cells by Rho GTPase signaling. J Cell Physiol. 2014; 229: 927–942. [DOI] [PMC free article] [PubMed] [Google Scholar]
- 35. Honjo M,, Inatani M,, Kido N,, et al. Effects of protein kinase inhibitor, HA1077, on intraocular pressure and outflow facility in rabbit eyes. Arch Ophthalmol. 2001; 119: 1171–1178. [DOI] [PubMed] [Google Scholar]
- 36. Honjo M,, Tanihara H,, Inatani M,, et al. Effects of rho-associated protein kinase inhibitor Y-27632 on intraocular pressure and outflow facility. Invest Ophthalmol Vis Sci. 2001; 42: 137–144. [PubMed] [Google Scholar]
- 37. Yang C-YC,, Liu Y,, Lu Z,, Ren R,, Gong H. Effects of Y27632 on aqueous humor outflow facility with changes in hydrodynamic pattern and morphology in human eyes. Invest Ophthalmol Vis Sci. 2013; 54: 5859–5870. [DOI] [PMC free article] [PubMed] [Google Scholar]
- 38. Lu Z,, Overby DR,, Scott PA,, Freddo TF,, Gong H. The mechanism of increasing outflow facility by rho-kinase inhibition with Y-27632 in bovine eyes. Exp Eye Res. 2008; 86: 271–281. [DOI] [PMC free article] [PubMed] [Google Scholar]
- 39. Lu Z,, Zhang Y,, Freddo TF,, Gong H. Similar hydrodynamic and morphological changes in the aqueous humor outflow pathway after washout and Y27632 treatment in monkey eyes. Exp Eye Res. 2011; 93: 397–404. [DOI] [PMC free article] [PubMed] [Google Scholar]
- 40. Garnock-Jones KP. Ripasudil: first global approval. Drugs. 2014; 74: 2211–2215. [DOI] [PubMed] [Google Scholar]
- 41. Bacharach J,, Dubiner HB,, Levy B,, Kopczynski CC,, Novack GD; AR-13324-CS202 Study Group. Double-masked, randomized dose-response study of AR-13324 versus latanoprost in patients with elevated intraocular pressure. Ophthalmology. 2015; 122: 302–307. [DOI] [PubMed] [Google Scholar]
- 42. Pattabiraman PP,, Rao PV,, Lin C-W,, Kopczynski C. Effects of Rho kinase inhibitor AR-13324 on the actin cytoskeleton and on TGFβ2- and CTGF-induced fibrogenic activity in human trabecular meshwork cells. AOPT. 2015. Available at: http://files.shareholder.com/downloads/AMDA-29CD43/0x0x813064/FD162265-D9B2-455B-9502-A35E3A956EFC/Aerie-Duke_fibrosis_poster__AOPT_2015.pdf. Accessed December 17, 2015.
- 43. Wang R-F,, Williamson JE,, Kopczynski C,, Serle JB. Effect of 0.04% AR-13324, a ROCK, and norepinephrine transporter inhibitor on aqueous humor dynamics in normotensive monkey eyes. J Glaucoma. 2015; 24: 51–54. [DOI] [PubMed] [Google Scholar]
- 44. Kiel JW,, Kopczynski CC. Effect of AR-13324 on episcleral venous pressure in Dutch belted rabbits. J Ocul Pharmacol Ther. 2015; 31: 146–151. [DOI] [PMC free article] [PubMed] [Google Scholar]
- 45. Li G,, Mukherjee D,, Navarro I,, et al. Visualization of conventional outflow tissue responses to netarsudil in living mouse eyes. Eur J Pharmacol. 2016; 787: 20–31. [DOI] [PMC free article] [PubMed] [Google Scholar]
- 46. Cha EDK,, Xu J,, Gong L,, Gong H. Variations in active outflow along the trabecular outflow pathway. Exp Eye Res. 2016; 146: 354–360. [DOI] [PMC free article] [PubMed] [Google Scholar]
- 47. Johnson M,, Johnson DH,, Kamm RD,, DeKater AW,, Epstein DL. The filtration characteristics of the aqueous outflow system. Exp Eye Res. 1990; 50: 407–418. [DOI] [PubMed] [Google Scholar]
- 48. Scott PA,, Lu Z,, Liu Y,, Gong H. Relationships between increased aqueous outflow facility during washout with the changes in hydrodynamic pattern and morphology in bovine aqueous outflow pathways. Exp Eye Res. 2009; 89: 942–949. [DOI] [PubMed] [Google Scholar]
- 49. Parc CE,, Johnson DH,, Brilakis HS. Giant vacuoles are found preferentially near collector channels. Invest Ophthalmol Vis Sci. 2000; 41: 2984–2990. [PubMed] [Google Scholar]
- 50. Battista SA,, Lu Z,, Hofmann S,, Freddo T,, Overby DR,, Gong H. Reduction of the available area for aqueous humor outflow and increase in meshwork herniations into collector channels following acute IOP elevation in bovine eyes. Invest Ophthalmol Vis Sci. 2008; 49: 5346–5352. [DOI] [PMC free article] [PubMed] [Google Scholar]
- 51. Zhu J,, Ye W,, Gong H. Development of a novel two color tracer perfusion technique for the hydrodynamic study of aqueous outflow in bovine eyes. Chin Med J (Engl). 2010; 123: 599–605. [PMC free article] [PubMed] [Google Scholar]
- 52. Keller KE,, Bradley JM,, Vranka JA,, Acott TS. Segmental versican expression in the trabecular meshwork and involvement in outflow facility. Invest Ophthalmol Vis Sci. 2011; 52: 5049–5057. [DOI] [PMC free article] [PubMed] [Google Scholar]
- 53. Chang JYH,, Folz SJ,, Laryea SN,, Overby DR. Multi-scale analysis of segmental outflow patterns in human trabecular meshwork with changing intraocular pressure. J Ocul Pharmacol Ther. 2014; 30: 213–223. [DOI] [PubMed] [Google Scholar]
- 54. Vranka JA,, Bradley JM,, Yang Y-F,, Keller KE,, Acott TS. Mapping molecular differences and extracellular matrix gene expression in segmental outflow pathways of the human ocular trabecular meshwork. PLoS One. 2015; 10: e0122483. [DOI] [PMC free article] [PubMed] [Google Scholar]
- 55. Swaminathan SS,, Oh D-J,, Kang MH,, et al. Secreted protein acidic and rich in cysteine (SPARC)-null mice exhibit more uniform outflow. Invest Ophthalmol Vis Sci. 2013; 54: 2035–2047. [DOI] [PMC free article] [PubMed] [Google Scholar]
- 56. Hein TW,, Rosa RH,, Yuan Z,, Roberts E,, Kuo L. Divergent roles of nitric oxide and rho kinase in vasomotor regulation of human retinal arterioles. Invest Ophthalmol Vis Sci. 2010; 51: 1583–1590. [DOI] [PMC free article] [PubMed] [Google Scholar]
- 57. Nagaoka T,, Hein TW,, Yoshida A,, Kuo L. Simvastatin elicits dilation of isolated porcine retinal arterioles: role of nitric oxide and mevalonate-rho kinase pathways. Invest Ophthalmol Vis Sci. 2007; 48: 825–832. [DOI] [PubMed] [Google Scholar]
- 58. Krstic RV. Human Microscopic Anatomy: An Atlas for Students of Medicine and Biology. Berlin Heidelberg: Springer; 2010. [Google Scholar]
- 59. Rothe CF,, Maass-Moreno R. Hepatic venular resistance responses to norepinephrine, isoproterenol, adenosine, histamine and ACh in rabbits. Am J Physiol. 1998; 274: H777–H785. [DOI] [PubMed] [Google Scholar]
- 60. Toris CB,, McLaughlin MA,, Dworak DP,, et al. Effects of Rho kinase inhibitors on intraocular pressure and aqueous humor dynamics in nonhuman primates and rabbits. J Ocul Pharmacol Ther. 2016; 32: 355–364. [DOI] [PubMed] [Google Scholar]
- 61. Malihi M,, McLaren JW,, Sit AJ. Effect of topical anesthesia on episcleral venous pressure in normal human subjects. Invest Ophthalmol Vis Sci. 2015; 56: 2968–2970. [DOI] [PubMed] [Google Scholar]


