Abstract
The evolution of intracranial aneurysms (IAs) is thought to be driven by progressive wall degradation in response to abnormal hemodynamics. Previous studies focused on the relationship between global hemodynamics and wall properties. However, hemodynamics, wall structure and mechanical properties of cerebral aneurysms can be non-uniform across the aneurysm wall. Therefore, the aim of this work is to introduce a methodology for mapping local hemodynamics to local wall structure in resected aneurysm specimens. This methodology combines image-based computational fluid dynamics, tissue resection, micro-CT imaging of resected specimens mounted on 3D-printed aneurysm models, alignment to 3D vascular models, multi-photon microscopy of the wall, and regional mapping of hemodynamics and wall properties. This approach employs a new 3D virtual marking tool for surgeons to delineate the location of the resected specimen directly on the 3D model, while in the surgical suite. The case of a middle cerebral artery aneurysm is used to illustrate the application of this methodology to the assessment of the relationship between local wall shear stress and local wall properties including collagen fiber organization and wall geometry. This methodology can similarly be used to study the relationship between local intramural stresses and local wall structure.
Keywords: Cerebral aneurysms, hemodynamics, collagen architecture, computational fluid dynamics, multi-photon microscopy, micro-CT, specimen resection
1. Introduction
Intracranial aneurysms (IA) have devastating consequences when they rupture and affect a substantial portion (5–8%) of the general population22, 29. Treatments of IAs have non-negligible risks (10–14%)2, 16 that can exceed the natural rupture risk (0.3–3%)16, 17, 19, 20. Therefore, it is essential to appropriately select aneurysms for intervention or observation. Precise understanding of the mechanisms of aneurysm progression and rupture is critical to develop accurate and objective evidence-based aneurysm evaluation strategies.
The natural history of IAs is thought to be strongly influenced by flow-induced degradation of the wall12, 15. Histologic analyses have suggested that aberrant flows can cause endothelial dysfunction which induces accumulation of cytotoxic and pro-inflammatory substances in the wall as well as thrombus formation, leading to mural cell loss and impaired cellular function12, 28. Improper endothelial function can impact the wall capacity for collagen renewal and maintenance, necessary for preserving the wall structural integrity. Mechanical tests of human aneurysm samples have suggested the stiffness of the wall may be associated to rupture7. It has also been shown that both wall structure and mechanical strength can vary from patient to patient even within the unruptured population, and that wall structure can also vary locally within the same aneurysm23. Furthermore, two subpopulations have been found in a study of unruptured aneurysms, one with weaker more vulnerable walls and another with stronger walls23. Additionally, possible associations between global aneurysm hemodynamic characteristics and wall strength and stiffness have been identified5. Intramural stresses are also known to strongly influence wall structure and strength9.
It is increasingly recognized that to understand the role of hemodynamics (and other biomechanic loads) in IA pathogenesis, we need to directly evaluate biological and structural changes in the wall5, 12. However, hemodynamics, wall structure and mechanical properties are often heterogeneous, i.e. non-uniformly distributed over the aneurysm12, 23. Therefore, it is necessary to link local hemodynamics and local wall characteristics (thickness, collagen structure, cellular content, mechanical properties, etc.).
Previously, Meng et al. mapped computational fluid dynamics (CFD) and histology data in rabbit models of aneurysm formation at arterial bifurcations. Histology sections were identified by surgically implanting radio-opaque markers18 or by interactively selecting cut-planes that visually matched the histological sections27. Groen et al. used manually annotated landmarks visible in both in-vivo and ex-vivo images of diseased carotid artery bifurcations for point-based registration13. Unlike these studies where entire arterial bifurcations were visible in both images, mapping small portions of aneurysm domes to in-vivo vasculatures is more challenging because straightforward identification of anatomical landmarks or use of semi-automatic registration algorithms is unfeasible.
The purpose of this study is to introduce a strategy for mapping local hemodynamics (or local wall stress) to local wall structure in patients with IAs. This is the first attempt at this challenging problem.
2. Methodology for Mapping Resected IA Tissue to Reconstructed Vascular Model
2.1. Overview of Methodology
The methodology is designed to enable data obtained on 3D pre-operative vascular models to be related to data obtained on physical aneurysm specimens harvested from consented patients after surgical clipping (Supplementary Material, Figure I). This is achieved by introducing a virtual model of the aneurysm sample mounted on a 3D-printed vascular model of the aneurysm lumen and neighboring vasculature. Both datasets are mapped back to this virtual model.
In what follows, this methodology is described in detail and illustrated using data from a 57 year old female with a 10 mm incidental aneurysm in the right middle cerebral artery. This study was performed following protocols approved by our institutional review boards.
2.2. In-vivo Marking and Harvesting of IA Tissue
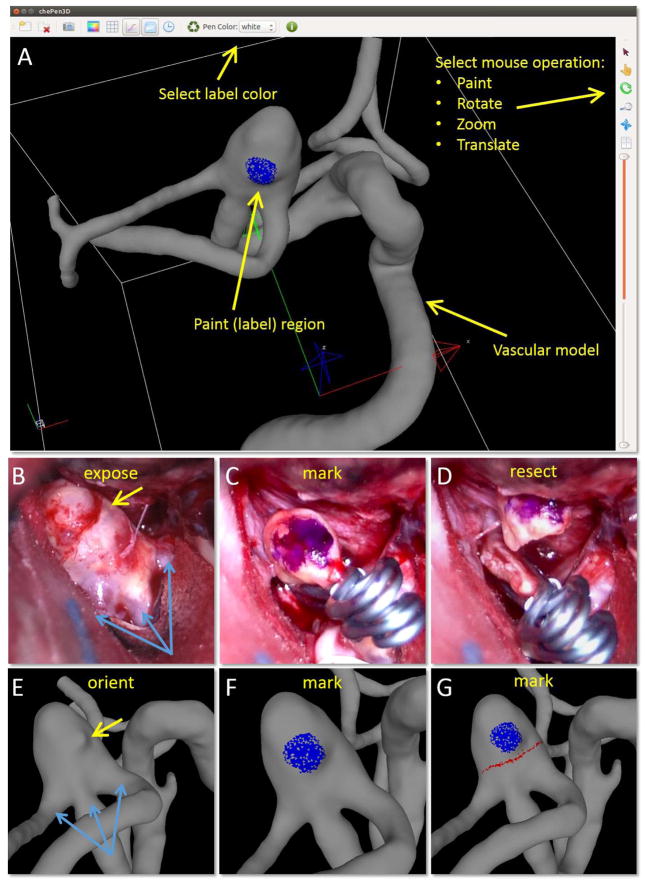
During surgery, after exposing the aneurysm and placing the clip(s), the aneurysm dome is marked with a surgical pen to provide reference marks for mapping, Figure 1. The dome is then resected and the harvested tissue sample is placed in a vial with a 0.9% (w/v) saline solution and transported in an insulated cooler to the University of Pittsburgh for ex-vivo imaging. The sample is fixed in 2% paraformaldehyde for two hours within 12 hours of harvest (Supplementary Material, Figure II).
Figure 1.
Procedure for marking vascular model using a tool (ChenPen3D) for labeling aneurysm features observed during surgery (A): orient vascular model (E) to same alignment as exposed aneurysm (B) using anatomical features for guidance (bleb-yellow arrow, vessels-blue arrows), mark vascular model (F-blue dot) as aneurysm during surgery (C), and delineate clip line on vascular model (G-red line) following the surgical cut (D).
2.3. ChePen3D – A Tool for Recording Clinical Features on the Vascular Model
In order to document the resected region of the aneurysm and later align it to a 3D image-based aneurysm model, a 3D virtual marking tool (ChePen3D) was developed. This tool was implemented in C++, using Qt for the graphical user interface, and OpenGL for 3D graphics. It runs under Linux, Windows (including tablets) and Mac operating systems, and can be used directly in the surgical suite. An Android prototype has also been implemented. This tool loads a patient-specific 3D anatomical model created from pre-operative 3D rotational angiography (3DRA) images. A user friendly interface enables the neurosurgeon to rotate the model and mark regions of interest on the aneurysm surface with different colors (Figure 1A). The marked model is saved to an ASCII file containing the label (color) of each marked triangle.
The following steps are used for each aneurysm sample, (Figure 1). The surgeon loads the 3D IA model and orients it (E) to a view similar to the intra-operative view (B), using anatomical features such as vessels and aneurysm shape characteristics (e.g. blebs) for guidance. Then, he/she places marks on the model (F, blue dot) analogous to the marks drawn in-vivo with the surgical pen (C), and then delineates the clipped region (D) on the model (G, red line). This information is later used to align the tissue sample to the virtual IA model.
2.4. Creation of Virtual Model of IA Sample on 3D-printed Vascular Model
Manufacture of 3D-printed Model of Aneurysm
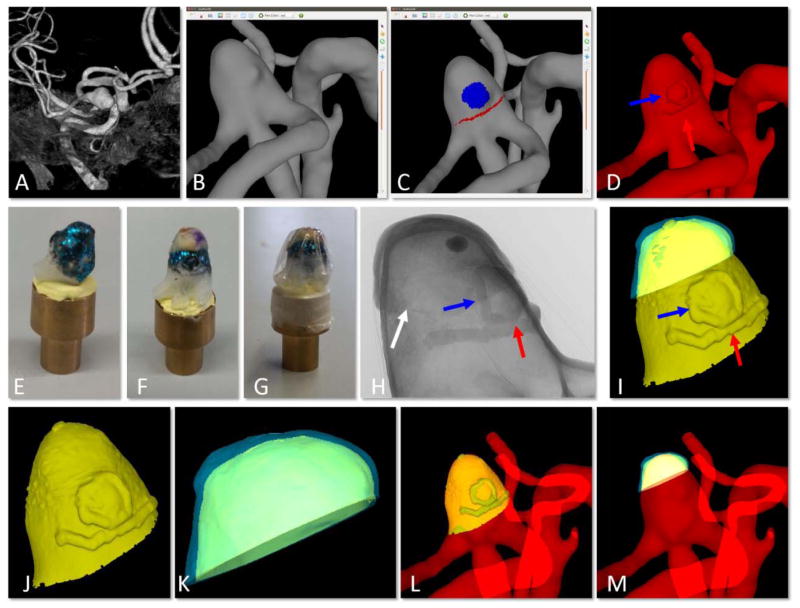
Data generated in ChenPen3D for the marked 3D vascular model, Figure 2C, is exported in STL format and imported into GeoMagic (3D-Systems, Rock Hill, SC) where it is edited to create a virtual IA model with a portion of the neighboring vessels. The clinical markings are included as regions of increased elevation from the surface (red and blue arrows in Figure 2D). To compensate for shrinkage during tissue fixation, the marked 3D model is scaled down by 15% prior to additive manufacturing. A hollow model is created with an average thickness of 242±24μm to reduce scattering from the 3D model during micro-CT scanning. The physical 3D IA model is then printed using a stereo-lithography system (Viper SLA), operating at a resolution of 0.025 mm.
Figure 2.
Creation of virtual model of physical tissue sample on virtual 3D-printed IA model and alignment to 3D vascular model. A) pre-operative 3D image, B) reconstruction of vascular model from 3D image, C) ChenPen3D image, with clinical features noted as explained in Figure 1, D) introduction of small extrusions visible in the 3D-printed model for later alignment (red and blue arrows point to extrusions corresponding to red and blue markings in C, white arrow points to small incision made to reference MPM imaging regions), E) 3D-printed aneurysm model with metallic coating, F) tissue sample placed on 3D-printed IA aligned using markings on tissue and small extrusions, G) wrapping to prevent dehydration, H) 2D image of micro-CT scan of tissue sample mounted on 3D-printed aneurysm shown in G, I) reconstruction of combined virtual model of 3D-printed IA and tissue sample from micro-CT data, J) segmentation of virtual 3D-printed aneurysm, K) segmentation of virtual tissue sample, L) alignment of virtual 3D-printed IA back to 3D vascular model showing alignment of extruded features, and M) final alignment of virtual tissue sample to original vascular model (B) using prior alignments in (I) and (L).
Micro-CT Scanning and Reconstruction
The 3D-printed IA model is coated with paint comprised of 0.002×0.008μm hex-cut metallic flakes (KUS MSF15-2Z, TCP Global Corporation) to distinguish the inner tissue surface from the 3D-printed model in the micro-CT images1. Mounting Clay (Renishaw Inc.) is used to fix the model to a brass mount compatible with CT scanning, Figure 2F. The physical IA sample is mounted on the coated IA model and covered with a plastic wrap (Glad Products Company) to ensure that the sample remained hydrated throughout the scan, Figure 2(G–H). This material was found to provide little or no artifacts during scanning. A high resolution Skyscan 1272, 11Mp micro-CT scanner (Bruker Corporation) is used to image the 3D-printed IA model with the mounted specimen. The following settings provide clear visualization of the raised markings and the boundary between tissue and 3D-printed model, Figure 2H: camera pixel size of 7.4μm, image pixel size of 10μm, frame averaging of 10 with a rotation step size of 0.4°, scanned 180° around the vertical axis. A 3D image is reconstructed as a stack of 10μm thick sections in the axial plane.
Image Processing, Analysis and Virtual Model Creation
The micro-CT reconstruction of the tissue mounted on the 3D-printed IA model is used to generate a virtual sample (Figure 2I, blue surface) mounted on a virtual IA model (yellow surface). Specifically, the reconstructed BMP files from the micro-CT scan are imported into CT-Analyzer (Bruker Corporation) to segment the IA tissue and 3D-printed model as separate structures. This is accomplished by manually selecting volumes of interest for the tissue and the 3D model, thresholding the images, and creating a surface mesh using marching cubes. The surface is decimated and smoothed to create a uniform mesh using GeoMagic. The inner and outer surfaces are separated by trimming the virtual sample with cut-planes.
2.5. Mapping of Virtual IA Sample to Full Vascular Model
Once the virtual IA model and virtual sample are separated, Figure 2(J–K), the virtual IA model is mapped back to the 3D vascular model using the extrusions for co-registration (L). The mapping between the virtual sample and virtual IA is already known (I) and so the alignment for the virtual sample to the original 3D model follows directly, (M).
Once the virtual specimen is aligned to the 3D vascular model, it is used as a common surface for comparing wall properties measured ex-vivo on the physical tissue sample and biomechanical properties calculated on the 3D vascular model.
2.6. Verification of Sample Orientation
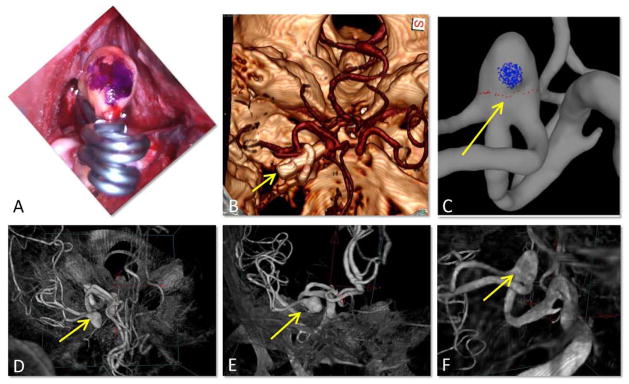
The mark (blue dot) placed on the aneurysm during surgery is typically aligned with the end of the clip from the intra-operative view of the surgeon, Figure 3A. A volume rendered post-operative CT image (Figure 3B) shows the clip and the cerebral arteries and allows us to identify the neurosurgeon’s intra-operative line of sight (yellow arrow), which was used to mark the vascular model (C). This intra-operative view is identified in a volume rendering of the 3DRA image used to reconstruct the vascular model (D, yellow arrow). Gradual rotation of the 3DRA image allows us to verify that the marks were placed on the expected side of the aneurysm (E–F). This procedure eliminates possible ambiguities in the circumferential orientation of the resected sample.
Figure 3.
Verification of sample orientation: A) surgical mark (blue dot) aligned with clip ends, B) post-operative CT image showing the clips, yellow arrow points in the line of sight of the surgeon (as in A), C) vascular model with virtual marks, D, E, F) Gradual rotation of the pre-operative 3DRA image from the CTA view point to the surgeon’s view point, verifying correct placement of the virtual marks on the vascular model.
3. Methods for Quantification of Aneurysm Characteristics
3.1. Flow Dynamics
CFD models of the aneurysm are constructed from 3DRA images using previously developed techniques3. Unstructured grids are generated with a minimum resolution of 0.2 mm. Solutions of the 3D incompressible Navier-Stokes equations are obtained with a finite element solver. Blood is approximated as a Newtonian fluid with density ρ=1.0 g/cm3 and viscosity μ=0.04 Poise, vessel wall compliance is neglected, and pulsatile flows are imposed at inlet (internal carotid artery). Inflow rates are derived from measurements in normal subjects and scaled with the vessel diameter following Murray’s law4. Outflow boundary conditions are prescribed to achieve flow divisions consistent with Murray’s law. Flow variables such as wall shear stress (WSS) and oscillatory shear index (OSI) are computed on the aneurysm surface.
Image-based CFD simulations in IA have been validated by us and others using in vitro models10, 21 and qualitatively compared to in-vivo angiography6, 11. Studies comparing rigid-walled CFD calculations against models incorporating wall motion estimated from dynamic angiography suggest that wall motion does not have a significant effect on the intra-aneurysmal flow dynamics and the WSS distribution, although the exact values of WSS can be slightly over estimated8, 26.
Blood is composed of plasma and numerous cellular elements and proteins. Red blood cells, which carry the largest volume fraction of these elements and largely determine the macroscopic blood viscosity, measure about 6–8μm in diameter and are highly flexible. In blood vessels on the order of millimeters or larger, as in the present study (smallest vessel diameter was 0.7 mm), blood is typically modeled as a single phase, homogeneous fluid24.
The Newtonian fluid idealization neglects shear thinning and viscoelastic properties of blood. If the shear rate is sufficiently low, red blood cells can combine to create complex 3D microstructures that increase the viscosity and can also store energy providing a viscoelastic nature to blood. Dissolution of these microstructures is the main factor responsible for the blood shear thinning behavior. While this dissolution takes on the order of a second, the formation takes much longer, 20–200 sec in flows with shear rates of 0.01–1.0 1/s24. Prior to entering the aneurysm, blood has experienced shear rates (>50 1/s) at which these structures are broken apart. Thus, in the absence of a region of closed circulation within the aneurysm dome, there would not be enough time for these microstructures to form and lead to higher viscosities and viscoelastic properties. For the aneurysm considered here the mean shear rate was 254 1/s (range: 13–1254 1/s) and there were no closed regions where the blood is exposed to the lowest shear rates for even a few seconds. Therefore, neglecting the shear thinning and viscoelastic response is reasonable.
Mesh convergence was studied with three mesh resolutions: 1) coarse mesh: 0.2 mm, 3.5×10⁶ elements, 2) medium mesh: 0.1 mm, 27.7×10⁶ elements, 3) fine mesh: 0.07 mm, 68.4×10⁶ elements. Simulations were performed on each grid with 100 and 400 timesteps per cardiac cycle for 5 cycles. The mean WSS (averaged over the aneurysm) changed only by 3% from cycle 1 to 2, but the change between cycle 2 and consecutive cycles was less than 1%, for all grids and timesteps. The mean WSS changed by less than 0.5% with 400 timesteps/cycle instead of 100. The difference in mean WSS obtained with the different grids was less than 5–6%. However, when averaging the WSS over smaller regions (see section 4.2), larger variability was observed. In 9/11 of these regions the changes between the medium and the fine grids were below 10%, but in 2/11 regions (region 1 and 2) the changes were significantly larger (30–50%). Therefore, these two regions were excluded from correlation analysis, and data obtained from the second cycle on the medium grid with 400 timesteps/cycle were analyzed.
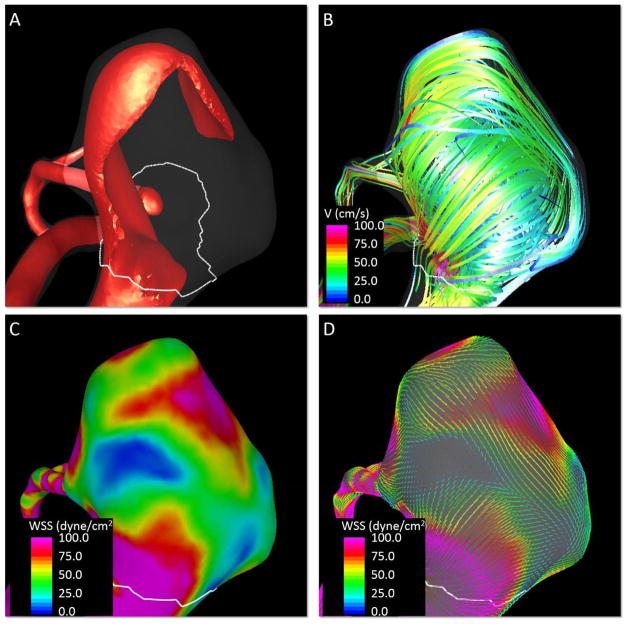
Visualizations of the inflow jet, intra-saccular flow pattern and WSS distributions at peak systole are presented in Figure 4. These visualizations show a high speed jet impacting on the dome of the aneurysm and creating a complex flow structure with a heterogeneous WSS distribution with regions of high and low WSS.
Figure 4.
Quantification of aneurysm flow characteristics at peak systole. A) Visualization of aneurysm inflow jet, B) visualization of aneurysm streamlines, C) contours of wall shear stress magnitude, D) visualization of wall shear stress vectors.
3.2. Wall Thickness
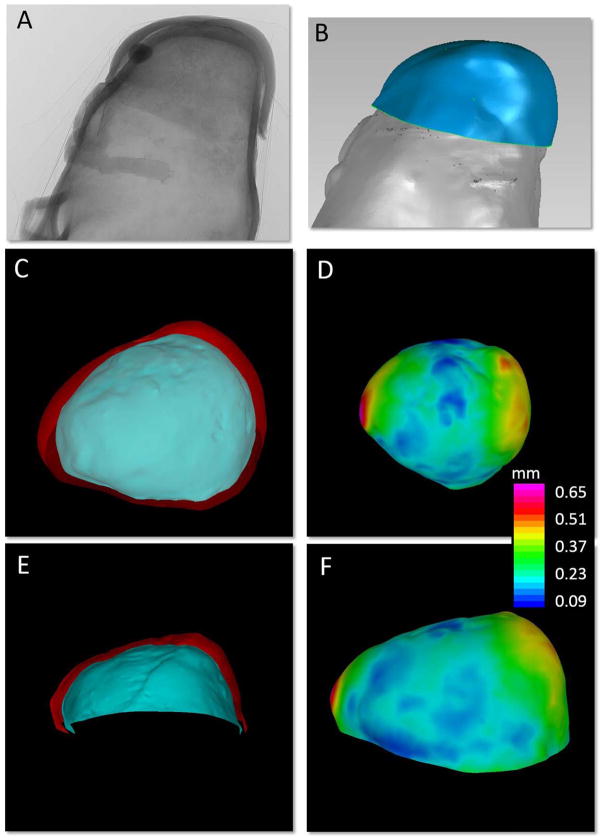
The local wall thickness (WT) is calculated directly from the virtual IA sample obtained from the high resolution micro-CT (Figure 5). The reconstructed surface is decimated to reduce the number of triangles and split to separate the inner and outer surfaces of the tissue. The surface triangulations are smoothed using a non-shrinking algorithm and optimized using edge collapses and diagonal swaps3. Then, the distance map between these surfaces is calculated for each point of the inner surface by searching for the closest triangle of the outer surface and computing the corresponding normal distance.
Figure 5.
Quantification of sample wall thickness. A) 2D projected micro-CT image of tissue sample mounted on 3D-printed aneurysm model, B) segmented virtual IA sample and virtual 3D-printed aneurysm, C, E) inner (blue) and outer (red) surfaces of the tissue sample, and D, F) contour map of wall thickness distribution, thickness computed as the distance map between the inner and outer surfaces of the virtual tissue sample.
3.3. Collagen Fiber Diameter and Orientation
Ex-vivo MPM is used to image collagen fibers in the aneurysm wall of the intact IA sample5, 23. A holder was created from a styrofoam block with a cavity well slightly larger than the aneurysm sample. The sample is placed in the well with the region of interest facing the MPM lens, submerged in saline, covered with a cover slip, and imaged under the MPM. An Olympus FV1000 MPE (Tokyo, Japan) with a 1.12 NA 25x MPE water immersion objective is used with a Spectra-Physics DeepSee Mai Tai Ti-Sapphire laser (Newport, Mountain View, CA) using an excitation wavelength of 870 nm to elicit second harmonic generation from the collagen fibers. The SHG signal is collected using a 400 nm emission filter with a 750 spectral bin (Brattleboro, VT). The MPM data consists of a stack of 1024×1024 pixel images with an in plane resolution of 0.497μm and a 2μm separation between layers. Images are obtained relative to a marking (cut) that is added to the physical IA tissue prior to micro-CT scanning, Figure 2H.
Stacks of MPM images are superimposed with ImageJ25 using maximum intensity projections (MIP), imported into Matlab (MathWorks Inc., Natick, MA), and the fiber orientation distribution at different depths from the abluminal surface is quantified using a custom program23. The fiber angle is computed using an edge detection algorithm applied to fibers within a region of interest14. The dominant fiber direction in predefined sub-regions (12×12 pixels, 5.96μm × 5.96μm) of an MPM image is computed from maximum pixel intensity gradient. The gradient measure associated with the dominant direction of each sub-region is accumulated in directional bins [−90°, 90°) to form an orientation distribution histogram. Each histogram is normalized to the maximum magnitude in all directions. The set of histograms across the scan depth are then used to create colormaps of fiber orientation as a function of distance from the imaging surface. Fiber diameters were measured at 15 randomized points chosen from a 5×5 matrix in each superimposed stack of MPM images employing a custom MATLAB code23. Diameters were measured using the straight line function of ImageJ. In cases where fibers banded, diameters of individual fibers were used.
4. Example Results
4.1. Fiber Characteristics in Regions of High and Low Wall Shear Stress
Biological studies of the IA sample are typically highly localized and time consuming. They can also be expensive. Therefore, it can be desirable to analyze regions of interest that have been previously identified from studies on the full vascular model (e.g. flow dynamics or intramural stresses). Here, we describe how our mapping approach can be used to implement such studies.
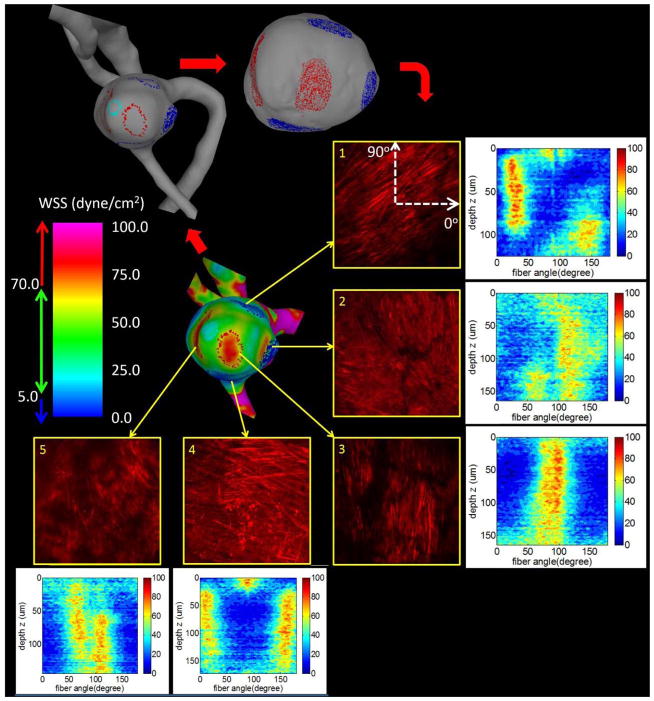
In this example, pathological regions of abnormally high mean WSS (>70 dyne/cm2) and low mean WSS (<5 dyne/cm2) are identified in the CFD model and corresponding regions are marked on the virtual tissue sample using ChenPen3D to define the locations for MPM analysis, (Figure 6, upper right). Here, the red/blue markings correspond to the high/low WSS regions. These regions are then imaged from the abluminal side with MPM and collagen fiber orientations in the regions are quantified (Section 3.3). The pictures show MIP projections of the MPM image stacks across the thickness of the wall. Colormaps of the histograms for each imaging depth show how the fiber orientation varies from the surface (advential side) moving down through the wall thickness. In this illustrative example, only one side of the wall was imaged to avoid destructively sectioning the wall necessary for imaging from the lumen side. The imaging depth from the abluminal surface is approximately 100μm, though depends on the density of the collagen fibers in the region of interest.
Figure 6.
Assessment of collagen fiber architecture in regions of low (blue) and high (red) WSS. Five regions of hemodynamic interest are identified on the surface of the CFD model and marked on the vascular model (top left) and virtual tissue sample (top right). These selected regions are then imaged with MPM. Projected MPM stacks are shown along with corresponding histograms of fiber orientations as a function of the imaging depth from the abluminal side.
Qualitatively, collagen fibers imaged from the abluminal side of the aneurysm wall in the regions of normal to low WSS (regions 1, 2 and 4) had a more coherent structure with fibers in two principal orientations. In contrast, fibers in regions of high WSS (regions 3 and 5) had a more pathological appearance compared to a normal artery23, showing fibers aligned in one main direction (especially region 3) and gaps between fibers.
4.2. Correlating Hemodynamic Loads and Wall Characteristics
The second and third examples illustrate studies in which the measurement regions are chosen on the physical sample and related to results on the vascular model using the intermediate virtual IA sample. Specifically, we compare flow and wall characteristics at a set of sub-regions regularly distributed across the resected tissue sample.
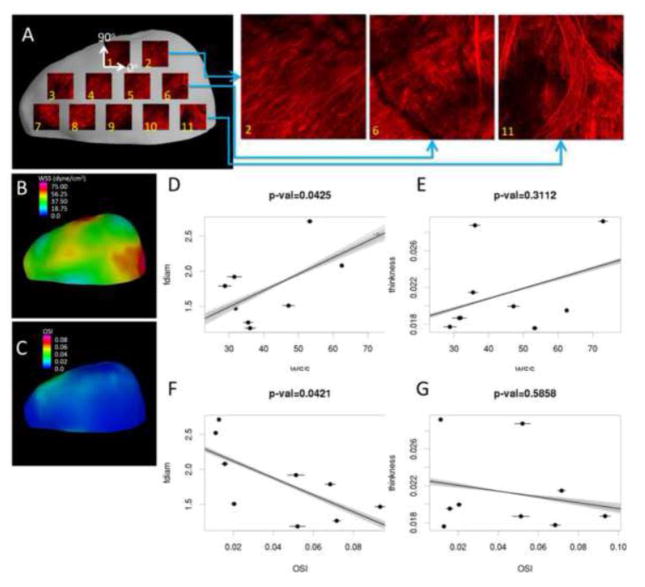
In the second example, possible connections between collagen fiber diameter and WT to WSS and OSI are explored. A series of 500×500μm MPM images are acquired regularly distributed on the surface of the resected dome (Figure 7A). The measurement locations are marked on the corresponding virtual tissue sample using ChePen3D. Mean values of fiber diameter are calculated from the MPM dataset using previously described methods23 and mapped back to the virtual IA sample. WT is calculated over each region directly from the virtual IA sample. The WSS and OSI fields are interpolated from the CFD mesh to the virtual IA sample (B, E) and averaged over each region. Scatter plots of fiber diameter and WT against WSS and OSI are created and corresponding linear regressions are calculated (C, D, F, and G).
Figure 7.
Comparing collagen fiber diameter and wall thickness with mean WSS and OSI. Physical tissue sample is MPM imaged in a grid pattern and results are mapped back to virtual tissue sample (A). WSS and OSI results are mapped to the virtual tissue sample reconstruction (B, E). Mean WSS and OSI are plotted against mean fiber diameter and wall thickness for each region (C, D, E, and F). Error bars indicate variability of hemodynamic parameters with respect to different tissue alignments. Lines illustrate variability of linear regressions for different tissue sample alignments.
Estimation of Uncertainties Associated with Alignment
In order to estimate the uncertainties associated with the alignment of the tissue sample to the vascular model, the virtual IA sample is randomly rotated around its centroid by an angle in the range ±2.5° and the hemodynamic fields are re-interpolated to the newly positioned virtual tissue sample. The process is repeated 100 times and the mean and standard deviation of hemodynamic variables are computed for each region. Variability of hemodynamic quantities with respect to random variations in tissue alignment are shown in Figure 7 as error bars in the scatter plots. The gray lines correspond to the 100 linear regressions and the black lines represent the linear regression of the mean values, to illustrate the variability of the correlations.
The 5° angle amplitude around the original aligned position was chosen visually to represent reasonable subjective misalignments. With this choice, the interpolated regions of interest for quantification of the CFD variables were displaced on the model surface by at most one region diameter.
Quantitative results of this uncertainty analysis are presented in Table 1. It can be seen that the WSS variability was below 6%. The OSI variability ranged from about 2% up to 10%. However, both variabilities were markedly smaller than the relative change of WSS or OSI between the different regions. This suggests that with the current level of accuracy of the mapping strategy, it should be able to detect possible associations between hemodynamic variables and wall properties.
Table 1.
Regional characteristics of the resected tissue sample (collagen fiber diameter and wall thickness) and variability of WSS and OSI over 100 random rotations of the virtual tissue sample around its initial alignment.
| Region | Fiber Diameter (μm) | Wall Thickness (mm) | WSS (dyne/cm2) | OSI | ||
|---|---|---|---|---|---|---|
| Mean | % Variation | Mean | % Variation | |||
| 1 | 1.4 | 0.225 | 19.7 | 3.38% | 0.119 | 3.05% |
| 2 | 1.49 | 0.292 | 17.2 | 0.30% | 0.102 | 6.62% |
| 3 | 1.79 | 0.177 | 28.8 | 6.27% | 0.068 | 3.78% |
| 4 | 1.27 | 0.215 | 35.5 | 3.93% | 0.072 | 2.75% |
| 5 | 1.47 | 0.187 | 31.9 | 0.95% | 0.093 | 2.77% |
| 6 | 1.19 | 0.288 | 36.1 | 4.15% | 0.052 | 7.42% |
| 7 | 1.92 | 0.187 | 31.5 | 6.41% | 0.051 | 8.08% |
| 8 | 1.51 | 0.200 | 47.2 | 3.52% | 0.020 | 5.99% |
| 9 | 2.71 | 0.176 | 53.3 | 1.44% | 0.013 | 3.20% |
| 10 | 2.08 | 0.225 | 62.5 | 0.50% | 0.016 | 10.70% |
| 11 | 2.52 | 0.292 | 73.0 | 1.84% | 0.011 | 9.50% |
In this illustrative example, fiber diameter increased with increasing WSS (p=0.0425) and decreased with increasing OSI (p=0.0421). These promising results should be further investigated with more samples. Qualitatively, collagen fibers look well organized in region 2 where the WSS reaches normal values, while in regions 6 and 11 the WSS is higher and the collagen fibers look more inhomogeneous and disorganized.
4.3. Connecting Fiber and Wall Shear Stress Directions
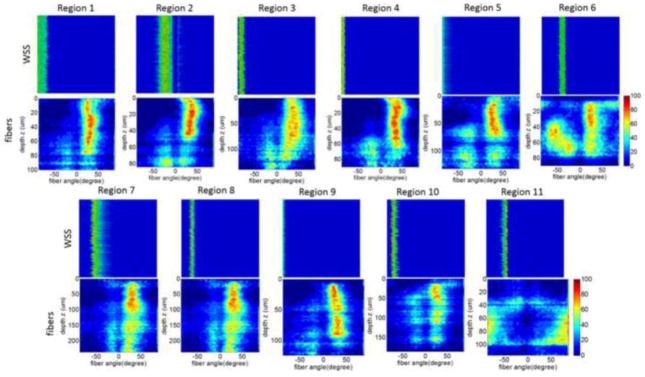
In this third example, the distribution of collagen fiber orientation in the sub-regions of Section 4.2 are compared with the corresponding directions of WSS vectors on the aneurysm surface. Colormaps of the histograms (frequency) of fiber direction through the thickness of the wall are shown in Figure 8 for each region. Corresponding histograms of WSS directions are shown next to the fiber direction histograms. In the case of WSS direction, the vertical axis of the colormaps represent the variability of the histogram for different random alignments of the virtual tissue sample. It can be seen that the random rotations of the virtual tissue sample do not have a substantial effect on the histograms of WSS orientation.
Figure 8.
Comparing collagen fiber orientation with WSS orientation at selected regions of the dome as in Figure 7. Fiber orientation histograms for different depths (vertical axis) are presented as colormaps for each region of the tissue sample (bottom row). Colormaps of orientation of WSS vector for different sample alignments (vertical axis) next to the fiber orientations for each region.
Quantitative results of collagen fiber orientation (α) and WSS (β) direction are presented in Table 2. Two central collagen fiber directions were observed from the adventitial side: a dominant direction (α1) present throughout the entire depth of the scan (red regions in Figure 8) and a secondary direction (α2) more important towards the luminal side. On average, these two fiber directions form an angle close to α1-2=50° (median=48°, 95% CI=36–57°). This multi-directional nature of fibers is consistent with prior reports based on polarized light microscopy of fixed aneurysm dome sections15. In that study, fibers were seen to change orientation with depth, sometimes monotonically and sometimes non-monotonically shifting back and forth between orientations. In our own aneurysm bank we have observed both types of walls (unpublished data) as well as walls with no dominant directions such as some regions of the aneurysm studied here.
Table 2.
Orientation of collagen fibers (α1, α2: main directions, α1-2: angle between main directions, αmean: mean fiber direction); and WSS direction (β) as well as angular distance with respect to mean fiber direction Δ(β,αmean)for different regions of the tissue sample imaged with MPM. Orientation angles correspond to the location of the histogram maxima or more frequent angles in the corresponding histograms of Figure 8.
| Region | Fiber Direction (°) | WSS Direction (°) | ||||
|---|---|---|---|---|---|---|
| α1 | α2 | α1-2 | αmean | β | Δ(β,αmean) | |
| 1 | 29 | −20 | 59 | 4.5 | 90 | 86 |
| 2 | 35 | −20 | 55 | 7.5 | −23 | 30 |
| 3 | 31 | −15 | 46 | 8 | −83 | 91 |
| 4 | 36 | −15 | 51 | 10.5 | −85 | 95 |
| 5 | 29 | −23 | 52 | 3 | 90 | 87 |
| 6 | 22 | −56 | 78 | −17 | −41 | 24 |
| 7 | 29 | −13 | 42 | 8 | −54 | 62 |
| 8 | 24 | −12 | 36 | 6 | −66 | 72 |
| 9 | 29 | −23 | 52 | 3 | 90 | 87 |
| 10 | 23 | −21 | 44 | 1 | −76 | 77 |
| 11 | 90 | - | 0 | 0 | −45 | 45 |
We also found WSS vectors roughly perpendicular to the mean fiber direction (Δ(β,αmean,), median=71°, 95% CI=53–87°). The influence of fluid flow on remodeling of the medial layers is well established15. While we expect that altered flow parameters could lead to abnormal collagen architecture such as that seen in region 11 associated with elevated WSS, our finding that fiber alignment is related to WSS direction is surprising, and should be further investigated in larger studies.
5. Discussion
Information about the biological responses to hemodynamics that affect the structure of the aneurysm wall and consequently its mechanical behavior and strength is crucial to advance our understanding of the processes governing aneurysm progression and rupture. The methodology introduced here can be used to relate local simulation-based biomechanical data to local ex-vivo experimentally derived tissue data, and thereby provides an approach to address the heterogeneous nature of biological changes associated with this disease.
This approach is based on in-vivo tissue marking when harvesting, analogous marking of 3D vascular model, 3D printing of vascular model, mounting the resected tissue on the 3D-printed model and micro-CT imaging, and alignment of the virtual IA sample back to the vascular model for interpolation of flow fields. The 3D printing with highlighted features visible in the micro-CT images allows us to easily and unambiguously map the micro-CT reconstruction of the resected tissue (virtual IA sample) back to the vascular model used for CFD analysis. Furthermore, the mounting of the resected tissue on a 3D model based on pre-operative geometry prevents tissue collapse and enables alignment of the physical tissue on the aneurysm model. However, there are two subjective steps in our approach: i) the virtual marking of the vascular model by the neurosurgeon to identify anatomical landmarks and marks made in-vivo prior to resection, and ii) the mounting of the resected tissue on the 3D-printed model using these markings and other anatomical landmarks for guidance. These subjective steps may introduce uncertainties in the final alignment of the virtual tissue sample and the 3D vascular model. The importance of such alignment uncertainties will depend on the patient-specific flow fields. We introduced a methodology for quantifying uncertainties in hemodynamic metrics associated with specified ranges of uncertainty in alignment. In our representative case, we found the variability of regionally averaged hemodynamic variables subject to a 5° alignment uncertainty to be smaller than the differences of these variables from region to region. This implies that it is possible to detect regional differences in local hemodynamic conditions and search for associations with local wall properties.
The mesh refinement analysis indicated that some aneurysm regions located near the flow impingement point had large variability between meshes of different resolutions. The reason is that with increasing resolution, the inflow jet slightly shifted causing large changes in these small regions, which were therefore excluded from the analysis. This suggests that in some aneurysms with highly unsteady or unstable flows it may not be possible to calculate reliable hemodynamic variables in small areas located in regions with large flow fluctuations. Future studies should perform mesh refinement analysis to assess the reliability of local hemodynamic quantities, and investigate if other aspects of the flow such as existence of unstable jets are important in such regions.
While in the current work, the methodology was described and demonstrated on data from a single patient, it should be noted that this test case was not trivial since the hemodynamic fields were not homogeneous over the dome. Therefore the results could have been significantly affected by changes in the tissue and vascular model alignment. We anticipate there will be cases where it may not be possible to obtain reliable alignments, for example if the dome is nearly spherical, or if the sample is very small, or if for clinical or geometrical reasons it is not possible to use the surgical pen to place marks that help orient the resected sample. Even when marking the sample is not possible, there may be other landmarks (e.g. blebs, calcifications, high curvature regions) that can be used to align the sample. However, an exact alignment may not be vital in many cases, for example in aneurysms with relatively uniform hemodynamic and/or wall characteristics. In a larger study using this approach, we will assess the percentage of aneurysm domes that can be aligned with confidence. Furthermore, larger studies with more samples are needed to draw definite conclusions about the relationships between local hemodynamics and wall structure.
In conclusion, a methodology was introduced to study the relationship between local hemodynamics and local wall properties in different regions of resected aneurysm domes. While this method was illustrated with hemodynamic data, it can equally well be used for studies of intramural stresses. This is a topic of ongoing work. Thus, this strategy enables, for the first time, the direct study of the local mechano-biological mechanisms of human IAs.
Supplementary Material
Overview of mapping strategy: 1) tissue marking and harvesting, 2) construction of vascular model, 3) 3D printing of vascular model, 4) mounting resected sample on 3D printed aneurysm model and micro-CT scanning, 5) alignment of virtual tissue sample to vascular model.
Surgical procedure: exposure of the aneurysm (A), clip(s) placement (B, C), marking with surgical pen (D), aneurysm resection (E, F), and fresh resected sample with mark (G, H).
Acknowledgments
This work was supported by NIH grant R21NS080031.
We thank Mary Barbe, Director of Micro-CT Core and Imaging Center at Temple University School of Medicine, for advice on biological tissue imaging; and George Stetton, Professor of Bioengineering, University of Pittsburgh, for valuable discussions on the virtual IA sample.
References
- 1.Barbe MF, Adiga R, Gordiienko O, Pleshko N, Selzer ME, Krynska B. Microcomputed tomography assessment of vertebral column defects in retinoic acid-induced rat model of myelomeningocele. Birth Defects Res A Clin Mol Teratol. 2014;100:453–462. doi: 10.1002/bdra.23254. [DOI] [PubMed] [Google Scholar]
- 2.Broderick JP, Brown RD, Jr, Sauerbeck L, Hornung R, Huston J, 3rd, Woo D, Anderson C, Rouleau G, Kleindorfer D, Flaherty ML, Meissner I, Foroud T, Moomaw EC, Connolly ES. Greater rupture risk for familial as compared to sporadic unruptured intracranial aneurysms. Stroke. 2009;40:1952–1957. doi: 10.1161/STROKEAHA.108.542571. [DOI] [PMC free article] [PubMed] [Google Scholar]
- 3.Cebral JR, Castro MA, Appanaboyina S, Putman CM, Millan D, Frangi AF. Efficient pipeline for image-based patient-specific analysis of cerebral aneurysm hemodynamics: Technique and sensitivity. IEEE Trans Med Imag. 2005;24:457–467. doi: 10.1109/tmi.2005.844159. [DOI] [PubMed] [Google Scholar]
- 4.Cebral JR, Castro MA, Putman CM, Alperin N. Flow-area relationship in internal carotid and vertebral arteries. Physiol Meas. 2008;29:585–594. doi: 10.1088/0967-3334/29/5/005. [DOI] [PMC free article] [PubMed] [Google Scholar]
- 5.Cebral JR, Duan X, Chung BJ, Putman CM, Aziz K, Robertson AM. Wall mechanical properties and hemodynamics of unruptured intracranial aneurysms. AJNR Am J Neuroradiol. 2015;36:1695–1703. doi: 10.3174/ajnr.A4358. [DOI] [PMC free article] [PubMed] [Google Scholar]
- 6.Cebral JR, Pergolizzi R, Putman CM. Computational fluid dynamcis modeling of intracranial aneurysms: qualitatively comparison with cerebral angiography. Academic Radiology. 2007;14:804–813. doi: 10.1016/j.acra.2007.03.008. [DOI] [PubMed] [Google Scholar]
- 7.Costalat V, Sanchez M, Ambard D, Thines L, Lonjon N, Nicoud F, Brunel H, Lejeune JP, Dufour H, Bouillot P, Lhaldky JP, Kouri K, Segnarbieux F, Maurage CA, Lobotesis K, Villa-Uriol MC, Zhang C, Frangi AF, Mercier G, Bonafe A, Sarry L, Jourdan F. Biomechanical wall properties of human intracranial aneurysms resected following surgical clipping (IRRAs Project) J Biomech. 2011;44:2685–2691. doi: 10.1016/j.jbiomech.2011.07.026. [DOI] [PubMed] [Google Scholar]
- 8.Dempere-Marco L, Oubel E, Castro MA, Putman CM, Frangi AF, Cebral JR. CFD analysis incorporating the influence of wall motion: application to intracranial aneurysms. Med Image Comput Comput Assist Interv. 2006;9:438–445. doi: 10.1007/11866763_54. [DOI] [PubMed] [Google Scholar]
- 9.Erhart P, Grond-Ginsbach C, Hakimi M, Lasitschka F, Dihlmann S, Bockler D, Hyhlik-Durr A. Finite element analysis of abdominal aortic aneurysms: predicted rupture risk correlates with aortic wall histology in individual patients. J Endovasc Ther. 2014;21:556–564. doi: 10.1583/14-4695.1. [DOI] [PubMed] [Google Scholar]
- 10.Ford MD, Nikolov HN, Milner JS, Lownie SP, DeMont EM, Kalata W, Loth F, Holdsworth DW, Steinman DA. PIV-measured versus CFD-predicted flow dynamics in anatomically realistic cerebral aneurysm models. J Biomech Engr. 2008;130 doi: 10.1115/1.2900724. 021015-021011/021019. [DOI] [PubMed] [Google Scholar]
- 11.Ford MD, Stuhne GR, Nikolov HN, Habets DF, Lownie SP, Holdsworth DW, Steinman DA. Virtual angiography for visualization and validation of computational models of aneurysm hemodynamics. IEEE Trans on Medical Imaging. 2005;24:1586–1592. doi: 10.1109/TMI.2005.859204. [DOI] [PubMed] [Google Scholar]
- 12.Frosen J. Smooth muscle cells and the formation, degeneration, and rupture of saccular intracranial aneurysm wall--a review of current pathophysiological knowledge. Transl Stroke Res. 2014;5:347–356. doi: 10.1007/s12975-014-0340-3. [DOI] [PubMed] [Google Scholar]
- 13.Groen HC, van Walsum T, Rozie S, Klein S, van Gaalen K, Gijsen FJ, Wielopolski PA, van Beusekom HM, de Crom R, Verhagen HJ, van der Steen AF, van der Lugt A, Wentzel JJ, Niessen WJ. Three-dimensional registration of histology of human atherosclerotic carotid plaques to in-vivo imaging. J Biomech. 2010;43:2087–2092. doi: 10.1016/j.jbiomech.2010.04.005. [DOI] [PubMed] [Google Scholar]
- 14.Hill MR, Duan X, Gibson GA, Watkins S, Robertson AM. A theoretical and nondestructive experimental approach for direct inclusion of measured collagen orientation and recruitment into mechanical models of the artery wall. J Biomech. 2012;45:762–771. doi: 10.1016/j.jbiomech.2011.11.016. [DOI] [PMC free article] [PubMed] [Google Scholar]
- 15.Humphrey JD, Canham PB. Structure, Mechanical Properties, and Mechanics of Intracranial Saccular Aneurysms. Journal of Elasticity. 2000;61:49–81. [Google Scholar]
- 16.Investigators T. I. S. o. U. I. A. Unruptured intracranial aneurysms--risk of rupture and risks of surgical intervention. N Engl J Med. 1998;339:1725–1733. doi: 10.1056/NEJM199812103392401. [DOI] [PubMed] [Google Scholar]
- 17.Juvela S, Porras M, Poussa K. Natural history of unruptured intracranial aneurysms: probability of and risk factors for aneurysm rupture. J Neurosurg. 2008;108:1052–1060. doi: 10.3171/JNS/2008/108/5/1052. [DOI] [PubMed] [Google Scholar]
- 18.Meng H, Swart DD, Wang Z, Hoi Y, Kolega J, Metaxa EM, Szymanski MP, Yamamoto J, Sauvageau E, Levy EI. A model system for mapping vascular responses to complex hemodynamics at arterial bifurcations in vivo. Neurosurgery. 2006;59:1094–1101. doi: 10.1227/01.NEU.0000245599.92322.53. [DOI] [PMC free article] [PubMed] [Google Scholar]
- 19.Morita A, Fujiwara S, Hashi K, Ohtsu H, Kirino T. Risk of rupture associated with intact cerebral aneurysms in the Japanese population: a systematic review of the literature from Japan.[see comment] Journal of Neurosurgery. 2005;102:601–606. doi: 10.3171/jns.2005.102.4.0601. [DOI] [PubMed] [Google Scholar]
- 20.Morita A, Kimura T, Shojima M, Sameshima T, Nishihara T. Unruptured intracranial aneurysms: current perspectives on the origin and natural course, and quest for standards in the management strategy. Neurol Med Chir (Tokyo) 2010;50:777–787. doi: 10.2176/nmc.50.777. [DOI] [PubMed] [Google Scholar]
- 21.Raschi M, Mut F, Byrne G, Putman CM, Tateshima S, Vinuela F, Tanoue T, Tanishita K, Cebral JR. CFD and PIV Analysis of Hemodynamics in a Growing Intracranial Aneurysm. Int j numer method biomed eng. 2012;28:214–228. doi: 10.1002/cnm.1459. [DOI] [PMC free article] [PubMed] [Google Scholar]
- 22.Rinkel GJ, Djibuti M, van Gijn J. Prevalence and risk of rupture of intracranial aneurysms: a systematic review. Stroke. 1998;29:251–259. doi: 10.1161/01.str.29.1.251. [DOI] [PubMed] [Google Scholar]
- 23.Robertson AM, Duan X, Hill MR, Aziz K, Cebral JR. Diversity in the strength and structure of unruptured cerebral aneurysms. Ann Biomed Eng. 2014;43:1502–1515. doi: 10.1007/s10439-015-1252-4. [DOI] [PMC free article] [PubMed] [Google Scholar]
- 24.Robertson AM, Sequeira A, Kameneva MV. Hemorheology. In: Galdi GP, Rannacher R, Robertson AM, TurekBirkhäuser S, editors. Hemodynamical Flows: Modeling, Analysis and Simulation. 2008. [Google Scholar]
- 25.Schneider CA, Rasband WS, Eliceiri KW. NIH Image to ImageJ: 25 years of image analysis. Nat Methods. 2012;9:671–675. doi: 10.1038/nmeth.2089. [DOI] [PMC free article] [PubMed] [Google Scholar]
- 26.Sforza D, Löhner R, Putman CM, Cebral JR. Hemodynamic analysis of intracranial aneurysms with moving parent arteries: basilar tip aneurysms. IJNMBE Int J Num Meth Biomed Eng. 2010;26:1219–1227. doi: 10.1002/cnm.1385. [DOI] [PMC free article] [PubMed] [Google Scholar]
- 27.Tremmel M, Xiang J, Hoi Y, Kolega J, Siddiqui AH, Mocco J, Meng H. Mapping of vascular response to hemodynamics: applications to an aneurysm initiation model. Biomechanics and Modeling in Mechanobiology. 2011;9:421–434. doi: 10.1007/s10237-009-0185-y. [DOI] [PubMed] [Google Scholar]
- 28.Ujiie H, Tachibana H, Hiramatsu O, Hazel AL, Matsumoto T, Ogasawara Y, Nakajima H, Hori T, Takakura K, Kajiya F. Effects of size and shape (aspect ratio) on the hemodynamics of saccular aneurysms: a possible index for surgical treatment of intracranial aneurysms. Neurosurgery. 1999;45:119–129. doi: 10.1097/00006123-199907000-00028. [DOI] [PubMed] [Google Scholar]
- 29.Wiebers DO, Torner JC, Meissner I. Impact of unruptured intracranial aneurysms on public health in the United States. Stroke. 1992;23:1416–1419. doi: 10.1161/01.str.23.10.1416. [DOI] [PubMed] [Google Scholar]
Associated Data
This section collects any data citations, data availability statements, or supplementary materials included in this article.
Supplementary Materials
Overview of mapping strategy: 1) tissue marking and harvesting, 2) construction of vascular model, 3) 3D printing of vascular model, 4) mounting resected sample on 3D printed aneurysm model and micro-CT scanning, 5) alignment of virtual tissue sample to vascular model.
Surgical procedure: exposure of the aneurysm (A), clip(s) placement (B, C), marking with surgical pen (D), aneurysm resection (E, F), and fresh resected sample with mark (G, H).


