

Abstract
Objectives:
The present study sought to evaluate the effect of electrical stimulation (ES) by using kilohertz frequency on muscle atrophy induced by sepsis.
Methods:
Seventeen male ICR mice were randomly divided into 3 groups: control, lipopolysaccharide (LPS)-injected for 4 days, LPS plus ES (LPS+ES). Sepsis was induced by 4 days of an intraperitoneal LPS injection (10 µg/g body weight/day). LPS+ES animals received the LPS injections and ES twice a day for 4 days. ELISA and western blot analysis determined the plasma levels of inflammatory cytokines and ubiquitinated proteins, while the tibialis anterior muscles were weighed and muscle fiber cross-sectional area (CSA) were measured to assess muscle atrophy, which were analyzed by Student’s t-test and ANOVA.
Results:
LPS induced increased plasma levels of inflammatory cytokines, significant muscle mass loss (LPS:-29.0%, LPS+ES:-23.1%), decreased fiber cross-sectional area, and an up-regulation of atrogin-1 and ubiquitinated proteins in the tibialis anterior muscle compared with the control. ES attenuated the sepsis-induced loss of muscle mass and decreased fiber CSA, as well as attenuated the atrogin-1 and ubiquitinated protein up-regulation.
Conclusions:
Electrical stimulation may prevent sepsis-induced muscle atrophy through ubiquitin-proteasome pathway inhibition.
Keywords: Sepsis, Inflammatory, Muscle atrophy, Electrical Stimulation, Ubiquitin-Proteasome Pathway
Introduction
Skeletal muscle atrophy is associated with morphological changes, including loss of muscle mass1 and reduced cross-sectional area (CSA) of the muscle fibers2. Muscle atrophy can be caused by inflammatory diseases, such as sepsis, cancer, and chronic obstructive pulmonary disease, as well as muscle disuse3,4. Sepsis is a complex series of linked inflammatory and hemostatic changes that may occur in response to infection5. In addition, sepsis-induced muscle atrophy is associated with a preferential atrophy of fast muscle fibers, while the disuse condition induces a preferential atrophy of slow muscle fibers6. Muscle atrophy is mediated by decreased protein synthesis and increased protein degradation1. Inflammatory cytokines, such as tumor necrosis factor-alpha (TNF-α) and interleukin-6 (IL-6), are increased under sepsis conditions7. Additionally, inflammatory cytokines can increase muscle protein degradation2. Furthermore, skeletal muscle protein degradation under severe inflammatory conditions, such as sepsis, occurs primarily through the activation of the ubiquitin-proteasome pathway2. Therefore, blocking the activated ubiquitin-proteasome pathway may prevent sepsis-induced muscle atrophy.
Generally, resistance exercise training is an effective therapeutic intervention to prevent the muscle atrophy induced by diverse conditions8. However, it is difficult for severely ill patients to perform resistance exercises. In addition, sepsis can induce severe conditions in patients, making it difficult to perform the therapeutic resistance exercises. Electrical stimulation is an effective countermeasure and substitute for resistance exercise training, and can prevent muscle atrophy in severely ill patients9-12. In our previous study, the increased expression of ubiquitinated proteins, which is an indicator of ubiquitin-proteasome pathway activation in atrophied muscles, was inhibited by the muscle contractions elicited by low frequency, pulsed current electrical stimulation13,14. Therefore, electrical stimulation can be an effective therapeutic intervention for sepsis-induced muscle atrophy and disuse atrophy. However, pulsed current stimulation, which commonly used in the clinic, cannot elicit muscle contractions in the vast majority of muscles due to its low conductivity15. Low conductivity can be induced in adipose tissue, which has capacitance15. In addition, the electrical resistance of a capacitor is equal to 1/2πFC, where F is frequency and C is capacitance. Therefore, a higher frequency results in lower electrical resistance (impedance) to muscle stimulation. Electrical stimulation using a kilohertz frequency alternating current can also stimulate skeletal muscles16, because it has a higher frequency than the commonly used pulsed current16. In addition, electrical stimulation using kilohertz frequency alternating current is more comfortable for the patient than the pulsed current, and can elicit contraction in a vast range of muscle fibers12,16. Thus, electrical stimulation using kilohertz frequency alternating current, which is a type of burst-modulated alternating current, may be a more efficient therapeutic intervention for muscle atrophy than pulsed current electrical stimulation.
It is not clear if electrical stimulation is effective in preventing sepsis-induced muscle atrophy or in attenuating the ubiquitin-proteasome pathway activation via sepsis-induced inflammatory cytokines. We hypothesized that the electrical stimulation may be more effective in preventing sepsis-induced muscle atrophy via the attenuation of the ubiquitin-proteasome pathway activation. If verified, this could establish a new therapeutic modality that targets sepsis-induced muscle atrophy. The purpose of the present study was to evaluate the effects of electrical stimulation using kilohertz frequency (ES) on sepsis-induced muscle atrophy. To understand the role of the ubiquitin-proteasome pathway involved in this effect, we also analyzed the changes of myostatin, Akt/FoxO signaling, atrogin-1, and ubiquitinated proteins as major regulators or indicators of the pathway.
Methods
Experimental groups
A pilot study using 5 adult male ICR mice (body weight 30±1 g [mean ± SEM]; 6 weeks old; Japan SLC, Hamamatsu, Japan) provided information on the duration required to induce sepsis, after 1 week familiarization period. For the electrical stimulation study, 17 adult male ICR mice (body weight 30±1 g; 6 weeks old; Japan SLC, Hamamatsu, Japan) were randomly divided into 3 groups: control (Cont; body weight 30±1 g [mean ± SEM], n=6), lipopolysaccharide (LPS; body weight 31±1 g, n=5), and LPS plus electrical stimulation (ES) (LPS+ES; body weight 30±1 g, n=6) groups, after 1 week familiarization period. The ES group was subjected to therapeutic ES twice a day for 4 days. This study was approved by the Institutional Animal Care and Use Committee and was performed according to the Kobe University Animal Experimentation Regulations. All experiments were conducted in accordance with the National Institutes of Health (NIH) Guidelines for the Care and Use of Laboratory Animals (National Research Council, 1996).
Sepsis induce
Sepsis was induced by intraperitoneal (i.p.) LPS (10 µg/g body weight/day) injections, which has been previously described17. LPS was administered once a day for 7 days; the change in the body weight was measured (Figure 1). The animals had access to food and water ad libitum, and were housed in an isolated and environmental controlled room (22±2°C; 12 h-12 h light-dark cycle). The body weight of LPS-treated animals were decreased incriminatory and peaked at day 4 (-21.5%). However, their body weight recovered after days 4 till days 7, suggesting that LPS-induced sepsis advanced in its severity after 4 days and was an adequate period to investigate the preventive effects of an intervention for muscle atrophy. Therefore, we decided the sepsis induction and intervention would occur for 4 days.
Figure 1.
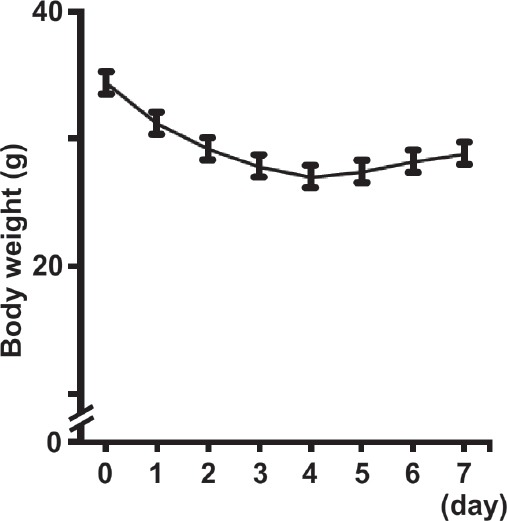
Changes in the body weight of lipopolysaccharide (LPS)-injected animals (daily administration for 7 days). Values are presented as the mean ± SEM.
Electrical stimulation protocol
The electrical stimulation began on day 1 of LPS administration and continued for 4 days. The animals in the LPS and LPS+ES groups were anesthetized during the electrical stimulation by an i.p. injection of pentobarbital sodium (40 mg/kg). The animals in the Cont and LPS groups were anesthetized at the same frequency as the LPS+ES group to exclude any influences from the anesthetic. An electrical stimulator (ES-360, Ito, Tokyo, Japan) that permitted electrical parameter changes was used to treat the tibialis anterior muscles transcutaneously. Two surface electrodes (3 mm in diameter) were adhered to the midpoint of both electrodes on the motor point of the tibialis anterior muscle. The stimulation for the LPS+ES group was a burst modulated waveform. The current was delivered at a frequency of 100 Hz. These stimulations could forcefully contract the tibialis anterior muscle, and the current intensity was set daily to produce a supramaximal contraction (25-35 mA). One burst of the electrical stimulation was delivered every 3 s (time on: 1 s; time off: 2 s) for 1 min, followed by 5 min of rest, as previously described13. Six consecutive stimulation sessions were performed twice a day, separated by a 9-h interval. The total duration of the electrical stimulation sessions was 240 s per day.
Sample preparation and histological analysis
Twelve hours after the final electrical stimulation, all animals were deeply anesthetized by an i.p. injection of sodium pentobarbital (40 mg/kg), and the tibialis anterior muscle was removed and weighed. The animals were then euthanized by an overdose of sodium pentobarbital. The tibialis anterior muscle samples were immediately frozen in an acetone/dry ice bath and stored at -80°C until histological and western blot analyses. Transverse tissue sections (12 µm thickness) were cut from the middle part of the muscle belly on a cryostat (CM-1510S, Leica Microsystems, Mannheim, Germany) at -25°C, and then mounted on glass slides. The sections were stained for hematoxylin-eosin (HE), as previously described18. The stained sections were used to determine the CSAs of the muscle fibers. A total of 1,200 fibers per Cont or LPS+ES group and 1,000 fibers per LPS group (200 fibers per muscle sample) were analyzed from a deep (near the bone) and superficial regions of each muscle. The sections were measured using the Image J software program (NIH, Bethesda, MD, USA).
Plasma collection and analyses
For the plasma collection, the animals were deeply anesthetized by an i.p. injection of pentobarbital sodium (40 mg/kg). The animals then were placed on a heated surgical table, and the abdominal cavity was opened. Blood was drawn from the vena cava and placed on ice. The blood samples then were centrifuged (15,000 × g for 10 min at 4°C), and the plasma supernatant samples were stored at -80°C until the TNF-α protein levels were measured.
ELISA for TNF-α
The plasma TNF-α protein expression levels were determined using a commercially available enzyme-linked immunosorbent assay (ELISA) kit, according to manufacturer’s instructions (eBioscience, San Diego, CA, USA).
Western blot analysis
A portion of the frozen tissue samples (20 mg) was homogenized in 5 M urea, 2 M thiourea, 10 mM sodium diphosphate decahydrate, 0.1% (v/v) 2-mercaptoethanol, and 1% (v/v) protease inhibitor cocktail for mammalian tissue (Sigma-Aldrich, Saint Louis, MO, USA); the levels of atrogin-1 and ubiquitinated protein were then determined. Another portion of the samples (20 mg) was homogenized in 1% NP-40, 20 mM Tris-HCl (pH 7.4), 25 mM NaCl, 5 mM EDTA, 5 mM EGTA, 1 mM dithiothreitol, 25 mM β-glycerophosphate, 50 mM NaF, 1% (v/v) protease inhibitor cocktail for mammalian tissue (Sigma-Aldrich), and 1% (v/v) phosphatase inhibitor cocktail for mammalian tissue (Sigma-Aldrich); these samples were used to determine TNF-α, Akt1 and FoxO3a levels. The homogenates were centrifuged at 15,000 × g for 25 min at 4°C. The total protein concentrations were determined with a protein determination kit (Bio-Rad, Hercules, CA, USA). The homogenates were solubilized in a sample loading buffer containing 50 mM Tris-HCl (pH 6.8), 2% sodium dodecyl sulfate, 10% glycerol, 5% β-mercaptoethanol, and 0.005% bromophenol blue. The protein samples (45 µg/lane) were separated by a 10% (for ubiquitinated protein detection) or 12.5% (for atrogin-1, Akt1, FoxO3a, myostatin, and TNF-α detection) SDS-polyacrylamide gel electrophoresis (SDS-PAGE); they were then transferred to polyvinylidene fluoride (PVDF) membranes. The membranes were blocked for 1 h with Tris-buffered saline with Tween 20 (TBST) containing 3% bovine serum albumin (BSA) and then incubated overnight at 4°C with the following primary antibodies: anti-polyubiquitin-protein conjugates (diluted 1:100; Enzo Life Sciences, Farmingdale, NY, USA), anti-atrogin-1 (diluted 1:1000; ECM Biosciences, Versailles, KY, USA), anti-phosphorylated Ser473-Akt1 (diluted 1:1000; Cell Signaling, Beverly, MA, USA), anti-Akt1 (diluted 1:1000; Cell Signaling), anti-phosphorylated Ser253-FoxO3a (diluted 1:1000; Cell Signaling), anti-FoxO3a (diluted 1:1000; Cell Signaling), anti-myostatin (diluted 1:200; Abcam, Cambridge, UK), and TNF-α (diluted 1:1000; Cell Signaling). The membranes then were incubated for 60 min at room temperature with either anti-mouse or anti-rabbit IgG conjugated to horseradish peroxidase (GE Healthcare, Waukesha, WI, USA). The membranes were developed using a chemiluminescent reagent (ECL, GE Healthcare) and analyzed using an image reader (LAS-1000, Fujifilm, Tokyo, Japan). The digitized signals were quantified using the Multi-Gauge Image Analysis Software program (Fujifilm). β-actin was used as an internal control.
Statistical analysis
The data are expressed as the mean ± SEM. The TNF-α plasma expression levels between the LPS and LPS+ES groups were analyzed by a Student’s t-test. Prior to the parametric analysis of variance (ANOVA) analyses, the group variances were tested and found to be not significantly different using the Shapiro-Wilk normality test. A one-way ANOVA was used to analyses the body weight, the muscle wet weight, the muscle fiber CSAs, and western blot protein expression levels among the 3 experimental groups, followed by a Tukey’s post hoc test. The statistical significance was set at p<0.05.
Results
Muscle wet weight
The group mean body weights, muscle wet weights, and muscle to body weight ratios are shown in Table 1. After 4 days of LPS administration, the body weights of the LPS and LPS+ES groups were significantly lower than that of the Cont group (LPS: -29.0%, LPS+ES: -23.1%). The tibialis anterior muscle wet weights were significantly lower in the LPS and LPS+ES groups than that of the Cont group. For the tibialis anterior muscle, the muscle wet weights and the ratios of muscle wet weight to body weight in the LPS+ES group were significantly larger than those in the LPS group.
Table 1.
Body weights, muscle wet weights, and muscle to body weight ratios following electrical stimulation.
| Cont | LPS | LPS+ES | |
|---|---|---|---|
| Body weight (g) | 33±1 | 24±1* | 26±1* |
| Muscle wet weight (mg) | 51±1 | 34±1* | 44±1*† |
| Muscle to body weight ratio (mg/g) | 1.51±0.02 | 1.42±0.05* | 1.71±0.07† |
Values are the mean ± SEM. Control (Cont) and lipopolysaccharide (LPS) plus electrical stimulation (ES) groups, n=6; LPS group, n=5. Cont, no treatment; LPS, LPS injection for 4 days; LPS+ES, LPS plus electrical stimulation.
and
indicate significant differences from the control and LPS groups, respectively, at P<0.05.
Muscle fiber CSA
In the whole (superficial + deep) (Figure 2a), superficial (Figure 2b), and deep layer (Figure 2c) of tibialis anterior muscle, the CSAs of the muscle fibers were significantly smaller in the LPS and LPS+ES groups than in the Cont group. However, the CSAs in the LPS+ES group were significantly larger than those in the LPS group.
Figure 2.
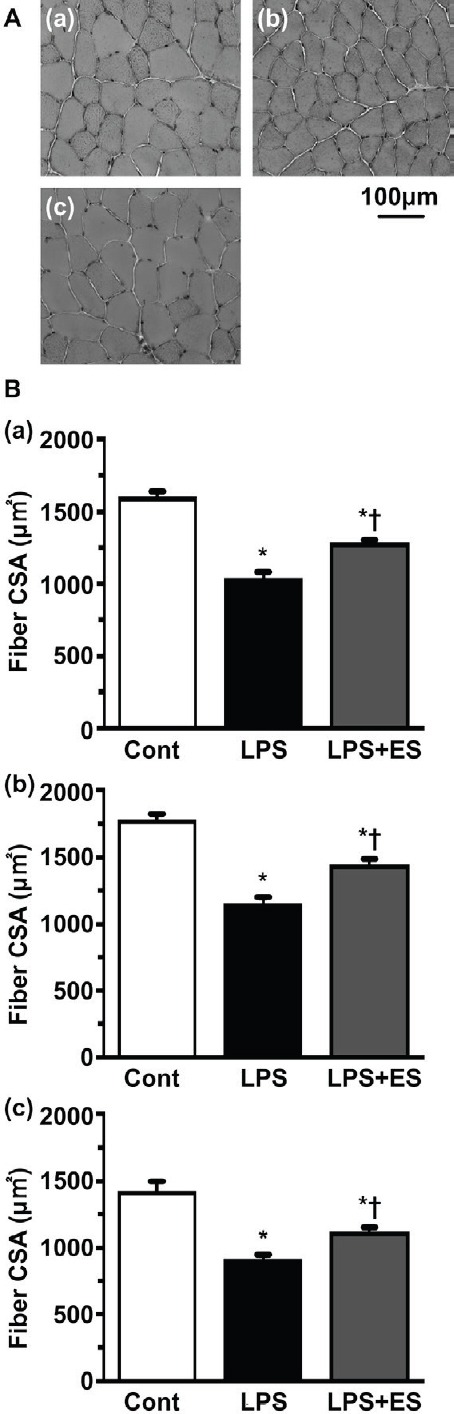
Transverse sections of the tibialis anterior muscle stained for hematoxylin (HE). Control (Cont) group (a); Lipopolysaccharide (LPS) group (b); LPS+ electrical stimulation (ES) group (c). Bar = 100 µm. Cross-sectional areas of whole (superficial + deep) muscle fibers (Figure 2a), superficial (Figure 2b), and deep layer (Figure 2c) in the tibialis anterior muscle. Values are presented as the mean ± SEM. * and † indicate significant differences from the Cont and LPS groups, respectively, at P<0.05.
TNF-α expression
The TNF-α plasma expression levels were not detected in the Cont group, because the values were too small and resided outside the calibration curve (Figure 3A). The TNF-α plasma expression levels in the LPS and LPS+ES groups were increased compared to that of the Cont group, although these differences were not statistically significant.
Figure 3.
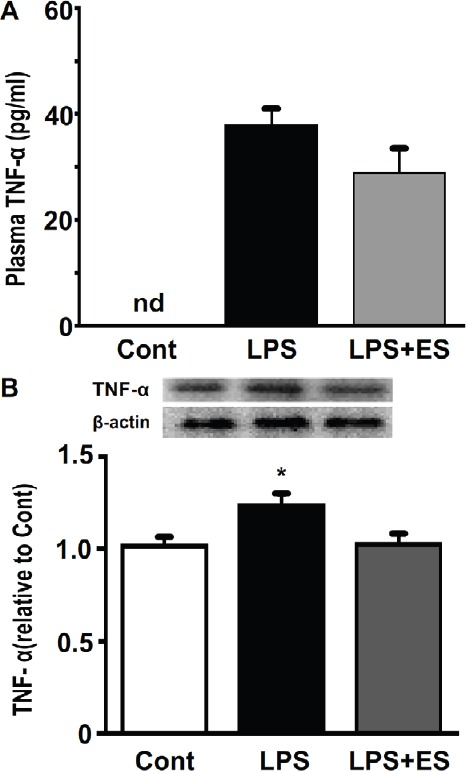
TNF-α protein concentration levels in plasma (Figure 3A) and expression levels of in the tibialis anterior muscle (Figure 3B). Values are mean ± SEM. nd: not detected. Representative western blots indicate the expression of TNF-α in the tibialis anterior muscle. The histogram shows the quantification of the band densities. The expression levels were calculated as the fold change relative to the control (Cont) group. * indicates significant differences from the Cont and lipopolysaccharide (LPS), respectively, at P<0.05.
The TNF-α expression in the tibialis anterior muscle was significantly higher in the LPS group than that in the Cont group (Figure 3B). However, there were no significant differences between the Cont and LPS+ES groups.
Myostatin expression
Myostatin expression in the tibialis anterior muscle was significantly higher in the LPS and LPS+ES groups than that in the Cont group (Figure 4). However, myostatin expression in the LPS+ES group was significantly lower than that of the LPS group.
Figure 4.
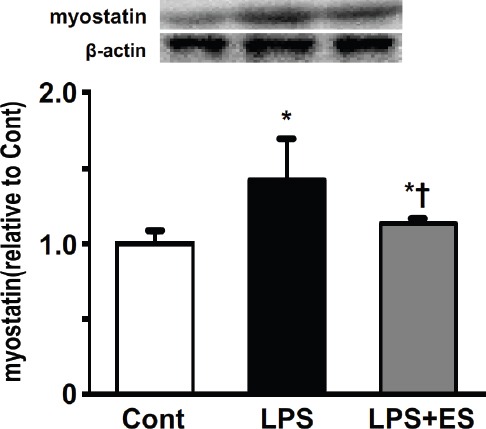
Expression levels of myostatin in the tibialis anterior muscle. Representative western blots indicate the expression of myostatin. The histogram shows the quantification of the band densities. The expression levels were calculated as the fold change relative to the control (Cont) group and are presented as the mean ± SEM. * and † indicate significant differences from the Cont and lipopolysaccharide (LPS), respectively, at P<0.05.
Akt/FoxO pathway
The ratios of phosphorylated Akt1 to total Akt1 protein (Figure 5) and of phosphorylated FoxO3a to total FoxO3a protein (Figure 6) were lower in the LPS group compared to that of the Cont group. However, the LPS+ES group levels were significantly larger than those in the LPS group.
Figure 5.
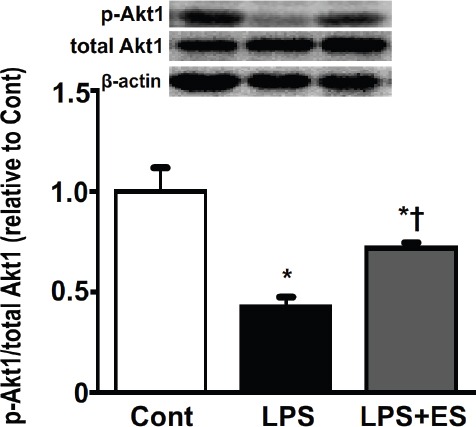
The ratios of phosphorylated Akt1 to total Akt1 protein in the tibialis anterior muscle. Representative western blots indicate the levels of phosphorylated Akt1 and total Akt1 protein. The histogram shows the ratio of phosphorylated and total Akt1 protein band densities. The ratios of phosphorylated and total protein levels were calculated as the fold change relative to the control (Cont) group and are presented as mean ± SEM. * and † indicate significantly different from the Cont and lipopolysaccharide (LPS), respectively, at P<0.05.
Figure 6.
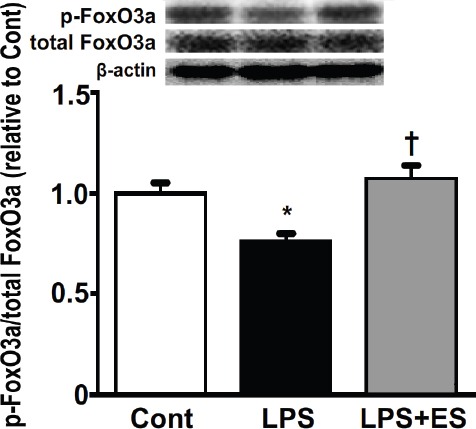
The ratio of phosphorylated FoxO3a to total FoxO3a protein in the tibialis anterior muscle. Representative western blots indicate the expression of phosphorylated FoxO3a and total FoxO3a protein. The histogram shows the ratio of phosphorylated and total FoxO3a protein band densities. The ratio of phosphorylated and total protein levels was calculated as the fold change relative to the control (Cont) group and are presented as the mean ± SEM. * and † indicate significant differences from the Cont and lipopolysaccharide (LPS), respectively, at P<0.05.
Ubiquitin-proteasome pathway
Atrogin-1 expression in the tibialis anterior muscle was significantly higher in the LPS and LPS+ES groups than that in the Cont group (Figure 7). However, atrogin-1 expression in the LPS+ES group was significantly lower than that of the LPS group. The expression levels of the ubiquitinated proteins in the tibialis anterior muscle were significantly higher in the LPS and LPS+ES groups than the levels in the Cont group (Figure 8). The expression levels in the LPS+ES group were significantly lower than the levels in the LPS group.
Figure 7.
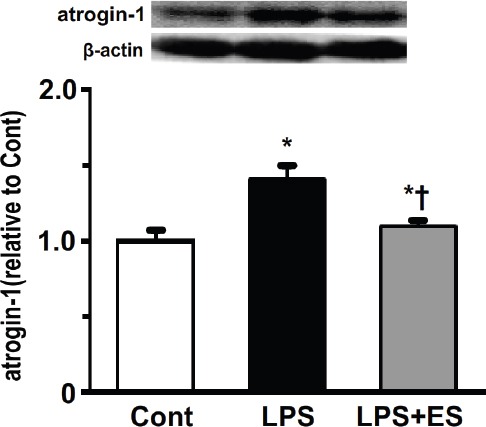
Expression levels of atrogin-1 in the tibialis anterior muscle. Representative western blots indicate the expression of atrogin-1. The histogram shows the quantification of the band densities. The expression levels were calculated as the fold change relative to the control (Cont) group and are presented as the mean ± SEM. * and † indicate significant differences from the Cont and lipopolysaccharide (LPS), respectively, at P<0.05.
Figure 8.
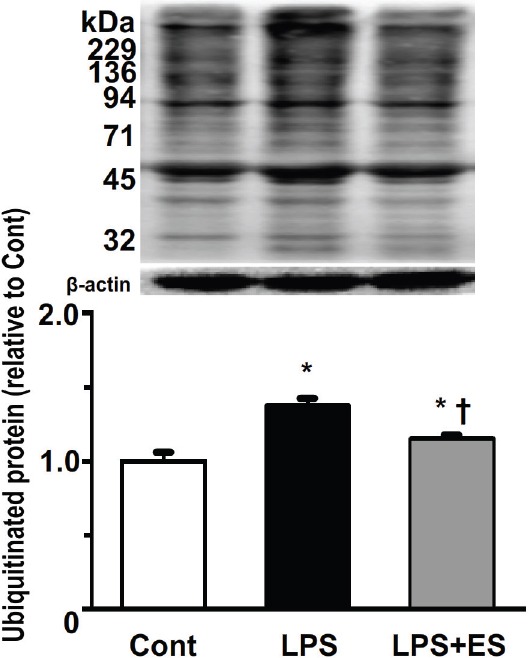
Expression of ubiquitinated proteins in the tibialis anterior muscle. Representative western blots and histograms showing the quantification of the band densities. Values were calculated as the fold change relative to the control (Cont) group and are presented as the mean ± SEM. * and † indicate significant differences from the Cont and lipopolysaccharide (LPS), respectively, at P<0.05.
Discussion
In the present study, we found that kilohertz frequency electrical stimulation inhibited the sepsis-induced loss of muscle mass, improved the reduction of muscle fiber CSA, and lowered the increased expression of atrogin-1 and ubiquitinated proteins in the tibialis anterior muscle, which contributed to the prevention of muscle atrophy under septic conditions (Figure 9).
Figure 9.
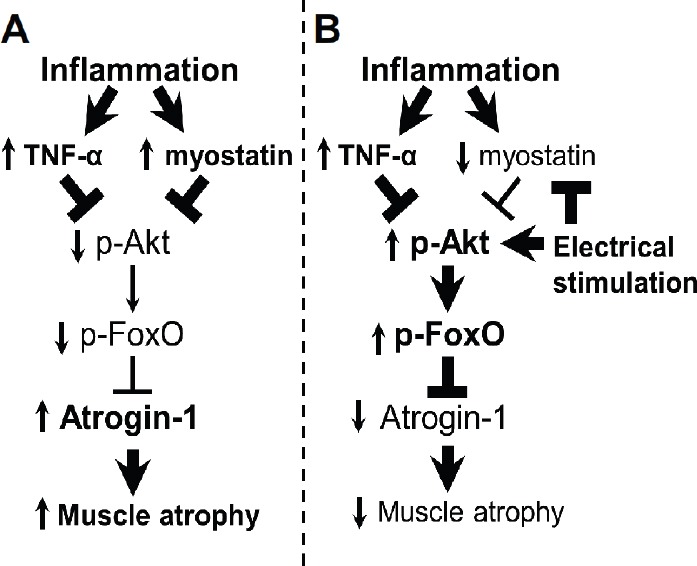
Schematic representation of the role of the Akt signaling pathway and ubiquitin-proteasome pathway in sepsis-induced muscle atrophy (A) and in the amelioration of atrophy by electrical stimulation (B). Boldface arrows, activation; boldface blunt bars, inhibition; upward arrows, up-regulation; downward arrows, down-regulation.
Four days of LPS-induced sepsis caused loss of muscle mass and fiber CSA, increased inflammatory cytokines and increased the expression of atrogin-1 and ubiquitinated proteins in the tibialis anterior muscle. Previous studies have suggested that sepsis involves inflammation caused by a reduction in muscle protein synthesis and an increase in muscle protein degradation3,19,20. In addition, the sepsis-induced protein degradation is primarily caused by the ubiquitin-proteasome pathway20,21. In the ubiquitin-proteasome pathway, there are 2 degradation steps for muscle protein. The first step is the formation of ubiquitinated proteins, which are ubiquitin molecules conjugated to the target proteins as the tag for degradation. The second step is the degradation of the tagged protein by the 26S proteasome22. In the first step, muscle-specific ubiquitin ligases, such as atrogin-1, play an important role for increasing ubiquitinated proteins22. In addition, atrogin-1 is increased in atrophied muscles2. Furthermore, the activation of the ubiquitin-proteasome pathway has been correlated with an increased expression of atrogin-1 and ubiquitinated proteins23. Therefore, the increased expression of atrogin-1 and the ubiquitinated proteins are an indicator of the activated ubiquitin-proteasome pathway. On the other hand, it has been suggested that sepsis can induce the up-regulation of inflammatory cytokines24. In inflammatory cytokine-induced atrophied muscles, the rates of protein degradation increase through the activation of the ubiquitin-proteasome pathway2. The deactivation of the Akt signaling pathway is involved in the activation of the ubiquitin-proteasome pathway via the dephosphorylation of the forkhead box O (FoxO) class of transcription factors. These factors have been identified as key regulators of the ubiquitin-proteasome pathway, which are located downstream of the Akt signaling pathway. In addition, the Akt signaling pathway can suppress the activation of the ubiquitin-proteasome pathway via FoxO phosphorylation25. A previous study indicated that the Akt signaling pathway was suppressed by inflammatory cytokines such as TNF-α25. In addition, it has been suggested that up-regulation of myostatin expression was caused by inflammatory diseases such as sepsis and deactivated Akt signaling pathway26. These findings suggest that increased levels of inflammatory cytokines may be induced by the activation of the ubiquitin-proteasome pathway through the suppression of the Akt signaling pathway, which is consistent with the results of the present study.
In a previous study, it was reported that electrical stimulation attenuated disuse-induced muscle atrophy in the tibialis anterior muscle8. In addition, the conductivity of the kilohertz frequency may contribute to its effectiveness in preventing atrophy in a vast area of muscle compared to the effects of low frequency electrical stimulation13. Furthermore, electrical stimulation using kilohertz frequency was effective for muscle atrophy of muscle fibers located deep layer of skeletal muscle13. Whereas, our and other previous studies have suggested that low frequency electrical stimulation was not effective for deep muscle fibers13,27. In the present study, the results of muscle fiber cross-sectional area located superficial and deep muscle fibers suggested that electrical stimulation using kilohertz frequency was effective for muscle atrophy in both the superficial and the deep muscle fibers. Therefore, electrical stimulation using kilohertz frequency could induce a contraction of a large area of muscle fibers in the present study.
We found that electrical stimulation using kilohertz frequency attenuated the expression of atrogin-1 and ubiquitinated proteins in the tibialis anterior muscle, which resulted in an inhibition of the atrophy-induced morphological reductions. It is possible that the exercise-induced muscle contractions could activate the Akt signaling pathway28,29. In addition, it has been suggested that up-regulation of myostatin expression induced by systemic inflammatory diseases such as heart failure, cancer, and sepsis was attenuated by exercise-induced muscle contractions30,31. Electrical stimulation can induce muscle contractions directly. In addition, these effects depend on the intensity of the muscle contraction, which in turn depends on muscle fiber recruitment32. These findings suggest that the contraction of a vast area of muscle induced by kilohertz frequency electrical stimulation could lead to the effective suppression of the deactivated Akt signaling pathway. Therefore, kilohertz frequency electrical stimulation induced a contraction of a large area of muscle fibers; the appropriate amount of muscle contraction could inhibit the activation of the ubiquitin-proteasome pathway through a suppression of a deactivated intracellular signaling pathway, such as the Akt signaling pathway.
Our results demonstrate that electrical stimulation failed to attenuate the increase in plasma and muscle TNF-α levels. It has been suggested that LPS-induced TNF-α, which was induced muscle atrophy, is produced in classic immune tissues, such as the liver, spleen, and lung33. The produced TNF-α can deactivate intracellular signaling pathways, such as Akt signaling pathway, in skeletal muscles21. In addition, although aerobic exercise training has anti-inflammatory effects, resistance training can have an anti-catabolic effect for systemic inflammation34,35. The electrical stimulation could induce resistance training and muscle contractions to a limited number of muscles located under the electrodes. In addition, it has been suggested that high intensity exercise training can induce increasing systemic inflammation36. The attenuated effect of systemic inflammatory cytokines using electrical stimulation may be limited in the present study. However, in sepsis, it could attenuate the deactivation of intracellular signaling pathways in skeletal muscles undergoing muscle contractions without an increase in systemic inflammatory cytokines. Therefore, it may be essential to induce muscle contractions for prevention of sepsis-induced muscle atrophy.
The results of the present study demonstrate that kilohertz frequency electrical stimulation was effective for the prevention of sepsis-induced muscle atrophy. Several studies have suggested that the sepsis-induced muscle atrophy is closely linked to the decline of activity of daily living (ADL)37-39. In addition, the severity of sepsis is related with the length of an intensive care unit (ICU) stay and muscle atrophy progression40. Furthermore, it is important to inhibit sepsis-induced muscle atrophy in order to shorten the length of ICU stays and improve muscle atrophy after severe sepsis41. Therefore, the results in the present study suggest that kilohertz frequency electrical stimulation could prevent sepsis-induced muscle atrophy, which would reduce ICU stay length and the recovery from ADL decline.
In conclusion, the kilohertz frequency electrical stimulation inhibited sepsis-induced muscle atrophy. Additionally, the electrical stimulation inhibited the activation of the ubiquitin-proteasome pathway through the suppression of the deactivated Akt signaling pathway in calf muscles. These results suggest that kilohertz frequency electrical stimulation has the potential to become an effective therapeutic intervention for the prevention of sepsis-induced muscle atrophy.
Acknowledgements
This study was supported by Grants-in-Aid for Scientific Research from the Japanese Ministry of Education, Culture, Sports, Science and Technology.
Footnotes
The authors have no conflict of interest.
Edited by: M. Hamrick
References
- 1.Thomason DB, Booth FW. Atrophy of the soleus muscle by hindlimb unweighting. Journal of applied physiology. 1990;68:1–12. doi: 10.1152/jappl.1990.68.1.1. [DOI] [PubMed] [Google Scholar]
- 2.Jackman RW, Kandarian SC. The molecular basis of skeletal muscle atrophy. American journal of physiology Cell physiology. 2004;287:C834–43. doi: 10.1152/ajpcell.00579.2003. [DOI] [PubMed] [Google Scholar]
- 3.Lang CH, Frost RA, Vary TC. Regulation of muscle protein synthesis during sepsis and inflammation. American journal of physiology Endocrinology and metabolism. 2007;293:E453–9. doi: 10.1152/ajpendo.00204.2007. [DOI] [PubMed] [Google Scholar]
- 4.Tisdale MJ. Mechanisms of cancer cachexia. Physiological reviews. 2009;89:381–410. doi: 10.1152/physrev.00016.2008. [DOI] [PubMed] [Google Scholar]
- 5.American College of Chest Physicians/Society of Critical Care Medicine Consensus Conference:definitions for sepsis and organ failure and guidelines for the use of innovative therapies in sepsis. Critical care medicine. 1992;20:864–74. [PubMed] [Google Scholar]
- 6.Yu Z, Li P, Zhang M, Hannink M, Stamler JS, Yan Z. Fiber type-specific nitric oxide protects oxidative myofibers against cachectic stimuli. PloS one. 2008;3:e2086. doi: 10.1371/journal.pone.0002086. [DOI] [PMC free article] [PubMed] [Google Scholar]
- 7.Fernandez-Celemin L, Pasko N, Blomart V, Thissen JP. Inhibition of muscle insulin-like growth factor I expression by tumor necrosis factor-alpha. American journal of physiology Endocrinology and metabolism. 2002;283:E1279–90. doi: 10.1152/ajpendo.00054.2002. [DOI] [PubMed] [Google Scholar]
- 8.Fujita N, Murakami S, Fujino H. The combined effect of electrical stimulation and high-load isometric contraction on protein degradation pathways in muscle atrophy induced by hindlimb unloading. Journal of biomedicine & biotechnology. 2011;2011:401493. doi: 10.1155/2011/401493. [DOI] [PMC free article] [PubMed] [Google Scholar]
- 9.Iwasaki T, Shiba N, Matsuse H, et al. Improvement in knee extension strength through training by means of combined electrical stimulation and voluntary muscle contraction. The Tohoku journal of experimental medicine. 2006;209:33–40. doi: 10.1620/tjem.209.33. [DOI] [PubMed] [Google Scholar]
- 10.Petrofsky JS, Laymon M. The effect of ageing in spinal cord injured humans on the blood pressure and heart rate responses during fatiguing isometric exercise. European journal of applied physiology. 2002;86:479–86. doi: 10.1007/s00421-002-0588-2. [DOI] [PubMed] [Google Scholar]
- 11.Petterson S, Snyder-Mackler L. The use of neuromuscular electrical stimulation to improve activation deficits in a patient with chronic quadriceps strength impairments following total knee arthroplasty. The Journal of orthopaedic and sports physical therapy. 2006;36:678–85. doi: 10.2519/jospt.2006.2305. [DOI] [PubMed] [Google Scholar]
- 12.Selkowitz DM. Improvement in isometric strength of the quadriceps femoris muscle after training with electrical stimulation. Physical therapy. 1985;65:186–96. doi: 10.1093/ptj/65.2.186. [DOI] [PubMed] [Google Scholar]
- 13.Tanaka M, Hirayama Y, Fujita N, Fujino H. Comparison of premodulated interferential and pulsed current electrical stimulation in prevention of deep muscle atrophy in rats. Journal of molecular histology. 2013;44:203–11. doi: 10.1007/s10735-012-9473-4. [DOI] [PubMed] [Google Scholar]
- 14.Tanaka M, Hirayama Y, Fujita N, Fujino H. Electrical stimulation using sine waveform prevents unloading-induced muscle atrophy in the deep calf muscles of rat. Acta histochemica. 2014;116:1192–8. doi: 10.1016/j.acthis.2014.06.009. [DOI] [PubMed] [Google Scholar]
- 15.Petrofsky J. The effect of the subcutaneous fat on the transfer of current through skin and into muscle. Medical engineering & physics. 2008;30:1168–76. doi: 10.1016/j.medengphy.2008.02.009. [DOI] [PubMed] [Google Scholar]
- 16.Ward AR. Electrical stimulation using kilohertz-frequency alternating current. Physical therapy. 2009;89:181–90. doi: 10.2522/ptj.20080060. [DOI] [PubMed] [Google Scholar]
- 17.Bian Y, Zhao X, Li M, Zeng S, Zhao B. Various roles of astrocytes during recovery from repeated exposure to different doses of lipopolysaccharide. Behavioural brain research. 2013;253:253–61. doi: 10.1016/j.bbr.2013.07.028. [DOI] [PubMed] [Google Scholar]
- 18.Miyazaki M, Hitomi Y, Kizaki T, et al. Calcineurin-mediated slow-type fiber expression and growth in reloading condition. Medicine and science in sports and exercise. 2006;38:1065–72. doi: 10.1249/01.mss.0000222833.43520.6e. [DOI] [PubMed] [Google Scholar]
- 19.Krawiec BJ, Frost RA, Vary TC, Jefferson LS, Lang CH. Hindlimb casting decreases muscle mass in part by proteasome-dependent proteolysis but independent of protein synthesis. American journal of physiology Endocrinology and metabolism. 2005;289:E969–80. doi: 10.1152/ajpendo.00126.2005. [DOI] [PubMed] [Google Scholar]
- 20.Dehoux MJ, van Beneden RP, Fernandez-Celemin L, Lause PL, Thissen JP. Induction of MafBx and Murf ubiquitin ligase mRNAs in rat skeletal muscle after LPS injection. FEBS letters. 2003;544:214–7. doi: 10.1016/s0014-5793(03)00505-2. [DOI] [PubMed] [Google Scholar]
- 21.Jin B, Li YP. Curcumin prevents lipopolysaccharide-induced atrogin-1/MAFbx upregulation and muscle mass loss. Journal of cellular biochemistry. 2007;100:960–9. doi: 10.1002/jcb.21060. [DOI] [PMC free article] [PubMed] [Google Scholar]
- 22.Glickman MH, Ciechanover A. The ubiquitin-proteasome proteolytic pathway:destruction for the sake of construction. Physiological reviews. 2002;82:373–428. doi: 10.1152/physrev.00027.2001. [DOI] [PubMed] [Google Scholar]
- 23.Judge AR, Koncarevic A, Hunter RB, Liou HC, Jackman RW, Kandarian SC. Role for IkappaBalpha, but not c-Rel, in skeletal muscle atrophy. American journal of physiology Cell physiology. 2007;292:C372–82. doi: 10.1152/ajpcell.00293.2006. [DOI] [PubMed] [Google Scholar]
- 24.Wheeler AP, Bernard GR. Treating patients with severe sepsis. The New England journal of medicine. 1999;340:207–14. doi: 10.1056/NEJM199901213400307. [DOI] [PubMed] [Google Scholar]
- 25.Sandri M, Sandri C, Gilbert A, et al. Foxo transcription factors induce the atrophy-related ubiquitin ligase atrogin-1 and cause skeletal muscle atrophy. Cell. 2004;117:399–412. doi: 10.1016/s0092-8674(04)00400-3. [DOI] [PMC free article] [PubMed] [Google Scholar]
- 26.McFarlane C, Plummer E, Thomas M, et al. Myostatin induces cachexia by activating the ubiquitin proteolytic system through an NF-kappaB-independent, FoxO1-dependent mechanism. J Cell Physiol. 2006;209:501–14. doi: 10.1002/jcp.20757. [DOI] [PubMed] [Google Scholar]
- 27.Matsumoto A, Fujita N, Arakawa T, Fujino H, Miki A. Influence of electrical stimulation on calpain and ubiquitin-proteasome systems in the denervated and unloaded rat tibialis anterior muscles. Acta histochemica. 2014;116:936–42. doi: 10.1016/j.acthis.2014.03.006. [DOI] [PubMed] [Google Scholar]
- 28.Chen HI, Hsieh SY, Yang FL, Hsu YH, Lin CC. Exercise training attenuates septic responses in conscious rats. Medicine and science in sports and exercise. 2007;39:435–42. doi: 10.1249/mss.0b013e31802d11c8. [DOI] [PubMed] [Google Scholar]
- 29.Schoenfeld BJ. The mechanisms of muscle hypertrophy and their application to resistance training. Journal of strength and conditioning research / National Strength & Conditioning Association. 2010;24:2857–72. doi: 10.1519/JSC.0b013e3181e840f3. [DOI] [PubMed] [Google Scholar]
- 30.LeBrasseur NK, Walsh K, Arany Z. Metabolic benefits of resistance training and fast glycolytic skeletal muscle. American journal of physiology Endocrinology and metabolism. 2011;300:E3–10. doi: 10.1152/ajpendo.00512.2010. [DOI] [PMC free article] [PubMed] [Google Scholar]
- 31.Fanzani A, Conraads VM, Penna F, Martinet W. Molecular and cellular mechanisms of skeletal muscle atrophy:an update. J Cachexia Sarcopenia Muscle. 2012;3:163–79. doi: 10.1007/s13539-012-0074-6. [DOI] [PMC free article] [PubMed] [Google Scholar]
- 32.Henneman E, Somjen G, Carpenter DO. Excitability and inhibitability of motoneurons of different sizes. Journal of neurophysiology. 1965;28:599–620. doi: 10.1152/jn.1965.28.3.599. [DOI] [PubMed] [Google Scholar]
- 33.Frost RA, Nystrom GJ, Lang CH. Lipopolysaccharide regulates proinflammatory cytokine expression in mouse myoblasts and skeletal muscle. American journal of physiology Regulatory, integrative and comparative physiology. 2002;283:R698–709. doi: 10.1152/ajpregu.00039.2002. [DOI] [PubMed] [Google Scholar]
- 34.Lira FS, Neto JC, Seelaender M. Exercise training as treatment in cancer cachexia. Applied physiology, nutrition, and metabolism =Physiologie appliquee, nutrition et metabolisme. 2014;39:679–86. doi: 10.1139/apnm-2013-0554. [DOI] [PubMed] [Google Scholar]
- 35.Petersen AM, Pedersen BK. The anti-inflammatory effect of exercise. Journal of applied physiology. 2005;98:1154–62. doi: 10.1152/japplphysiol.00164.2004. [DOI] [PubMed] [Google Scholar]
- 36.Armstrong RB, Ogilvie RW, Schwane JA. Eccentric exercise-induced injury to rat skeletal muscle. Journal of applied physiology:respiratory, environmental and exercise physiology. 1983;54:80–93. doi: 10.1152/jappl.1983.54.1.80. [DOI] [PubMed] [Google Scholar]
- 37.Andersson E, Oddsson L, Grundstrom H, Thorstensson A. The role of the psoas and iliacus muscles for stability and movement of the lumbar spine, pelvis and hip. Scandinavian journal of medicine & science in sports. 1995;5:10–6. doi: 10.1111/j.1600-0838.1995.tb00004.x. [DOI] [PubMed] [Google Scholar]
- 38.Diffee GM, Caiozzo VJ, Herrick RE, Baldwin KM. Contractile and biochemical properties of rat soleus and plantaris after hindlimb suspension. The American journal of physiology. 1991;260:C528–34. doi: 10.1152/ajpcell.1991.260.3.C528. [DOI] [PubMed] [Google Scholar]
- 39.Ikezoe T, Mori N, Nakamura M, Ichihashi N. Atrophy of the lower limbs in elderly women:is it related to walking ability? European journal of applied physiology. 2011;111:989–95. doi: 10.1007/s00421-010-1728-8. [DOI] [PubMed] [Google Scholar]
- 40.Rodriguez PO, Setten M, Maskin LP, et al. Muscle weakness in septic patients requiring mechanical ventilation:protective effect of transcutaneous neuromuscular electrical stimulation. Journal of critical care. 2012;27:319.e1–8. doi: 10.1016/j.jcrc.2011.04.010. [DOI] [PubMed] [Google Scholar]
- 41.Kayambu G, Boots RJ, Paratz JD. Early rehabilitation in sepsis:a prospective randomised controlled trial investigating functional and physiological outcomes The i-PERFORM Trial (Protocol Article) BMC anesthesiology. 2011;11:21. doi: 10.1186/1471-2253-11-21. [DOI] [PMC free article] [PubMed] [Google Scholar]